The logistics industry passes through a period of uncertainty defined by increasing labor costs and disruption from new entrants.
While automation is a clear keystone of effective logistics strategy, the main challenge is to align automation and digitalization initiatives with overall strategy considering the strategic ambitions of stakeholders and possible scenarios.
In this article, we’ll discuss a generic strategy with KPIs that strategists from transportation and logistics companies can use to create a change strategy for their organization.
The Challenges of Strategists in Logistics
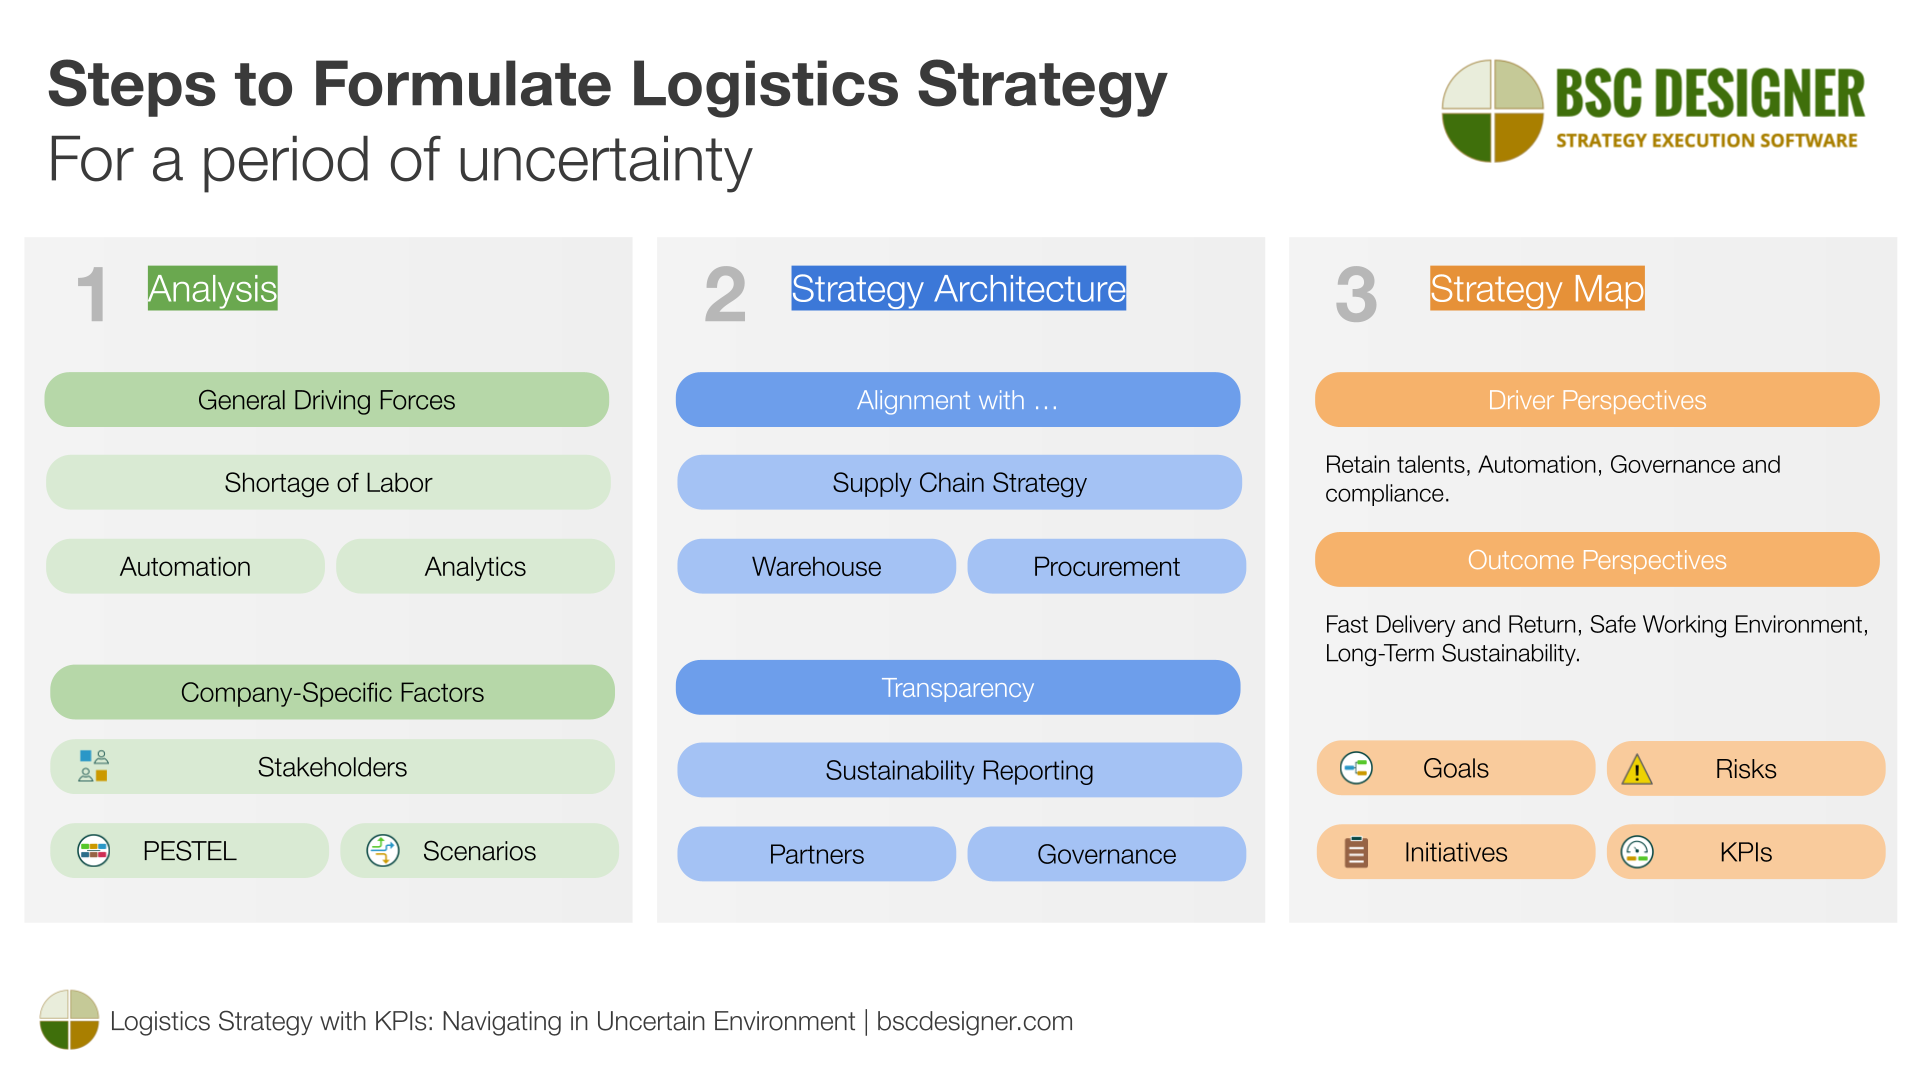
As discussed in the strategy implementation guide, to navigate successfully in uncertain environment, transportation and logistic companies need to:
- Project the industry’s driving forces on their business.
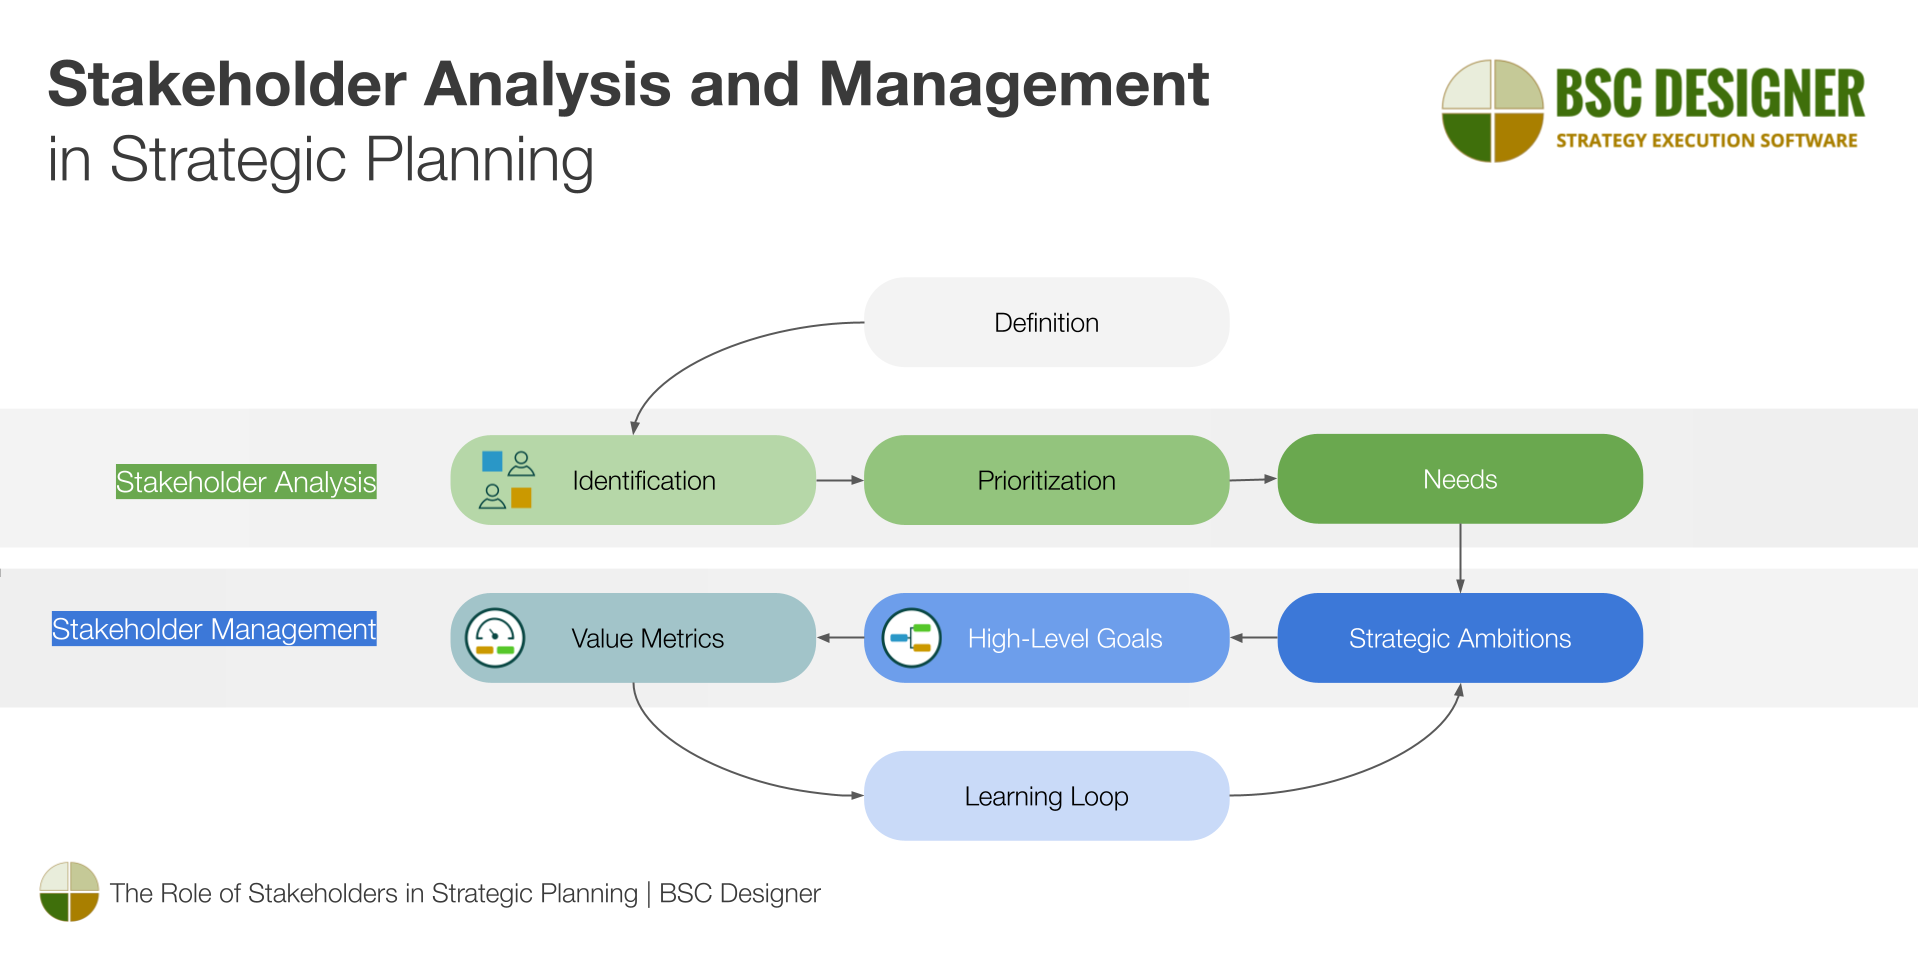
- Analyze the stakeholders involved and their needs.
- Ensure transparency required for governance and sustainability reporting.
- Map high-level goals and define risks.
- Quantify the value as perceived by stakeholders.
- Align the goals and initiatives with overall supply chain strategy.
- Align the goals and initiatives with scorecards for warehousing and procurement.
- Split up high-level goals into more specific sub-goals.
Driving Forces of Logistics Industry
According to PWC1, the key driving forces of logistics industry are:
- Shortage of labor.
- Emerging requirements of customers, such as need for faster delivery, customization, and omnichannel.
- Competition from new entrants: “sharing” business models to address last-mile delivery challenge, suppliers diversifying in logistics.
The typical response strategies include:
- Automation
- Data analytics
- Investing in IT expertise
- Standardization and preparedness for Physical Internet
These findings overlap with the insights from the McKinsey report2:
- Using automation to reduce the dependency on the labor market
- Growth of demand from ecommerce
- Challenge of managing spiky demand
- Challenges related to automation: implementing optimal equipment into the warehouse layout, training employees, and regular maintenance, etc.
In addition to analysis of general driving forces, consider using these frameworks for strategic planning to better understand the factors specific for your logistics company:
- Stakeholder analysis to prioritize the needs of interested parties.
- PESTEL for analysis of external factors like extreme weather events and their impact on logistics.
- Porter’s Five Forces to understand the competitive environment.
- Ansoff Matrix to assess quantitatively alternative diversification strategies.
Align Logistics Scorecard with Relevant Functional Scorecards
Some driving forces and response strategies are already well described within other functional/strategy scorecards:
In the strategy architecture based on aligned scorecards, instead of copying indicators and their data from those scorecards into the logistics scorecard, we can align the scorecards by normalized goals.
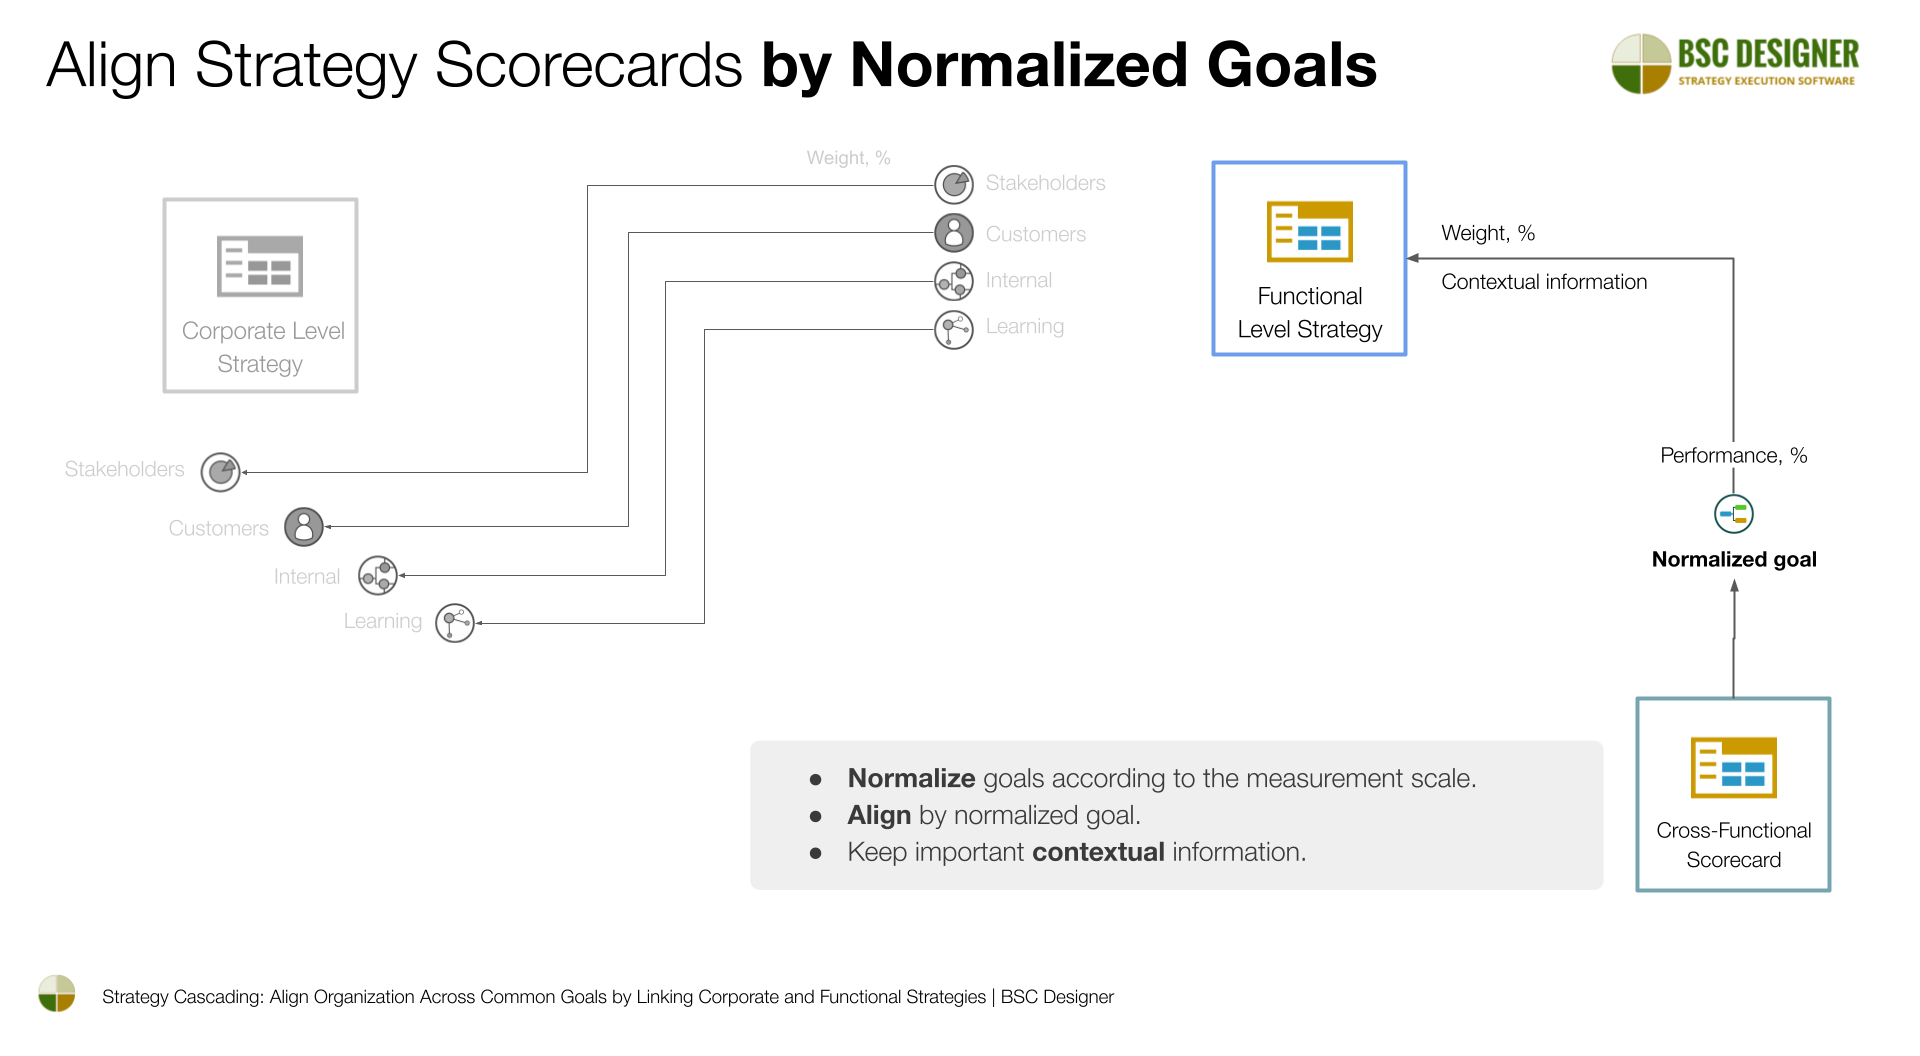
For example, a safe work environment is one of the success factors of retaining talents in a company. Instead of describing the safety strategy in the logistics scorecard in detail, we can align safety and logistics scorecards by normalized goal “Safety Awareness”.
In this case, the lagging performance of the “Safety Awareness” goal from the “Safety” scorecard is used as a leading indicator for the “Retain talents” on the logistics scorecard.
The alignment between strategies is multilevel. In our template:
- The Logistics strategy scorecard is aligned tod Supply Chain strategy, and
- The Supply Chain strategy is aligned with the Governance scorecard.
The strategy architecture based on aligned scorecard facilitates scenario planning:
- Create strategy scorecards for different scenarios
- Formulate prevention and response strategies
- If a specific scenario occurs, align the required strategy scorecard with current strategy
Practical tips:
- Users can explore more details about the aligned goal by clicking on the name of the source scorecard.
- In the template, the scorecards are aligned for demonstration purposes; in real use case, make sure that all scorecards are created in your account first and then align them.
Transparency and Compliance
The role of regulatory compliance increases all over the world. For example, the European sustainability reporting regulation3 requires strategy to be more transparent in terms of stakeholders, governance, strategy, and performance indicators.
On the practical level for logistics strategy, it means:
- Having a formal strategy like we discuss below.
- Ensuring access to the required strategy and functional scorecards for the stakeholders. This might be reports for regulators or direct access to certain parts of strategy for partners.
- Tracking and reporting performance metrics approved internally or established regulator’s reporting framework.
The Strategy Map for Logistics
The key part of the logistics strategy template is a strategy map. Here are some ideas to understand its structure and practical application.
Perspective of the map
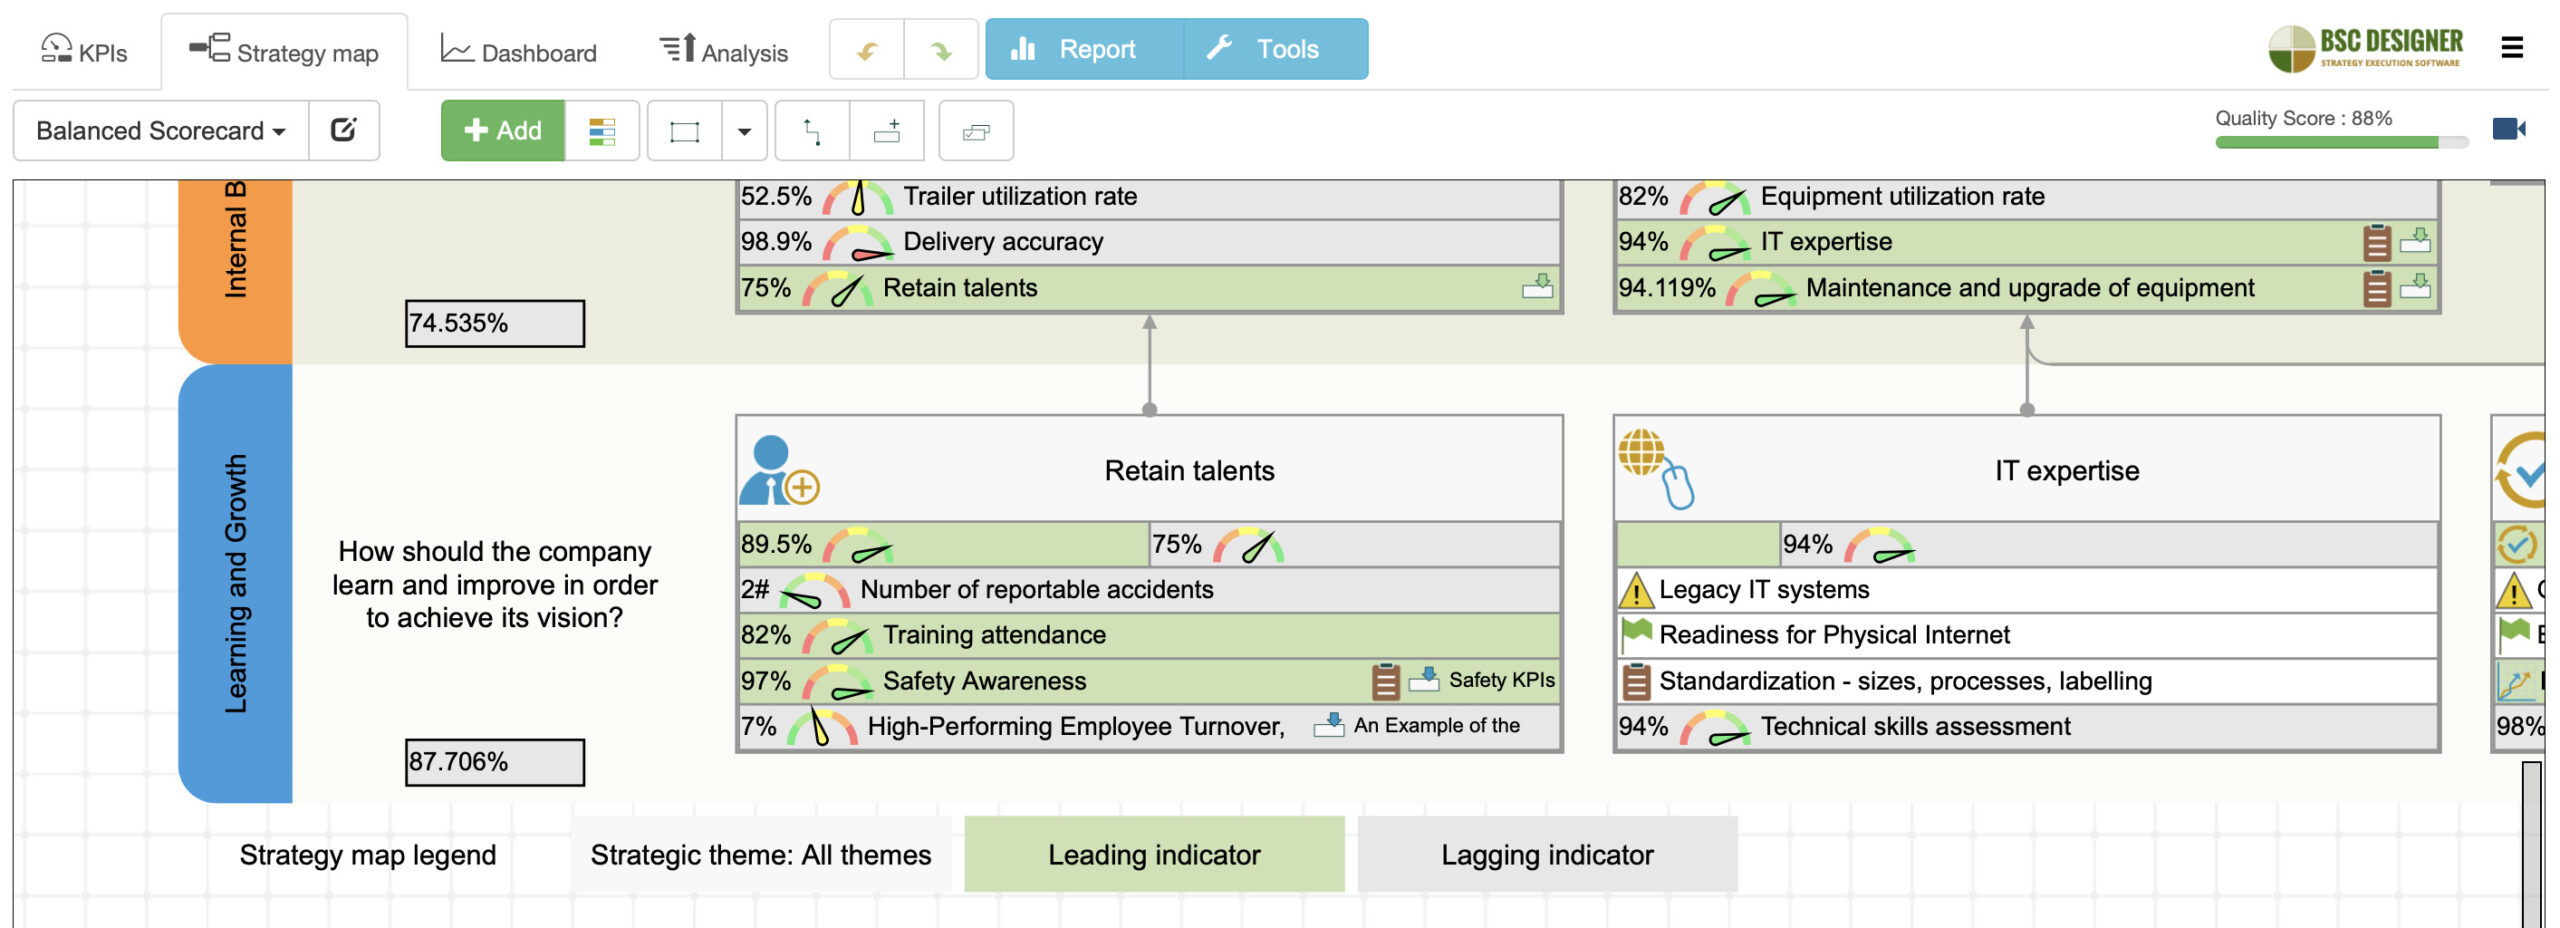
The strategy map is divided into the four perspectives (more perspectives can be added if needed):
- The “Learning and growth” and the “Internal” perspective are the “drivers” of the strategy. We formulated there change goals and initiatives to improve logistics.
- The “Customer” and the “Finance” perspective are the “outcomes” of the strategy. We formulated there the perception of logistics by internal and external stakeholders, as well as expected financial outcomes.
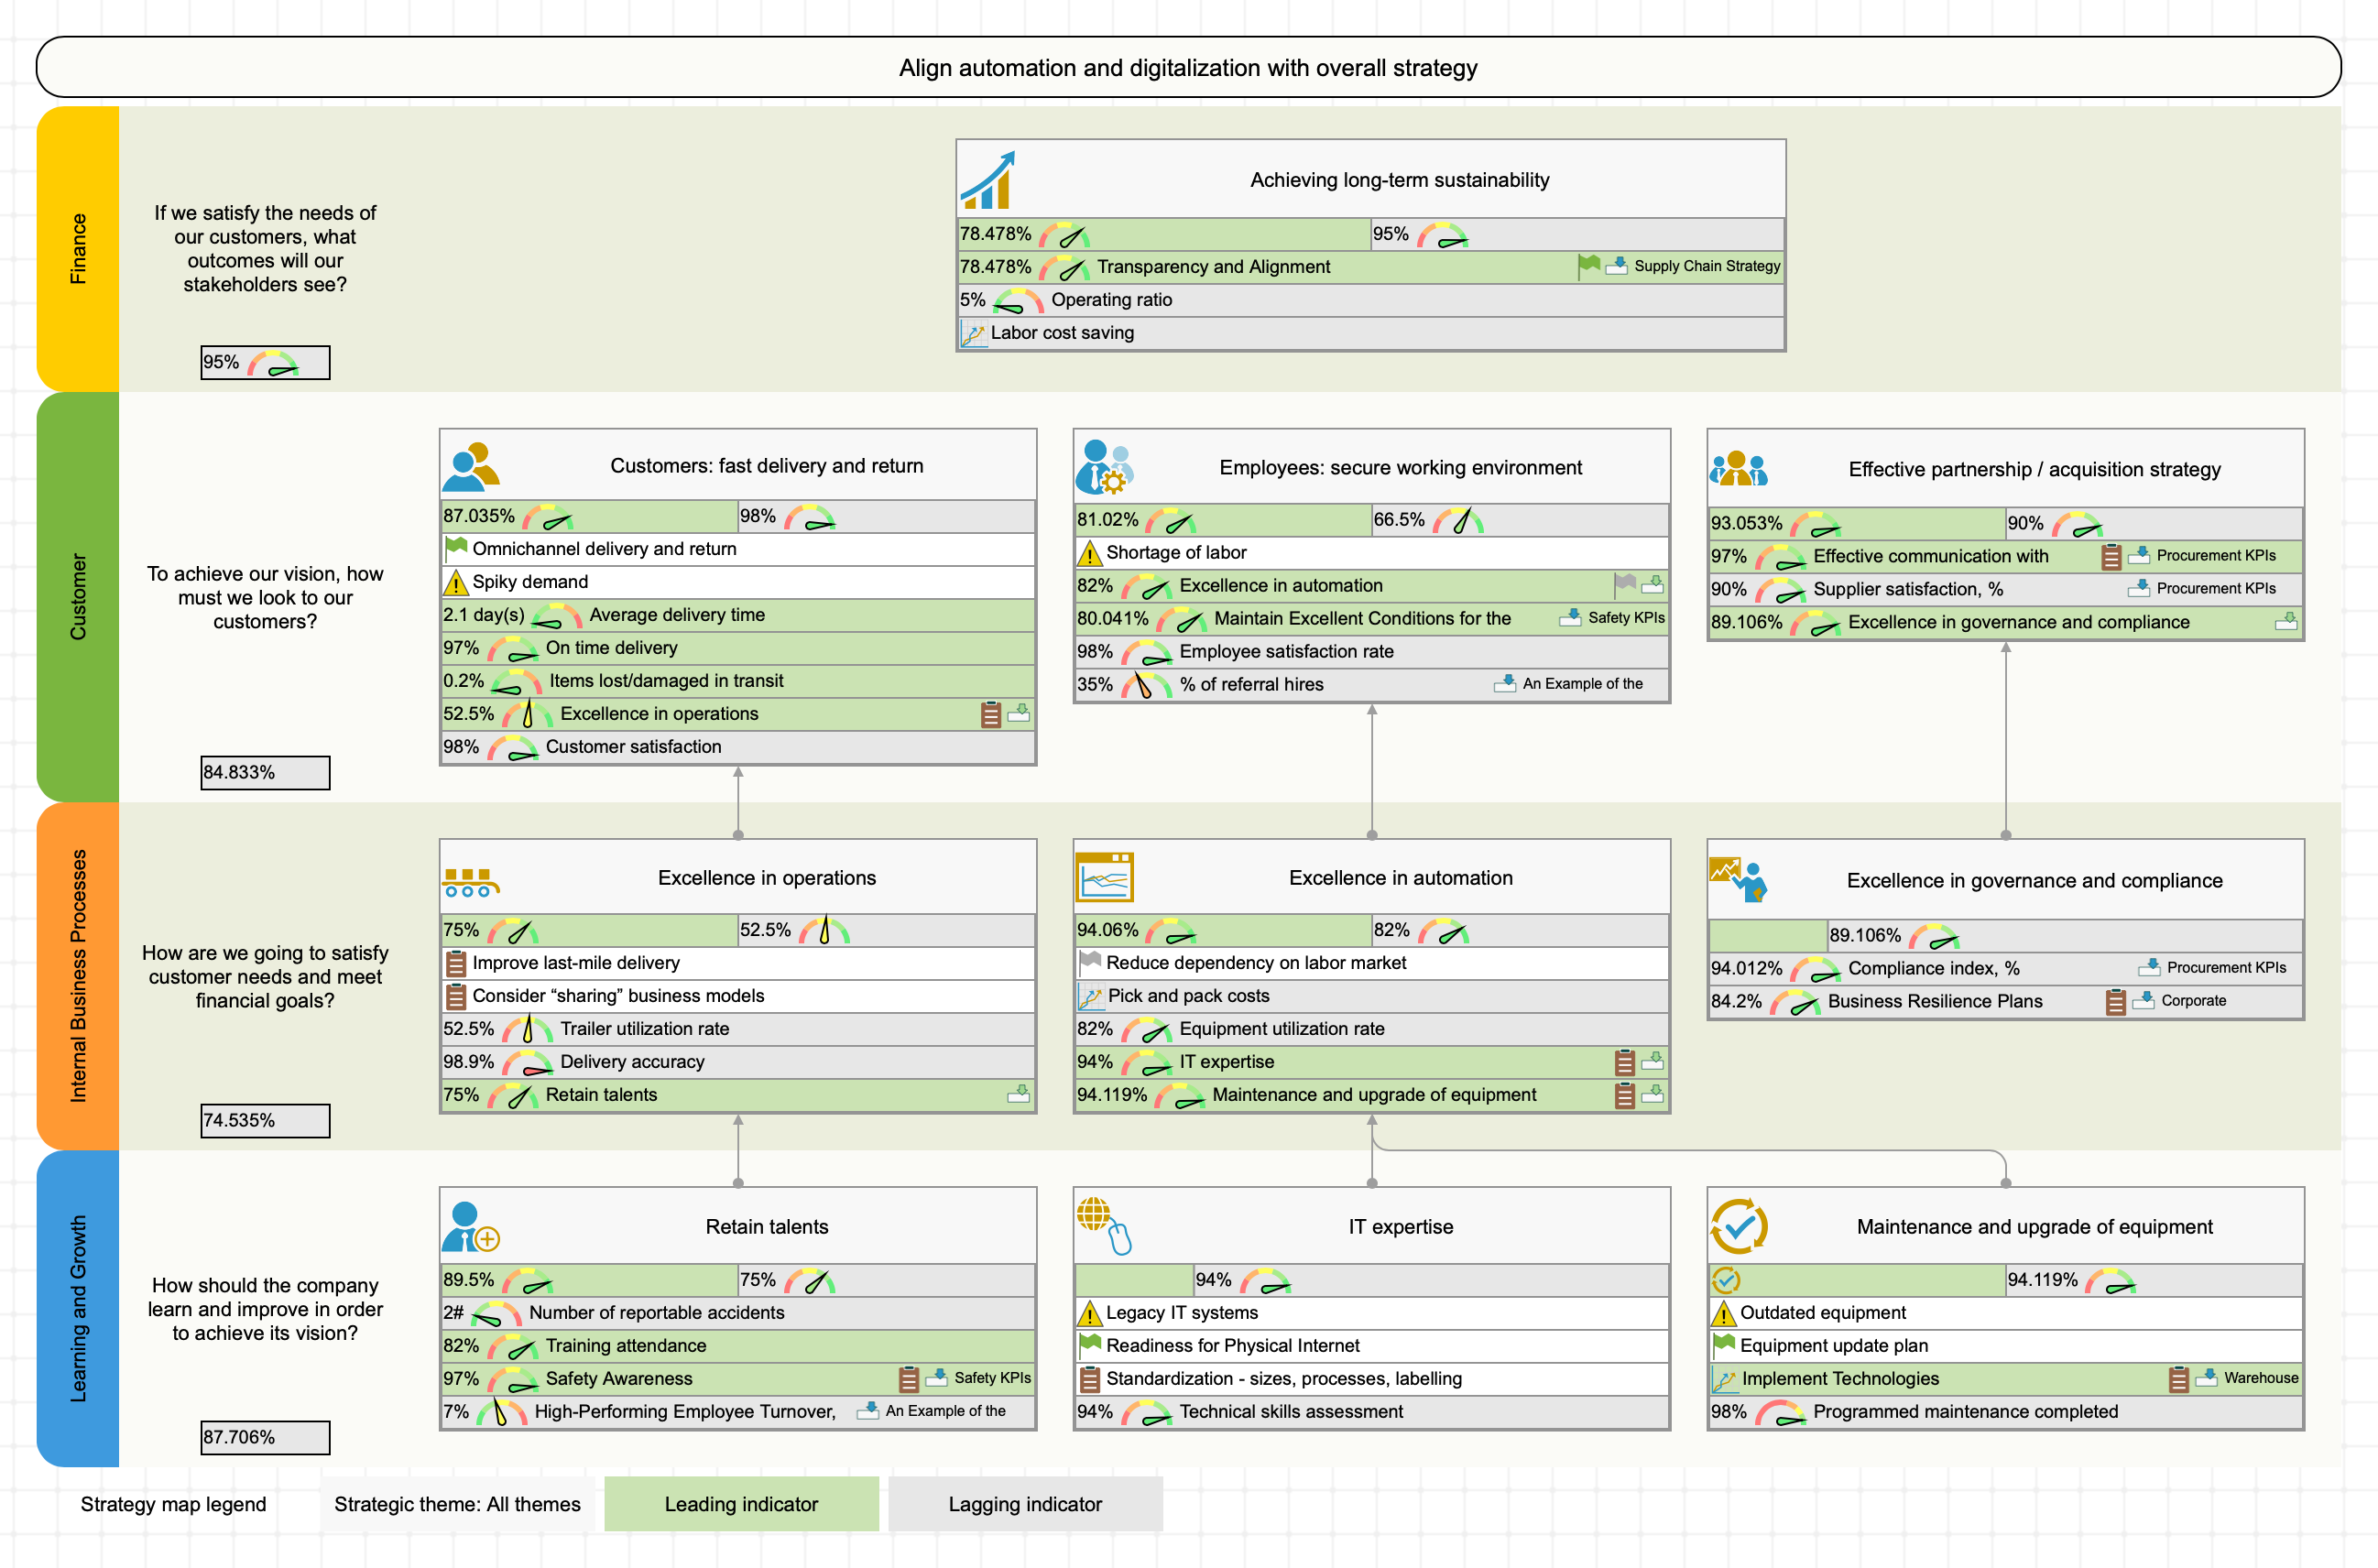
Goals on the Map
The rectangles within the perspectives on the map represent goals of logistics strategy.
- Right below the name of the goal is a green and gray section that shows, respectively, the leading and lagging performance of the goal calculated using leading and lagging indicators aligned with the goal.
- The goals can be connected visually and by data. If connected by data, the output of one goal will contribute to another goal as an input (leading indicator).
Leading and Lagging Indicators
The green and gray lines below the goals are the leading and lagging indicators.
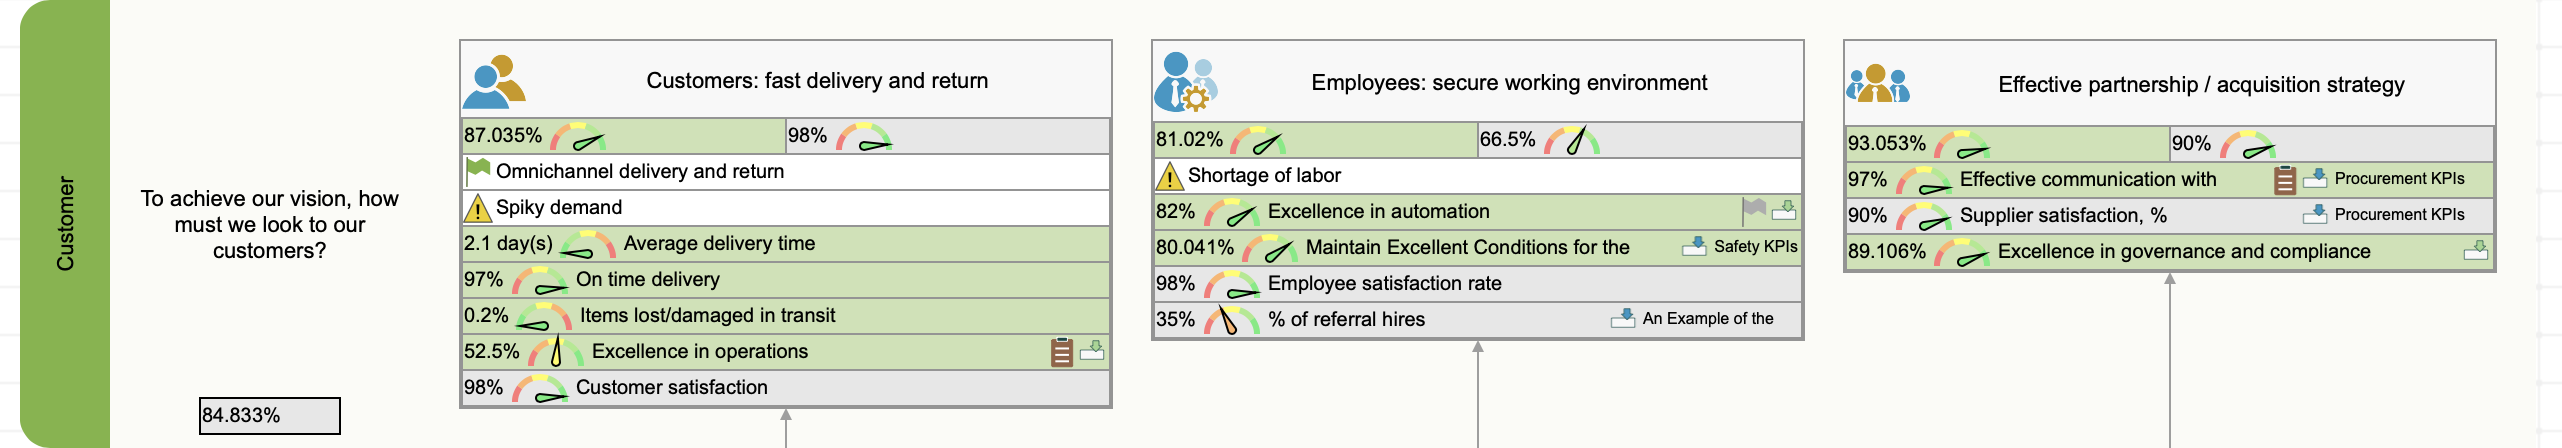
For example, for the “Customers: fast delivery and return” goal we have:
- A number of leading indicators that quantify the success factors of effective delivery, and
- The “Customer satisfaction” indicator that quantifies the level of customer satisfaction achieved.
In some cases, instead of formulating a leading indicator, we formulate a success factor. See, for example, “Omnichannel delivery and return” for the same goal.
Mapping Risks
Proper risk definition gives the logistics team the necessary context for execution. In the template, there are a number of goals with identified risks.
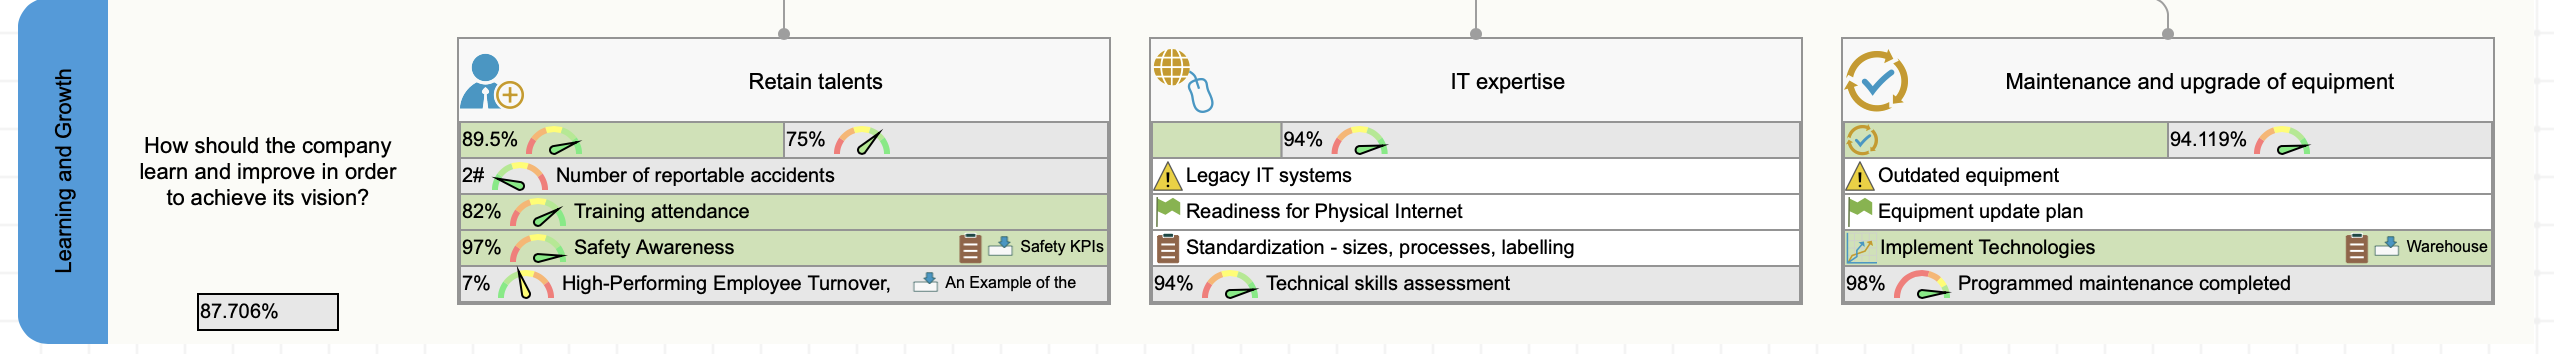
For example:
- “Legacy IT systems” risk identified for the “IT expertise” goal, or
- “Spiky demand” risk identified in the context of “Customers: fast delivery and return” goal.
We can develop the risks further:
- Align the performance indicators with risk,
- Add a risk mitigation plan,
- Specify dependency between risks and initiatives,
- List risk and their mitigation status on the dashboard.
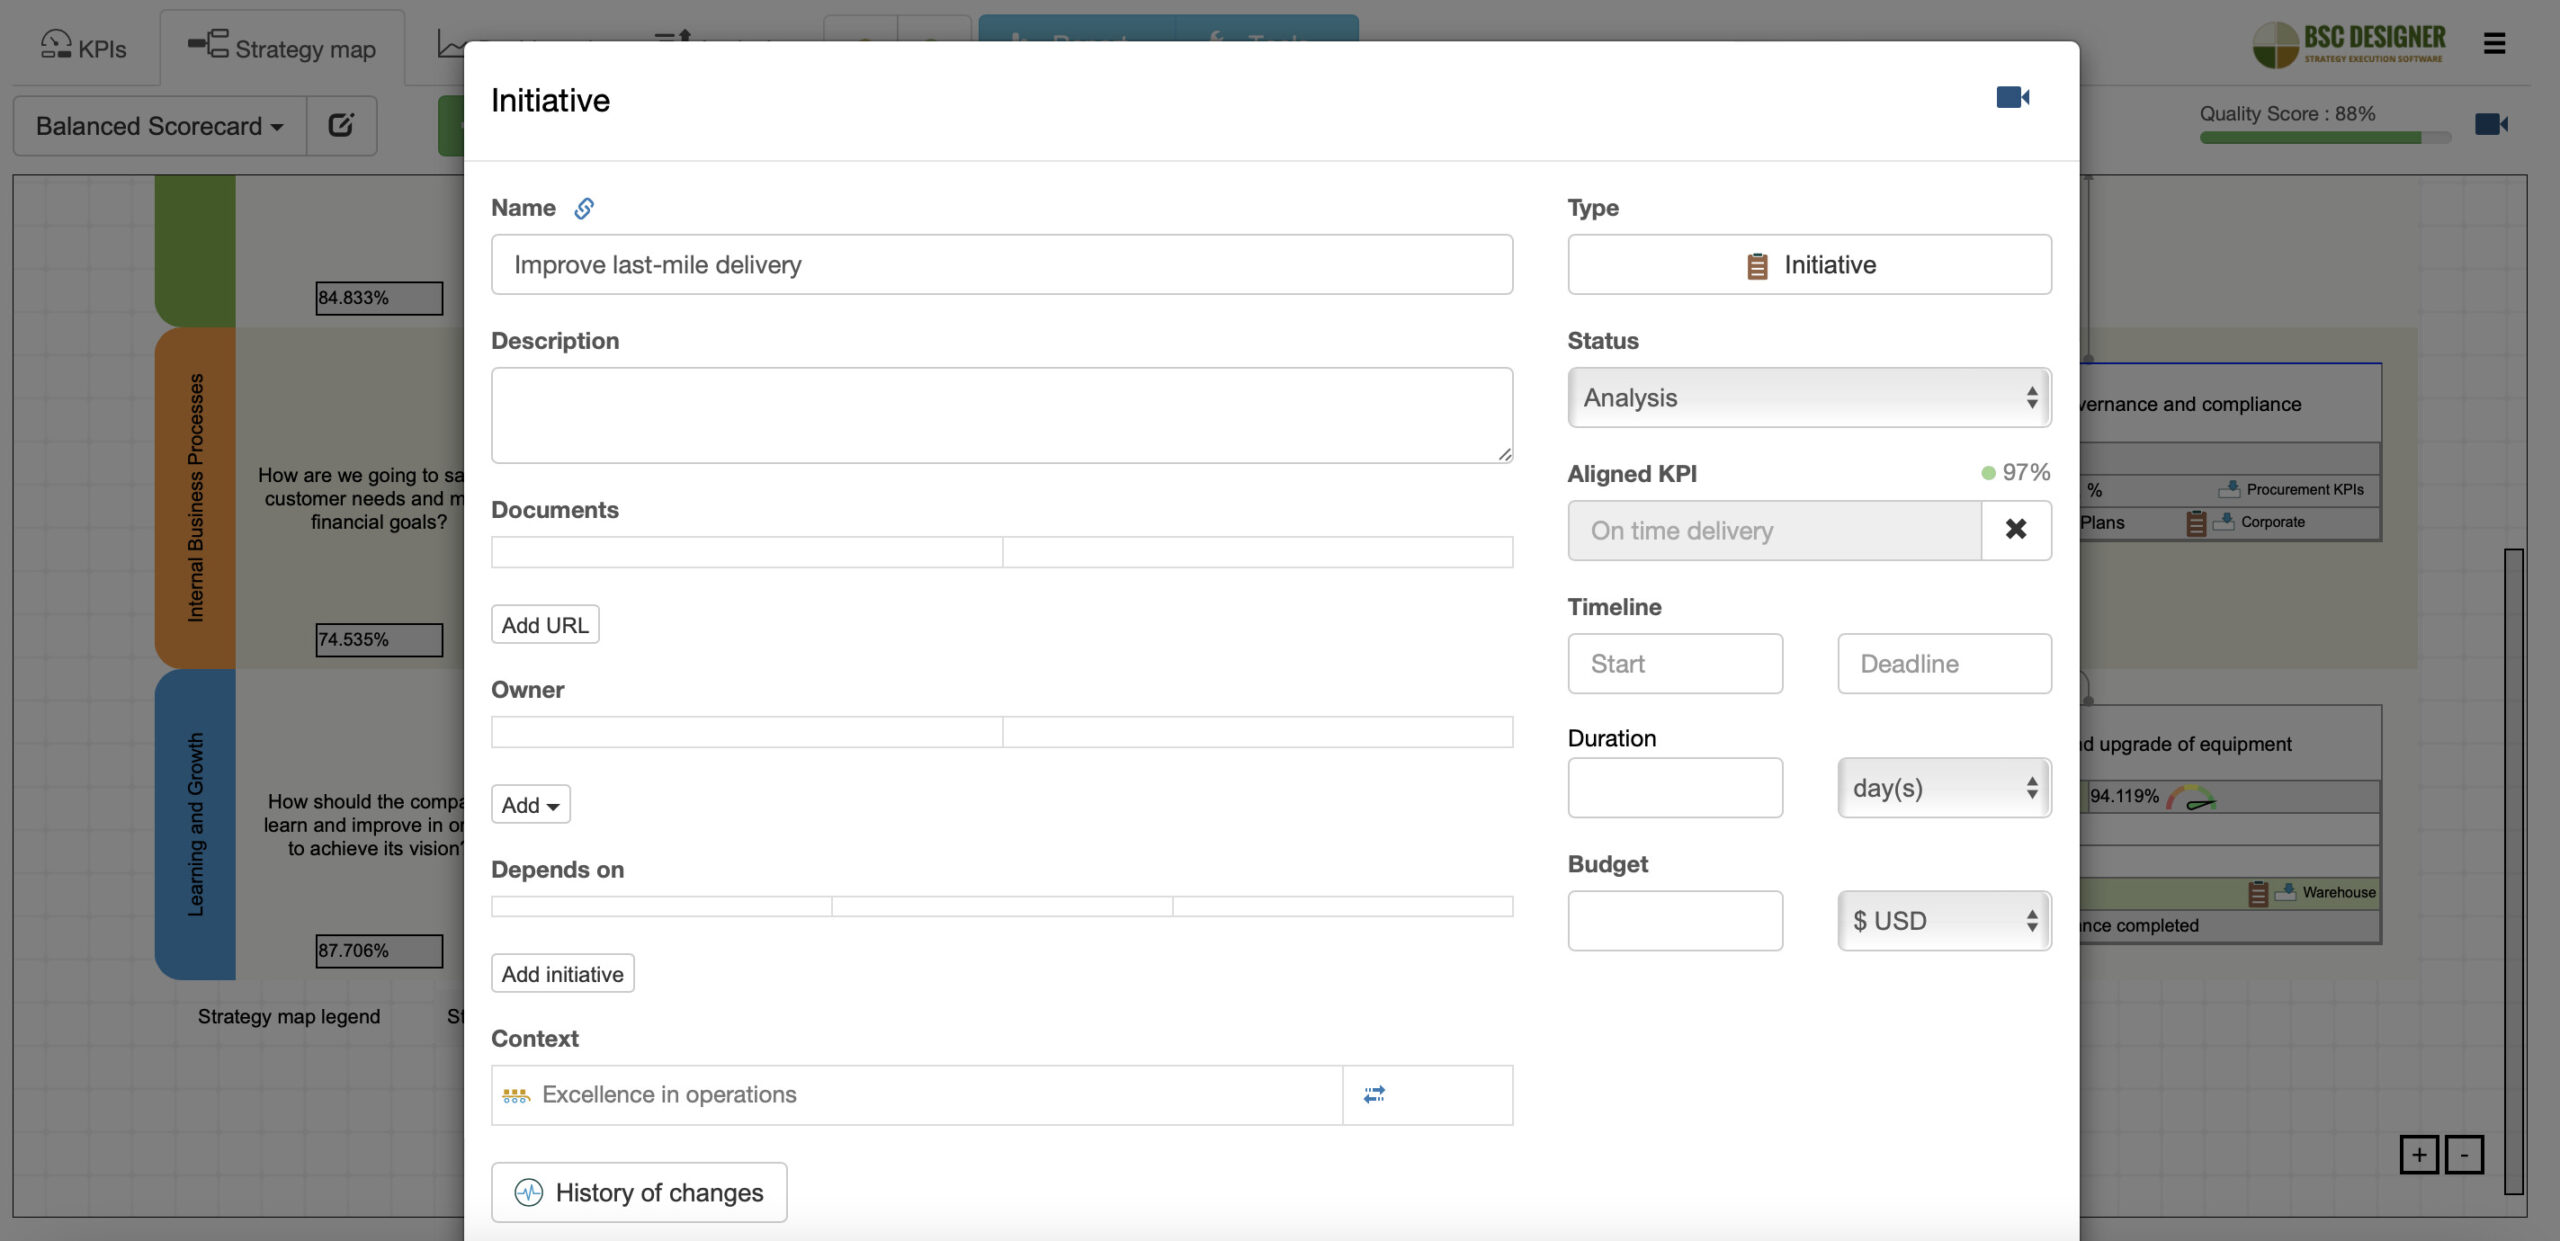
Action Plans and Initiatives
For some of the goals, the high-level action plans were defined.
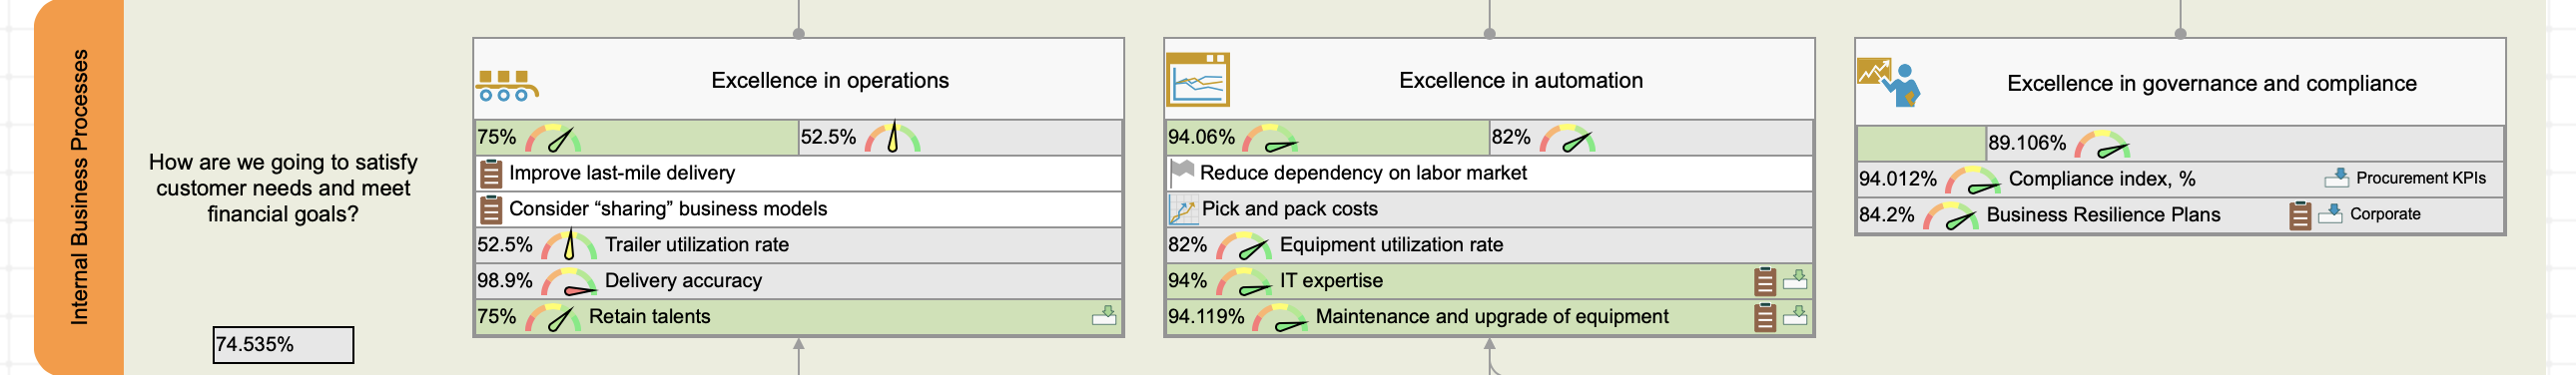
- See, for example, the “Improve last-mile delivery” and “Consider “sharing” business models” initiatives aligned with “Excellence in operations” goals.
These initiatives require additional analysis and can be further developed into comprehensive action plans with required project management attributes.
KPIs for Logistics
The template includes generic KPIs for logistics. Below, we discuss some best practices for using these KPIs. For more ideas, check out the guide for KPIs.
Basic Setup
Each indicator has some basic properties:
- Indicator’s name, description, and measurement units.
- Indicator is configured to be updated according to a certain period (see the “Update interval” in Values Editor).
- A sample data for the indicators in the template was entered manually via the Data tab and Values Editor; in real use cases, there are a number of methods to automate data entry.
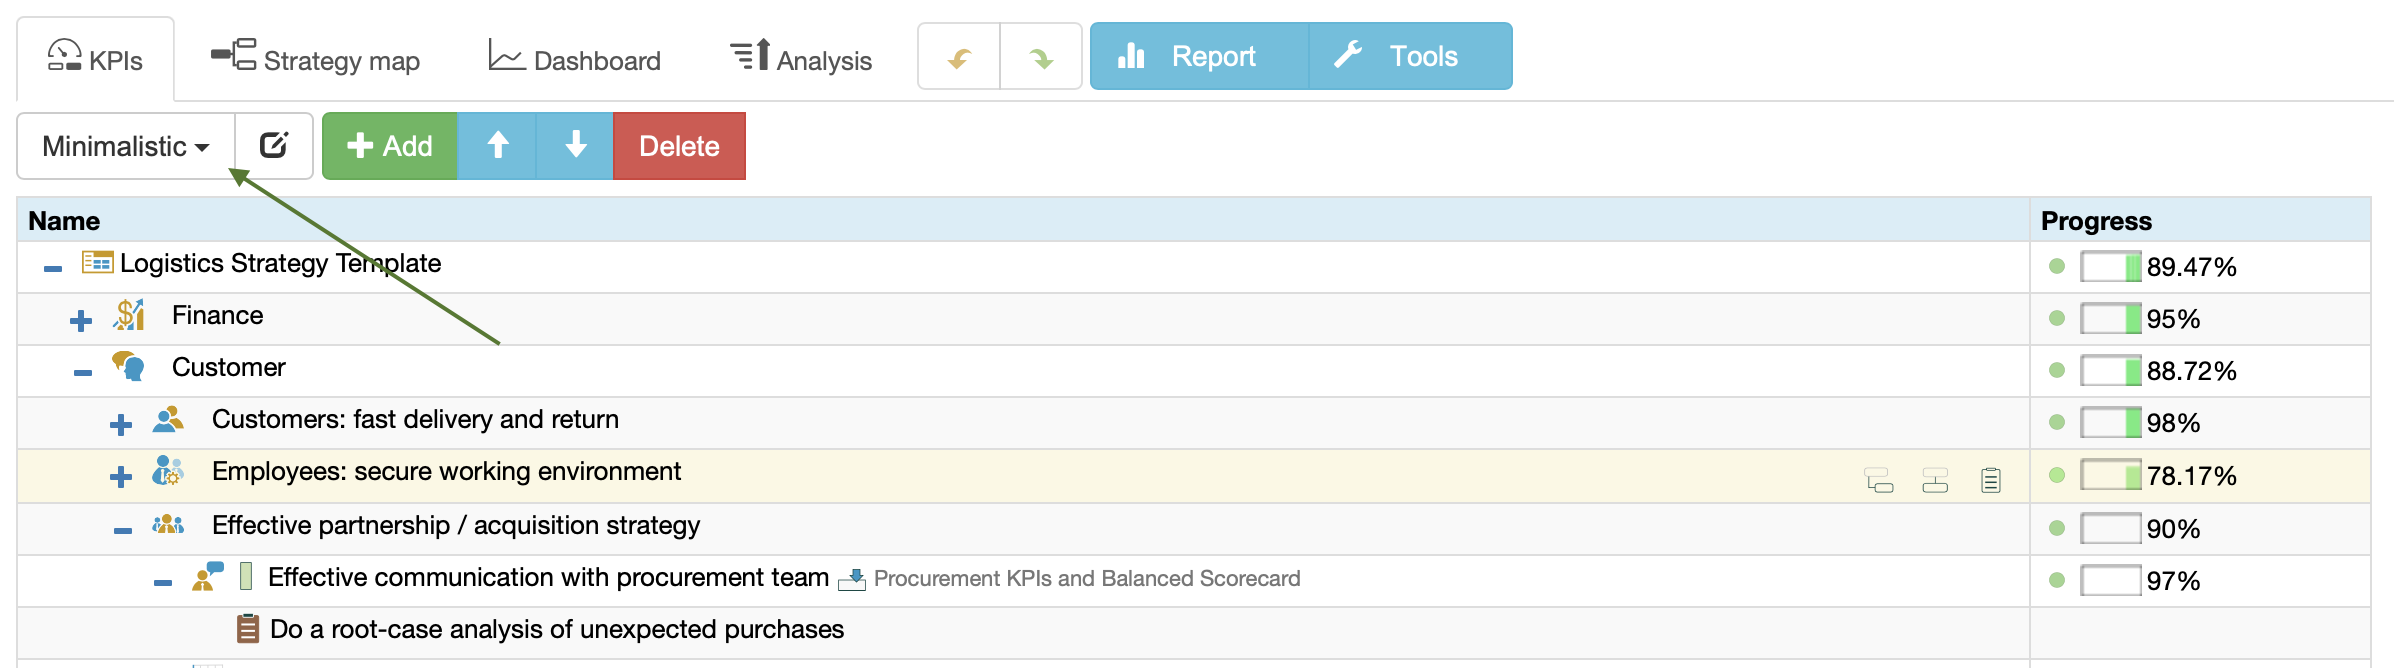
The view of the KPIs tab can be adjusted by selecting a different view profile. For example:
- Minimalistic for presentation purposes
- Impact for analysis of absolute and relevant weights
- Initiatives to focus on action plans
Formulas for KPIs
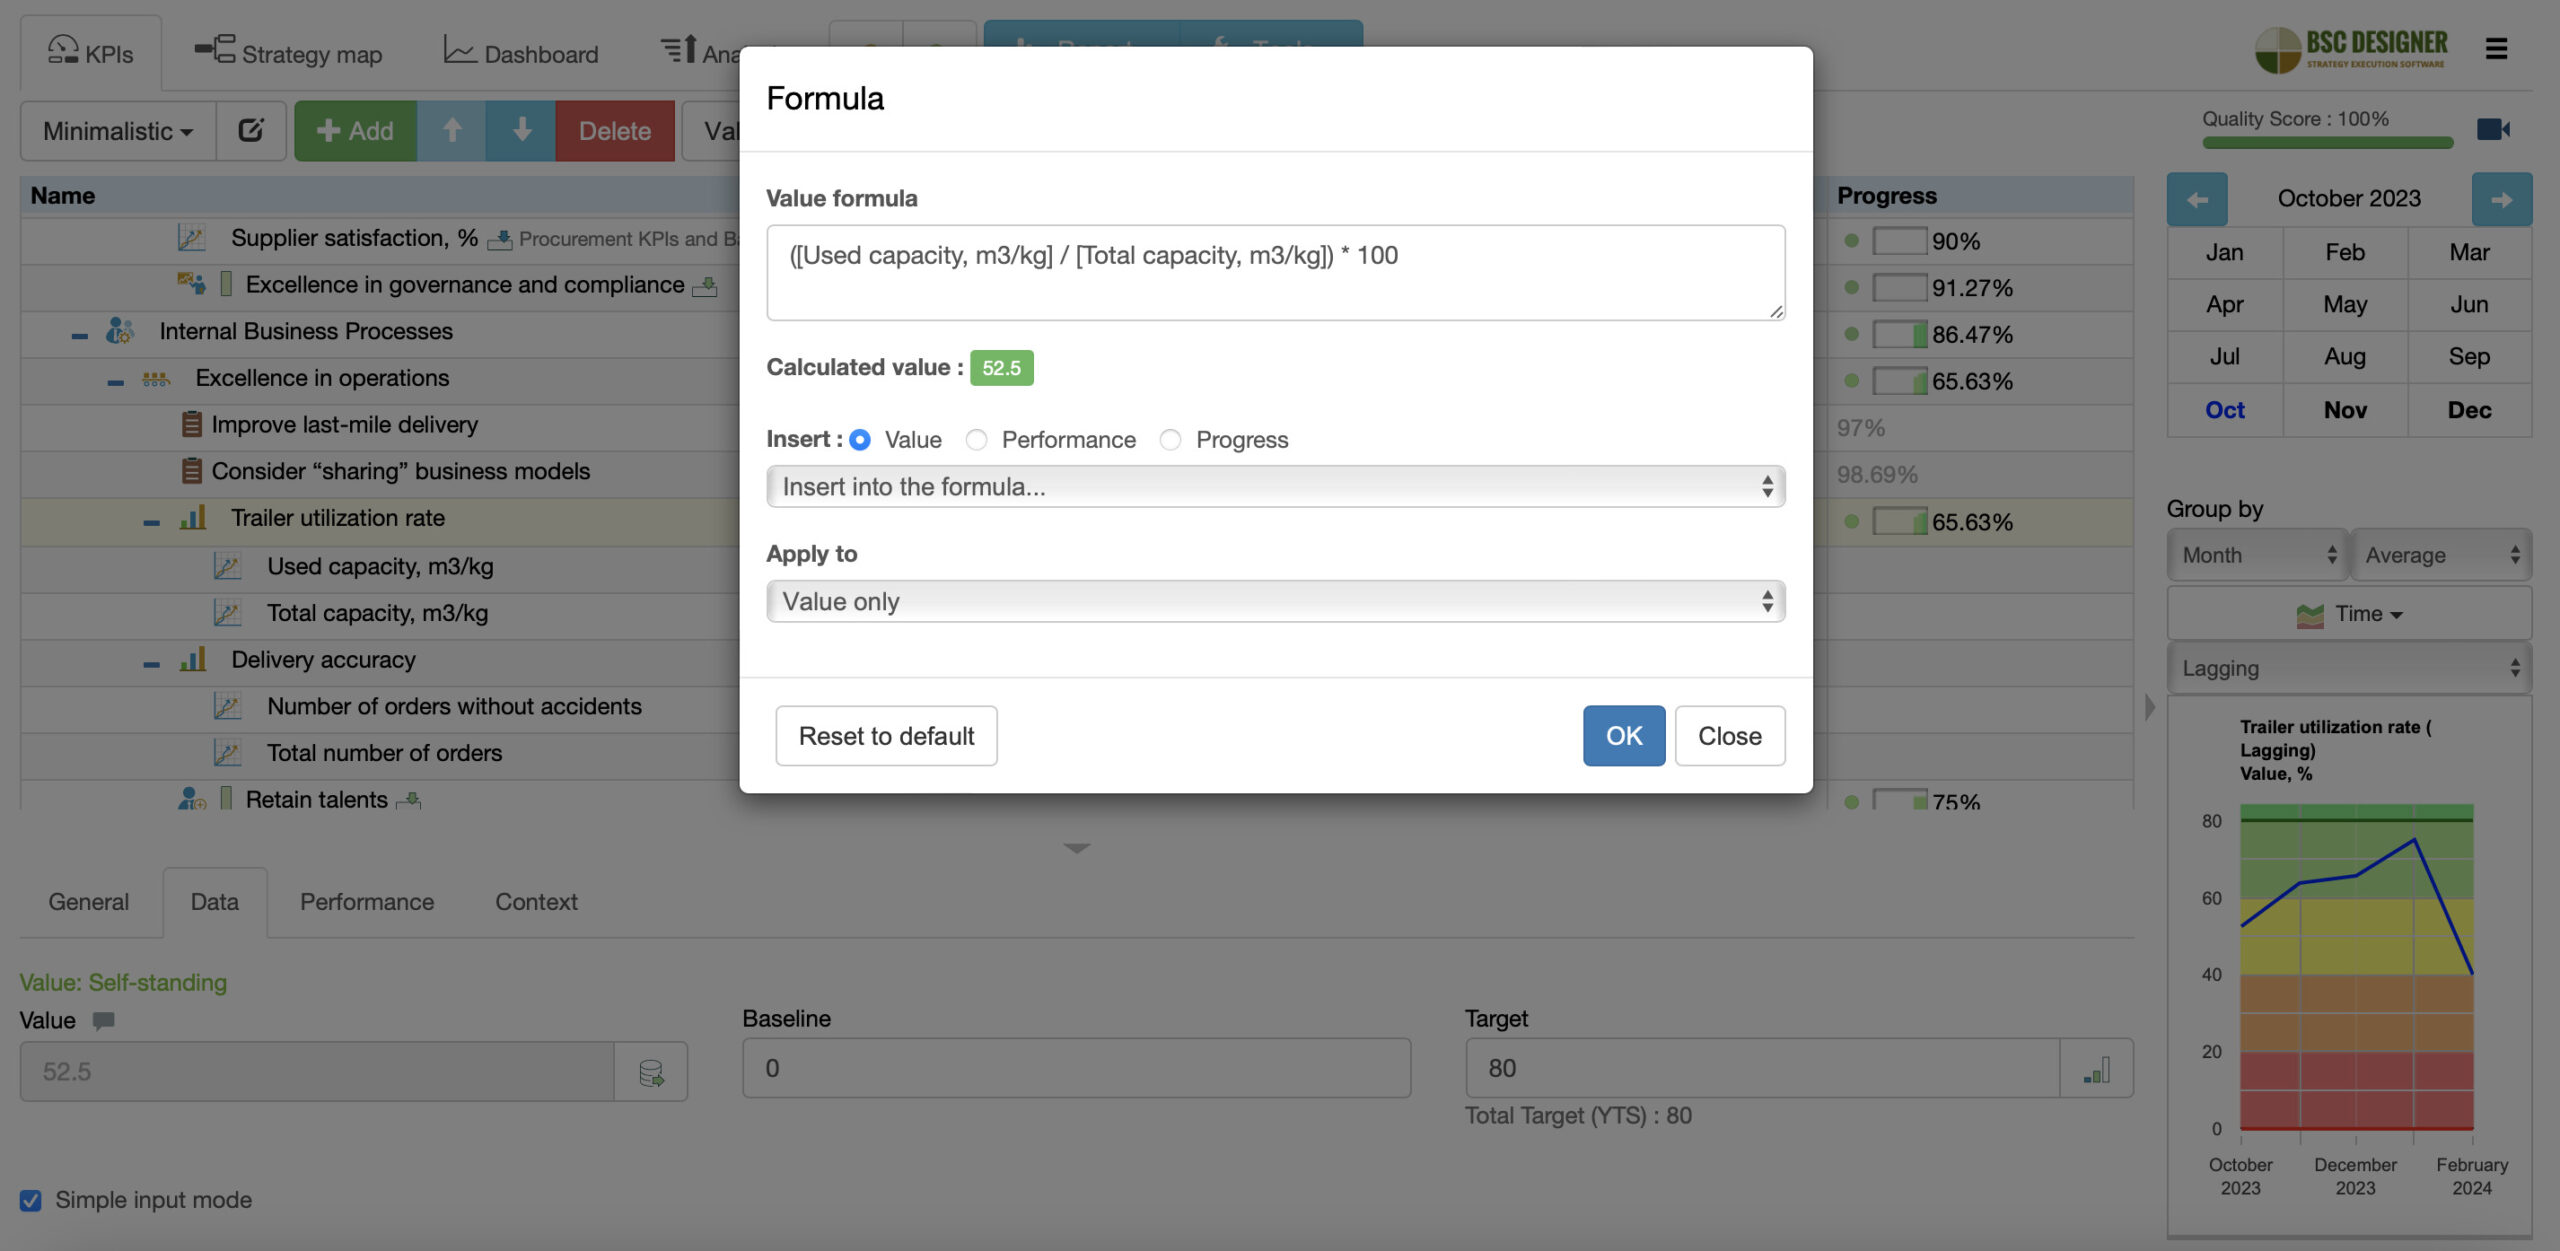
Some indicators are calculated using the data of other indicators:
- The indicator “Trailer utilization rate” is calculated using the formula ([Used capacity, m3/kg] / [Total capacity, m3/kg]) * 100.
- The results of calculations are applied to the current value of the indicator.
- The target for this indicator can be adjusted manually.
- The indicators used in calculation are marked as “Raw data indicators,” meaning that they are not contributing to the performance of the scorecard directly.
Performance Scale – Normalization
The scale min/max (baseline/target) is used to normalize the indicator by calculating its performance (progress) and making indicators comparable.
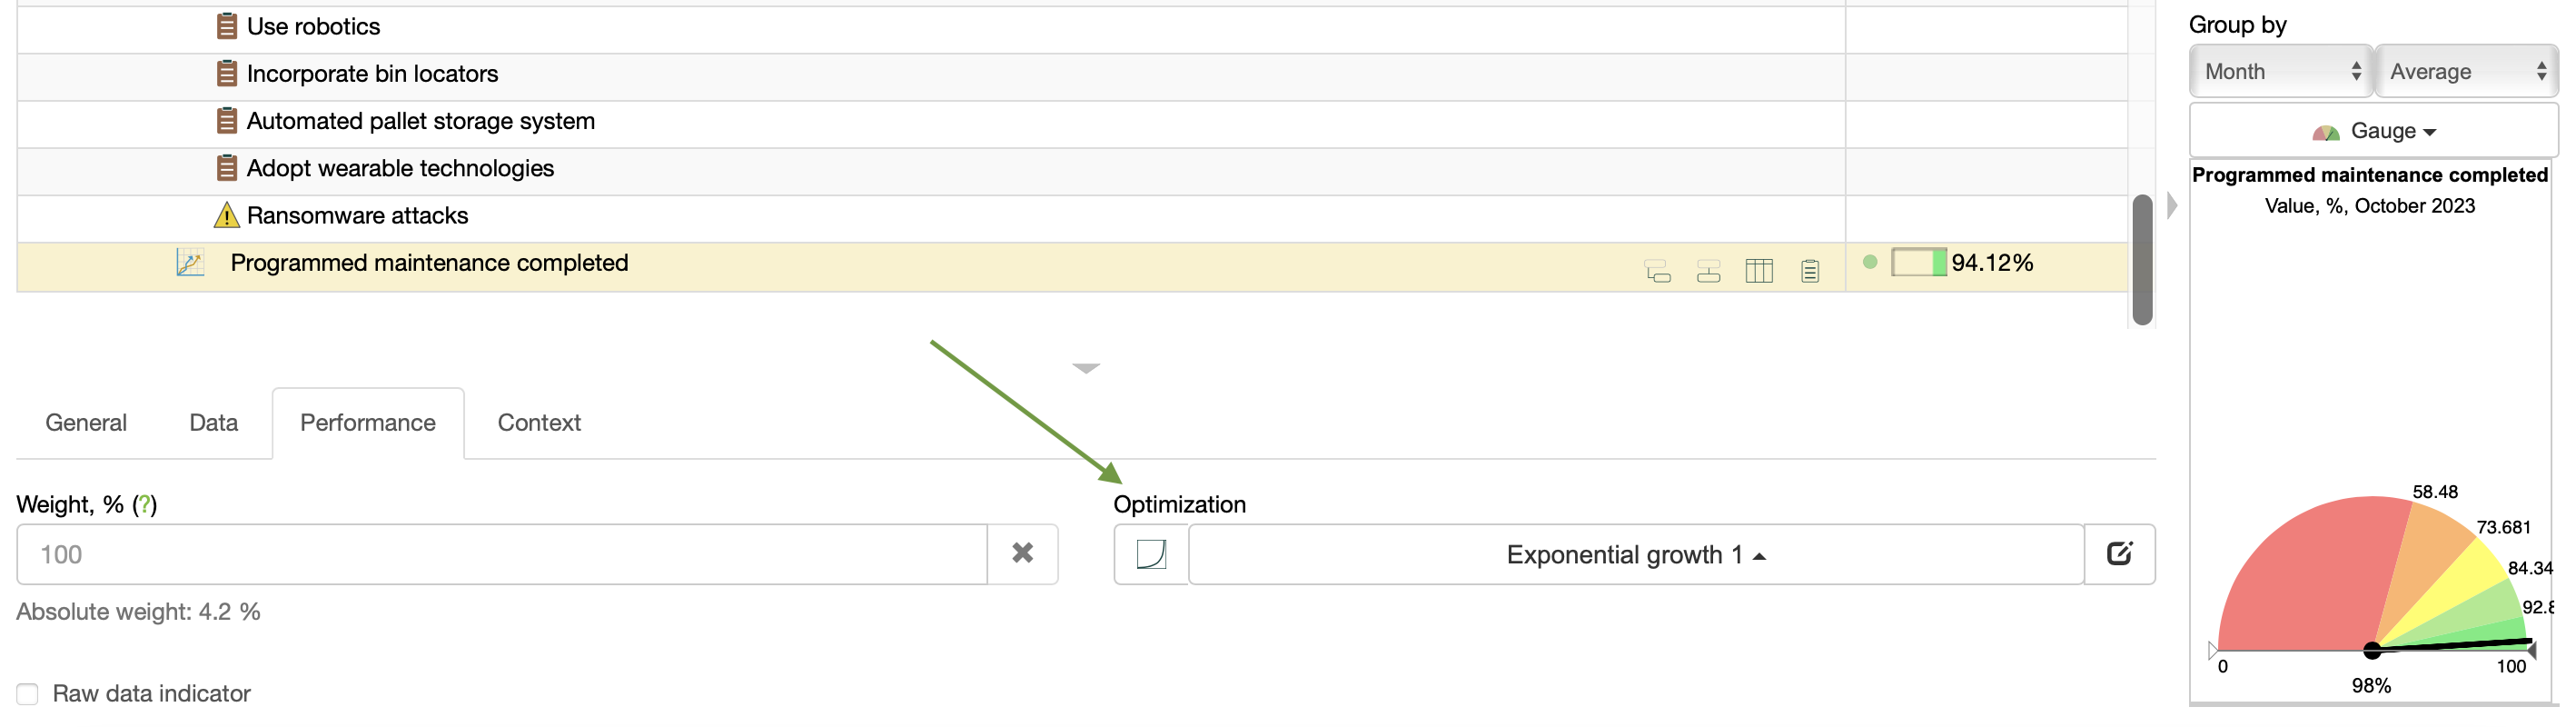
- Most of the indicators, like, for example, “Delivery accuracy”, use linear maximization as a performance function. In this case, with the increase of the current value, the performance increases.
- Some indicators, like “Items lost/damaged in transit” use the linear minimization as a performance function, in this case, with the decrease of the current value, the performance increases.
- Indicators like “Programmed maintenance completed” use non-linear performance function. In this particular case, it tells the strategy team that to be in the green zone, most of the equipment should be maintained on time.
- For specific cases, a user-defined performance function can be defined for an indicator.
Weights of Indicators
The weight of an indicator defines its impact on the performance of the parent goal.
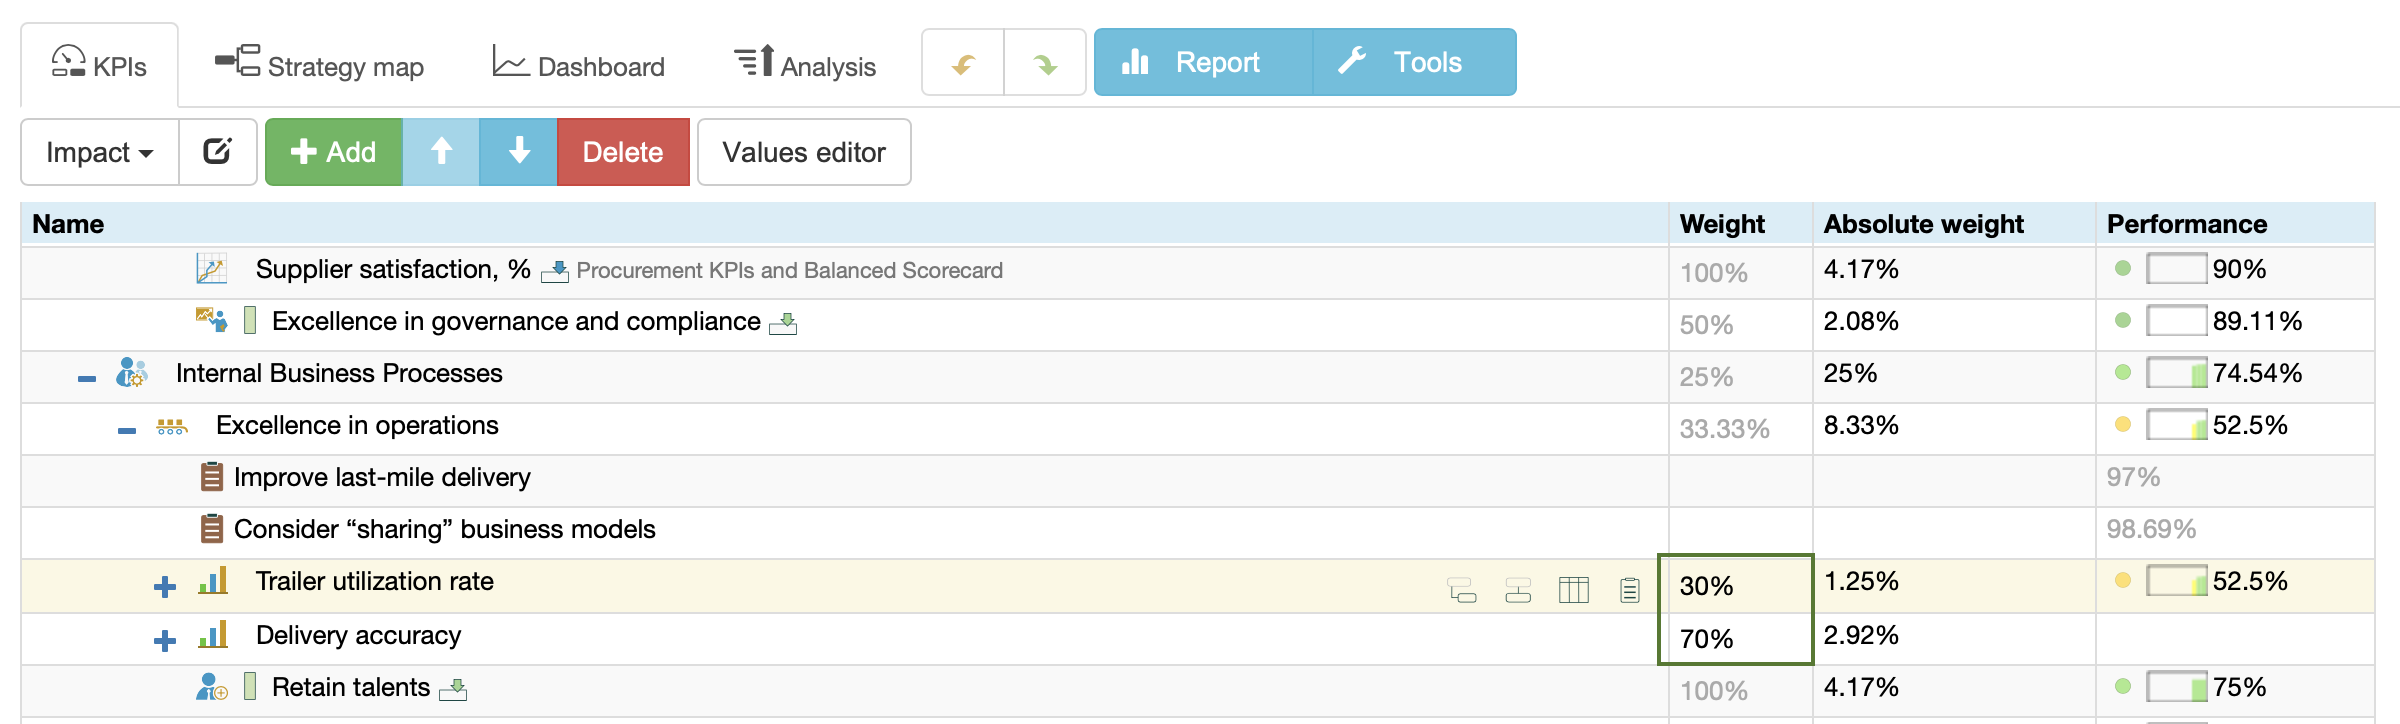
- For example, two indicators are aligned with the “Excellence in operations” goal.
- Indicator “Delivery accuracy” has a weight of 70%, while the indicator “Trailer utilization rate” has a weight of 30%.
- The calculation of the performance of “Excellence in operations” is configured as “Weighted average”, respectively. the performance of the indicators inside will be used according to their weights.
Dashboards for Logistics
The template includes an example of the dashboard for logistics.
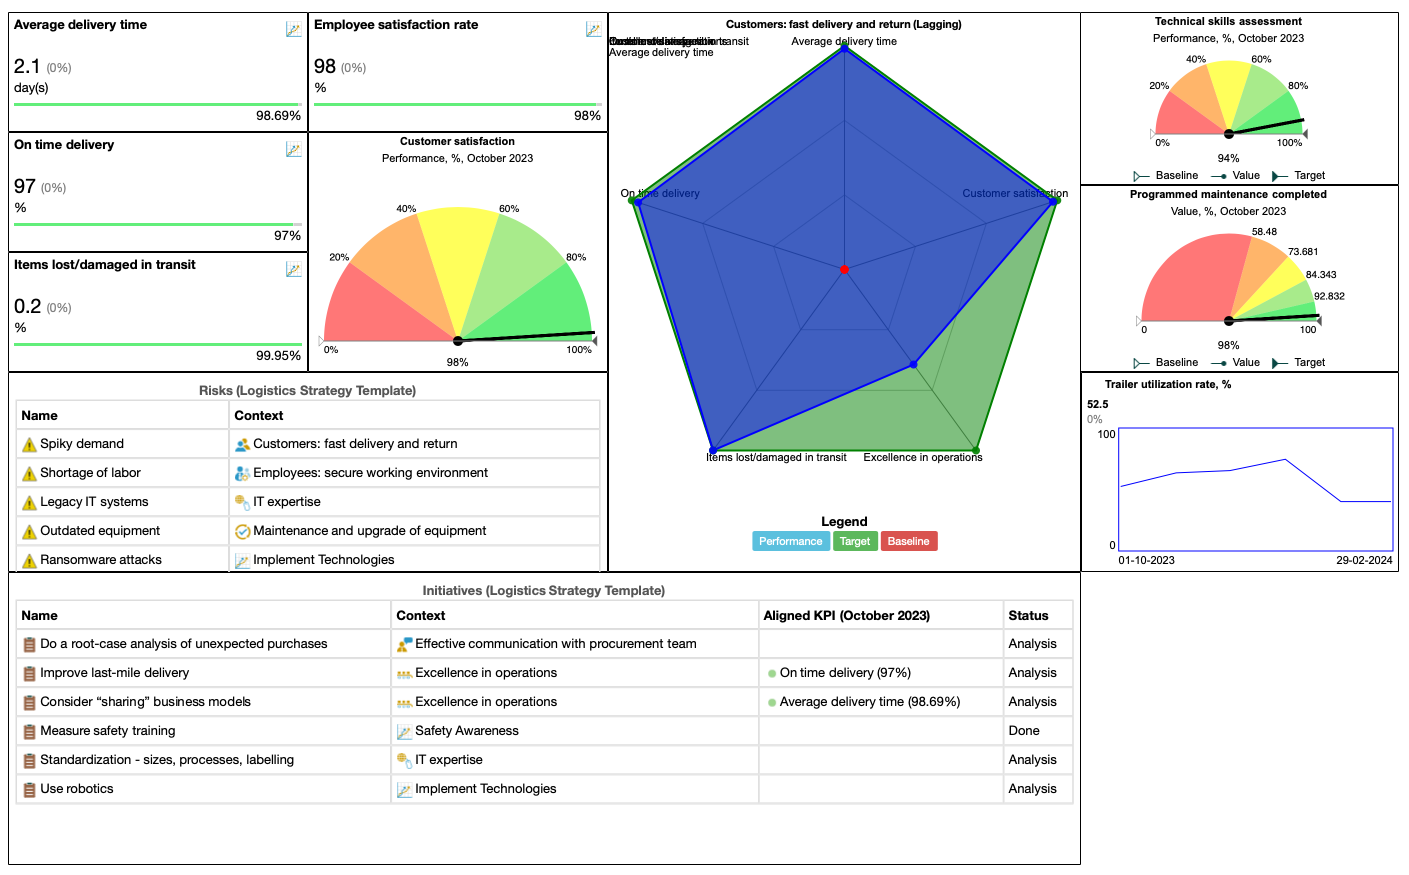
Its key components include:
- KPI diagrams for some indicators to show their current status and dynamic.
- Gauge diagrams with baseline, target, and current value.
- Radar diagram for “Customers: fast delivery and return” to visualize the performance of the indicators that contribute to customer satisfaction.
- Overview diagram for “Trailer utilization rate” to show the evolution of the KPI’s state over time.
- The lists of initiative and risks associated with this strategy scorecard.
This dashboard can be customized according to the specific logistics company.
Summary: Use Cases for Logistics Strategy Scorecard
Here are the practical use cases of the strategy scorecard for logistics:
- Tracking performance with KPIs and dashboards. The software handles the calculation part and keeps the stakeholders informed by sending notifications.
- Sharing the logistics scorecard or its parts with suppliers and contractors to achieve better compliance and transparency.
- Presenting logistics strategy to internal and external stakeholders using the strategy map and the dashboards as the main communication tools.
- Creating a single source of trust about strategy by having all the scorecards related to the supply chain in one place.
Achieving transparency required by sustainability reporting and other stakeholders.
What's next?- Follow our
 Strategy Implementation System to align stakeholders, strategic ambitions, and business frameworks into a comprehensive strategy.
 - Automate strategic planning with BSC Designer by organizing goals, initiatives, risks, and KPIs into scorecards.
More About Strategic Planning


- Shifting patterns. The future of the logistics industry, PWC, 2016 ↩
- Automation in logistics: Big opportunity, bigger uncertainty, 2019, McKinsey McKinsey ↩
- Adapting Strategic Planning to European Sustainability Reporting (ESRS and CSRD), BSC Designer, 2023 ↩
![]() CEO | Author | Speaker
CEO | Author | Speaker
BSC Designer is strategy execution software that enhances strategy formulation and execution through tangible KPIs. Our proprietary strategy implementation system reflects our practical experience in the strategy domain.