Corporate governance is a set of rules and practices employed to control an organization and build a sustainable business. In this article, we’ll discuss the ways to quantify and measure the effectiveness of a typical corporate governance system with some performance indicators.
Corporate Governance Structure
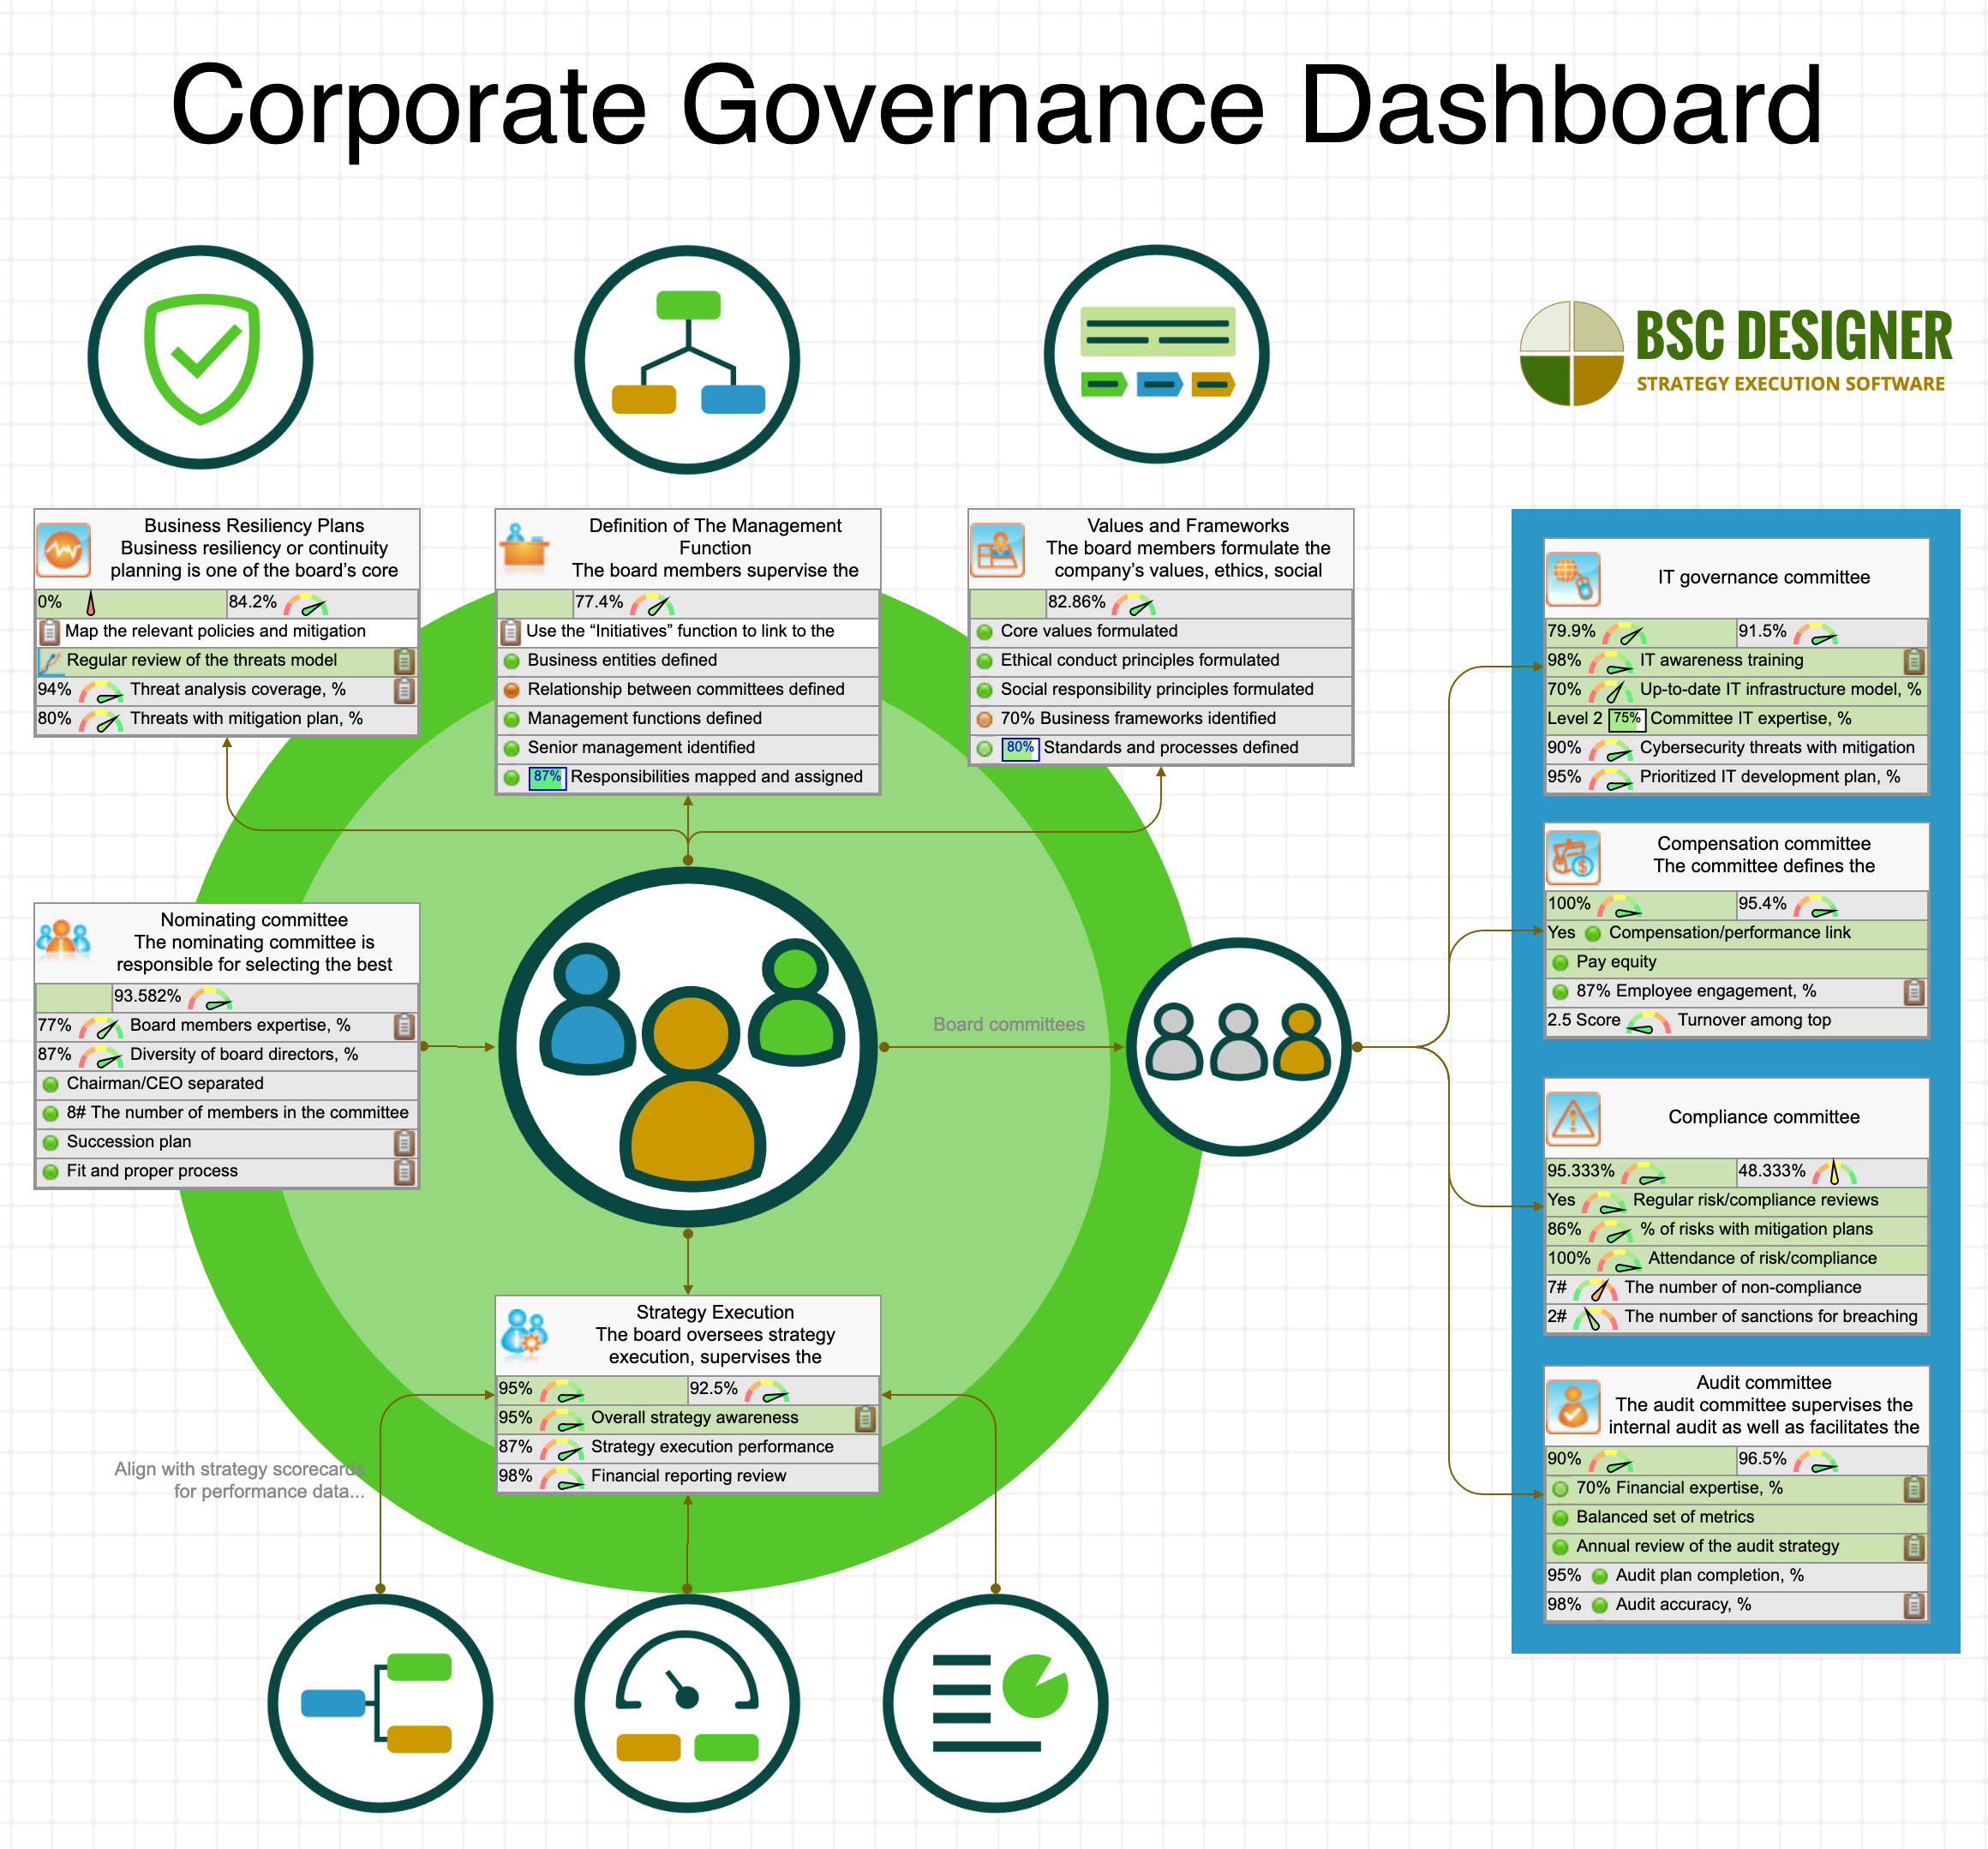
A typical corporate governance structure1 is formed by the board of directors and board committees.
The board has ultimate responsibility for the management of the company in the best interest of shareholders and other stakeholders. The decisions of the board are executed by the company’s CEO and senior management.
To ensure better decision making in specific aspects of a company’s management, board committees are created. Typically, these are:
- Nominating committee
- Compensation committee
- Audit committee
- Compliance committee
- IT governance committee
Let’s continue with the discussion of the board committees and the possible ways to quantify their performance.
Other topics discussed below include:
- KPIs for Overseeing Senior Management
- KPIs for Business Resiliency Plans
- Best Practices for Measurement in GRC domain
- GRC Software: do we need a separate tool for GRC?
- Balanced Scorecard for Corporate Governance
KPIs for Nominating Committee
The nominating committee is responsible for selecting the best candidates for the board of directors as well as senior management.
The metrics applicable in this case are:
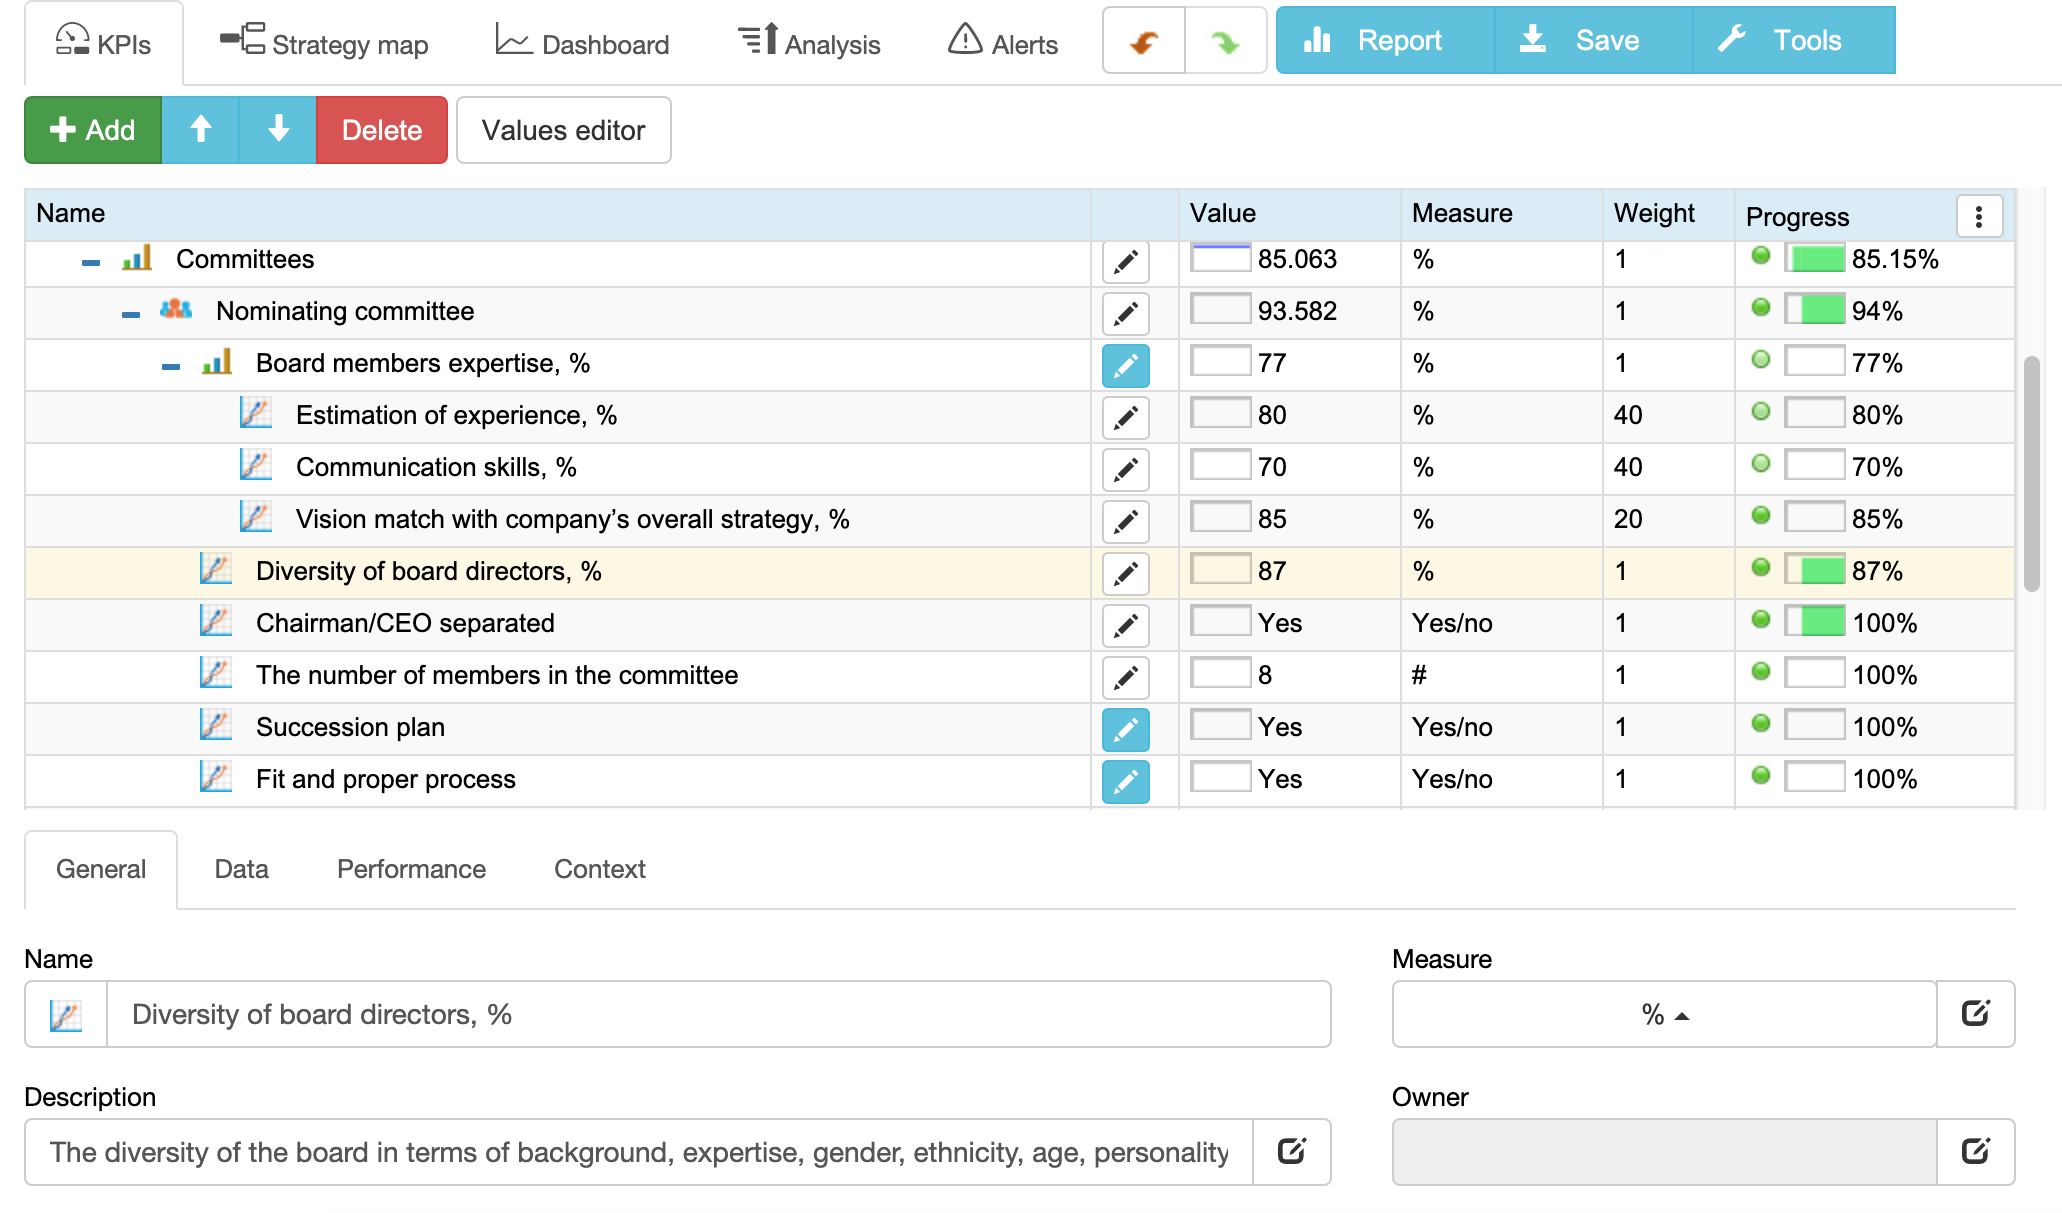
- Board members expertise, %. An estimation of the relevant skills and characteristics needed to address emerging industry trends. Below, you can find some best practices about quantifying expertise.
- Diversity of board directors, %. The diversity2 of the board in terms of background, expertise, gender, ethnicity, age, personality type3, etc. Learn more about articulating diversity and inclusion strategy.
- Chairman/CEO separated [binary]. The separation of the board chairman and CEO positions. This metric is a binary one. Learn below about the best way to manage this metric.
- The number of members in the board committee. “The number of…” looks like a basic metric with no real business application. Below, we discuss some reasons how metrics like this can be helpful.
- Succession plan [binary]. The binary metric that shows the existence of the succession plan for the CEO and senior management for the cases of regular and emergency succession.
- Fit and proper process. Senior management evaluation according to “fit and proper” criteria.
KPIs for Compensation Committee
The committee defines the compensation policy for the board members, CEO, and senior management.
In a general case, the performance of the compensation committee is hard to quantify, the main factor that we should look at is:
- Compensation/performance link. The link between compensation and performance results (especially financial performance).
- Pay equity, such as gender pay equity.
- Employee engagement, %. Use HR scorecard to quantify and measure employee engagement.
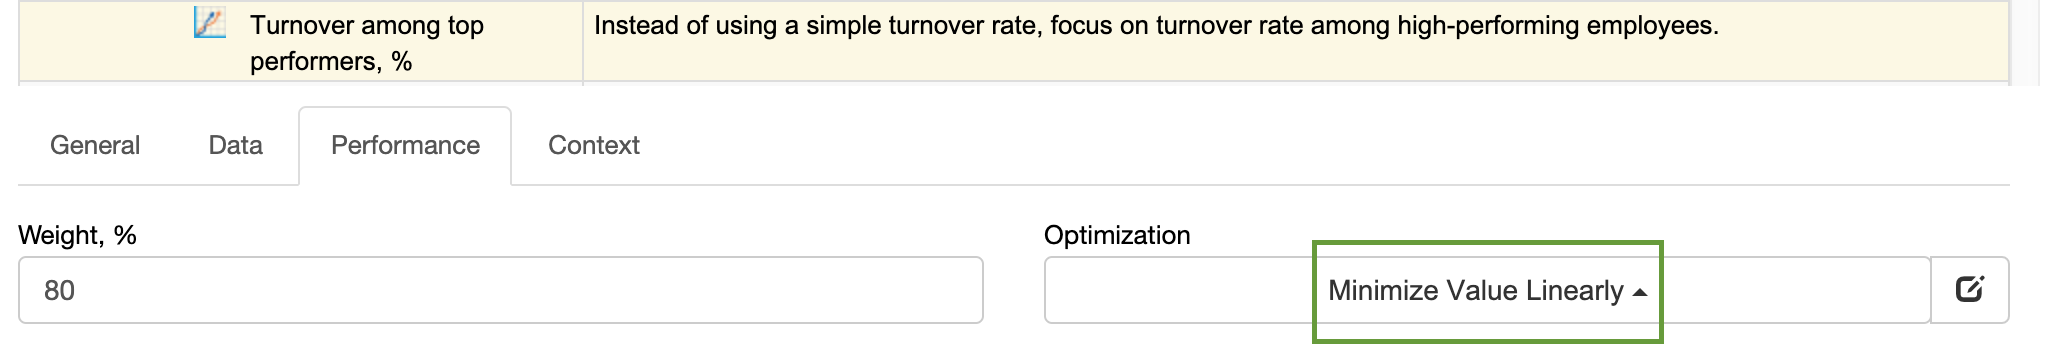
- Turnover among top performers, % Instead of using a simple turnover rate, focus on turnover rate among high-performing employees.
In the “Compensation and Reward KPI Best Practices” article, we have discussed some ideas that the compensation committee can implement.
KPIs for Audit Committee
The audit committee supervises the internal audit as well as facilitates the communication with outside auditors.
The key metrics for the audit committee are:
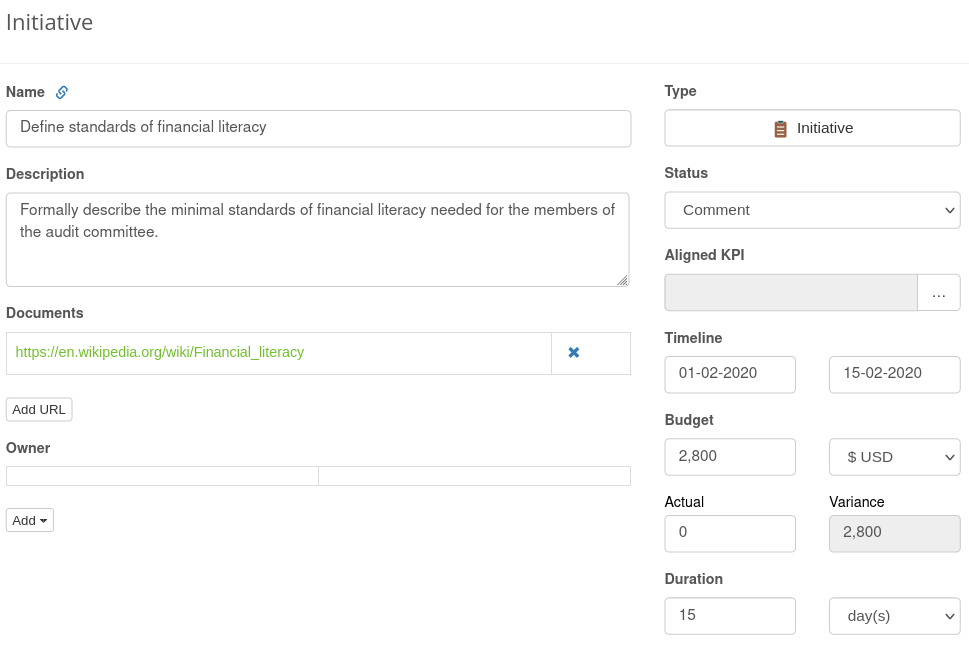
- Financial expertise in the committee, %. The percentage of the members with accounting/financial background. Respectively, it’s required to formally describe the minimal standards of financial literacy needed for the members of the audit committee.
- Balanced set of metrics [binary]. The binary metric that shows if the committee is using a balanced set of financial and non-financial metrics. In this context, the Balanced Scorecard framework helps to establish the right set of financial and non-financial indicators.
- Annual review of the audit strategy [binary]. The result of this review is an audit plan.
- Audit plan completion, % The percentage of the audit plan completion shows how the audit strategy was actually implemented.
- Audit accuracy, % The level of discrepancies between the findings of internal and external audit. The findings can be weighted on a separate scorecard according to their potential business impact.
KPIs for Compliance Committee
This committee ensures compliance with applicable laws and regulations, as well as compliance with the company’s internal policies.
The metrics for the compliance committee can be divided into the leading metrics (aligned with success factors) and lagging metrics (that help to validate the achieved results).
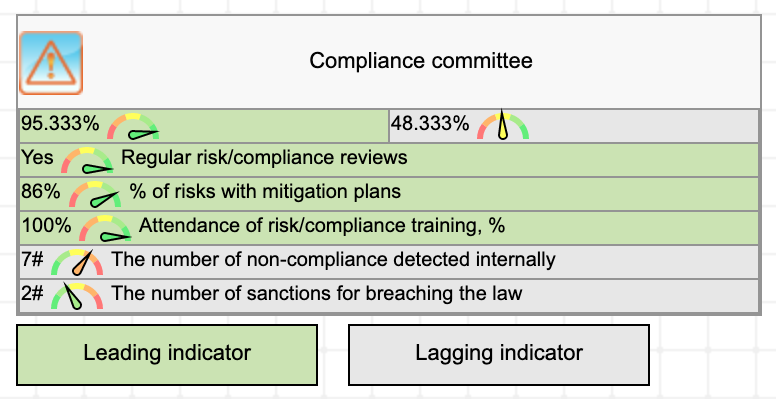
Leading metrics in this case are:
- Regular risk/compliance reviews [binary]
- % of risks with mitigation plans
- Attendance of risk/compliance training, %
The lagging metrics are:
- The number of non-compliance detected internally
- The number of sanctions for breaching the law
Additionally, we can align the general compliance metric with more specific procurement compliance indicators.
How to Quantify Compliance?
Compliance might sound like something intangible, hard to quantify, but basically we need to look at two aspects of organization’s daily life:
- What behaviours are implied by policies and principles of the organization
- What are actual behaviours
The gap between expected and actual will show the degree of compliance. Additionally, we could weight those findings according to their ultimate impact on the performance of organization.
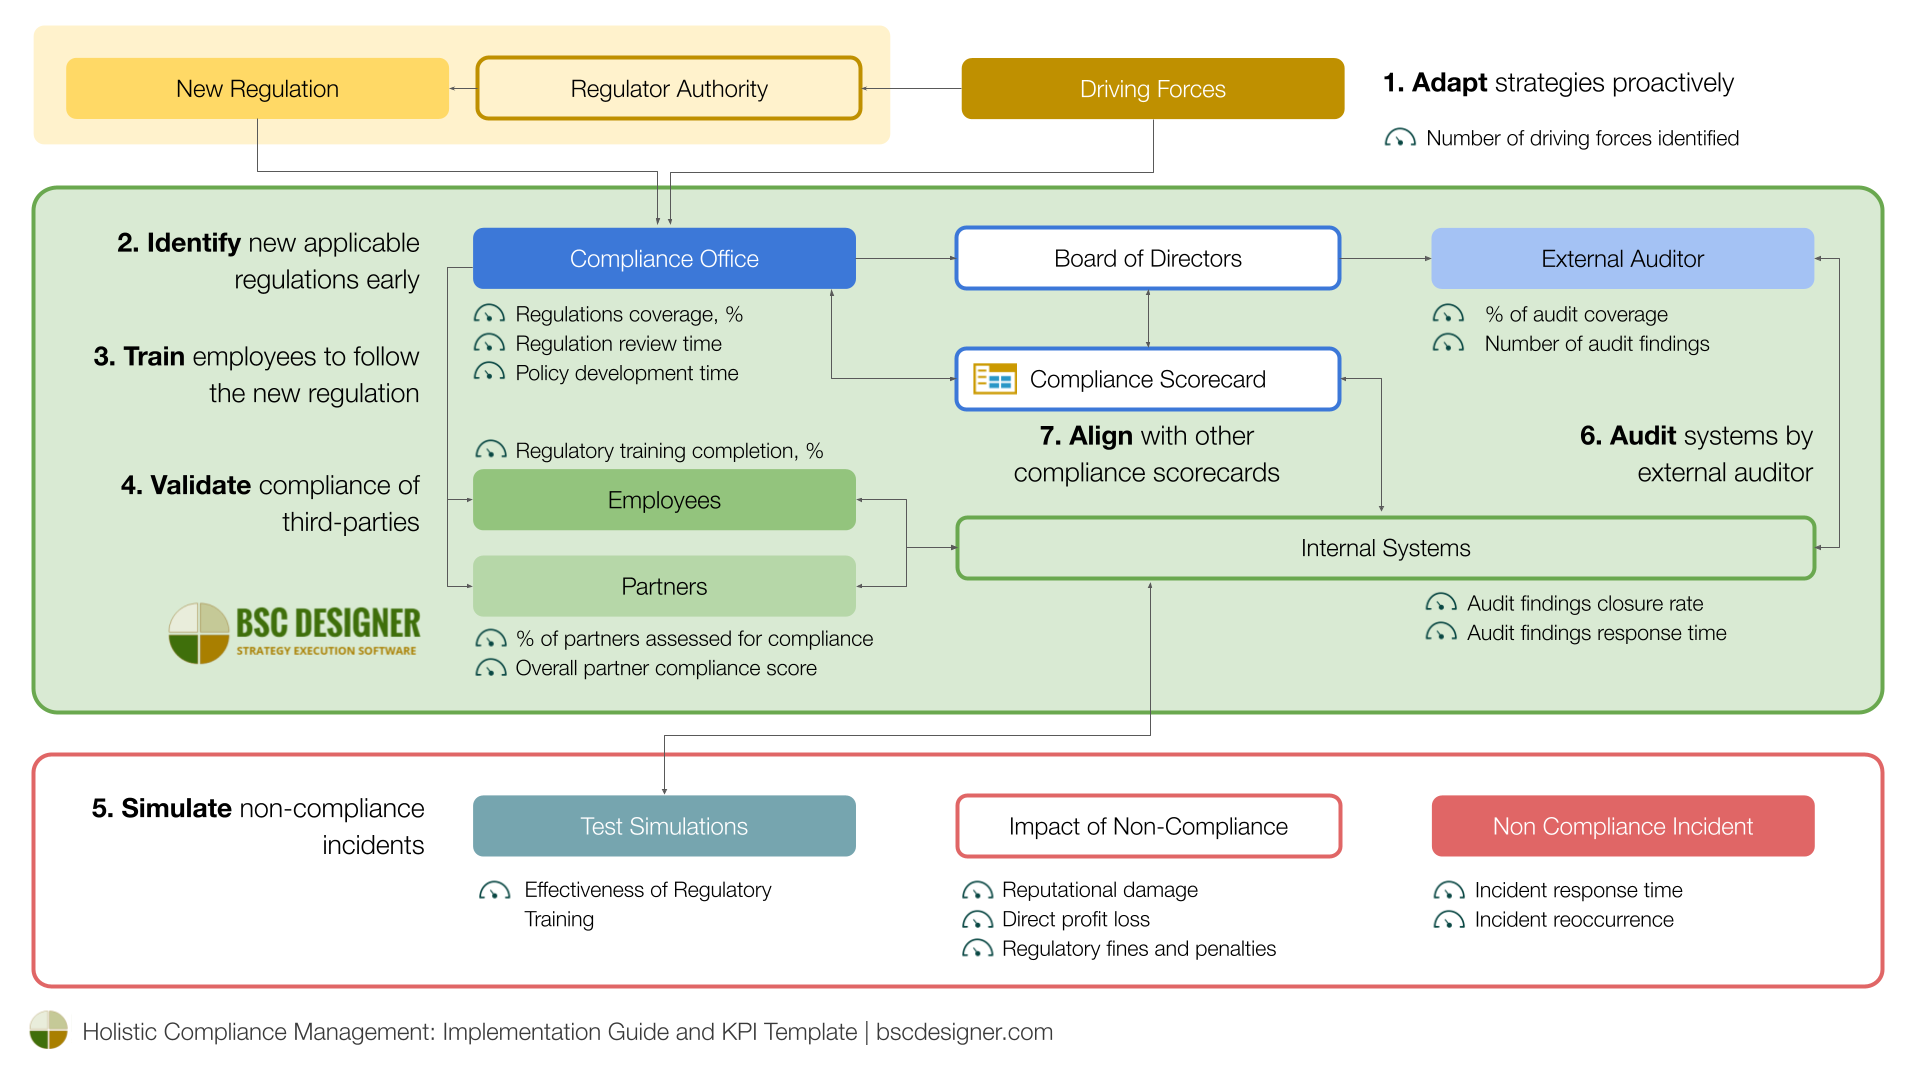
Dedicated Compliance Scorecard
Above, we discussed some high-level metrics for compliance. At the compliance office level, these metrics are translated into dedicated compliance scorecards, as discussed in a separate article. Considering the growing pace of new regulations, a compliance office will have to maintain various compliance scorecards aligned with each other.
KPIs for IT Governance Committee
As Microsoft’s CEO, Satya Nadella, said, “Every business will become a software business…” With the increasing role of IT architecture as well as increasing cybersecurity risks, having an IT governance committee4 as a part of the management board is a smart decision.
Here are the typical initiatives for the IT governance committee:
- Regular review of the IT infrastructure and relevant investments
- Regular review of the IT security practices
- Review of the alignment between IT and overall strategy
- Review IT-related business resiliency plan and implement audit findings
- Trends and technologies review (analyzing the experience of other companies, involving external experts, attending industry events).
Some of the mentioned initiatives can be aligned directly with specific indicators from the IT department scorecard.
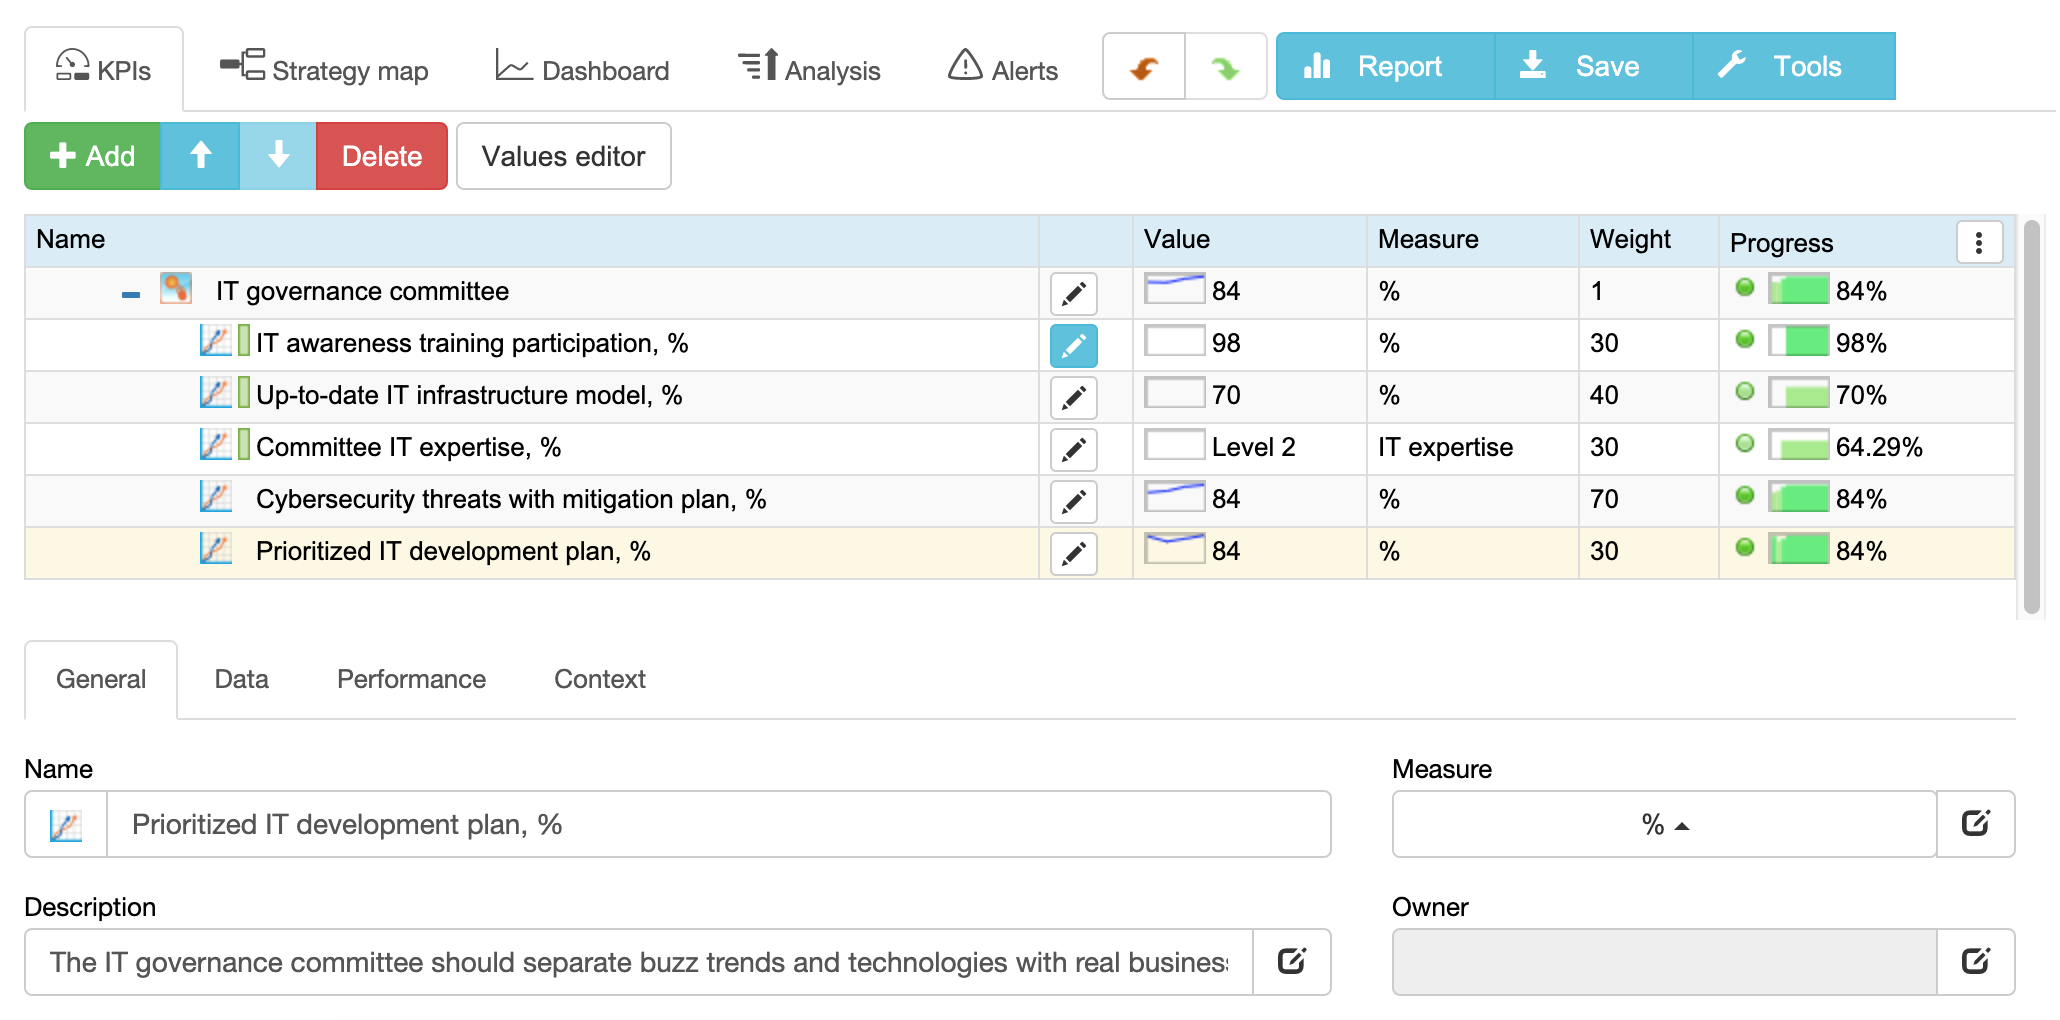
Here are examples of the metrics that can be used:
- Up-to-date IT infrastructure model, % This metric quantifies the results of the regular infrastructure analysis.
- Cybersecurity threats with mitigation plan, % Some threats can be eliminated by upgrading IT architecture, other threats can be addressed by having an adequate emergency plan.
- Prioritized IT development plan, % The IT governance committee should separate buzz trends and technologies with real business impact. The IT improvement plan should include the estimation of the business impact of new technology.
- IT awareness training participation, %. For example, in the context of big data
In the separate section below, we discuss how to quantify and properly map to the scorecard the “regular review” type indicators.
KPIs for Overseeing Senior Management
The main challenge of the board is to oversee the CEO and senior management team.
We can define three stages of the board/management interaction:
- Stage 1. Definition of the management functions
- Stage 2. Values and frameworks – translating the company’s values and approach to the long-term value creation
- Stage 3. Strategy Execution – overseeing the strategy execution and its results
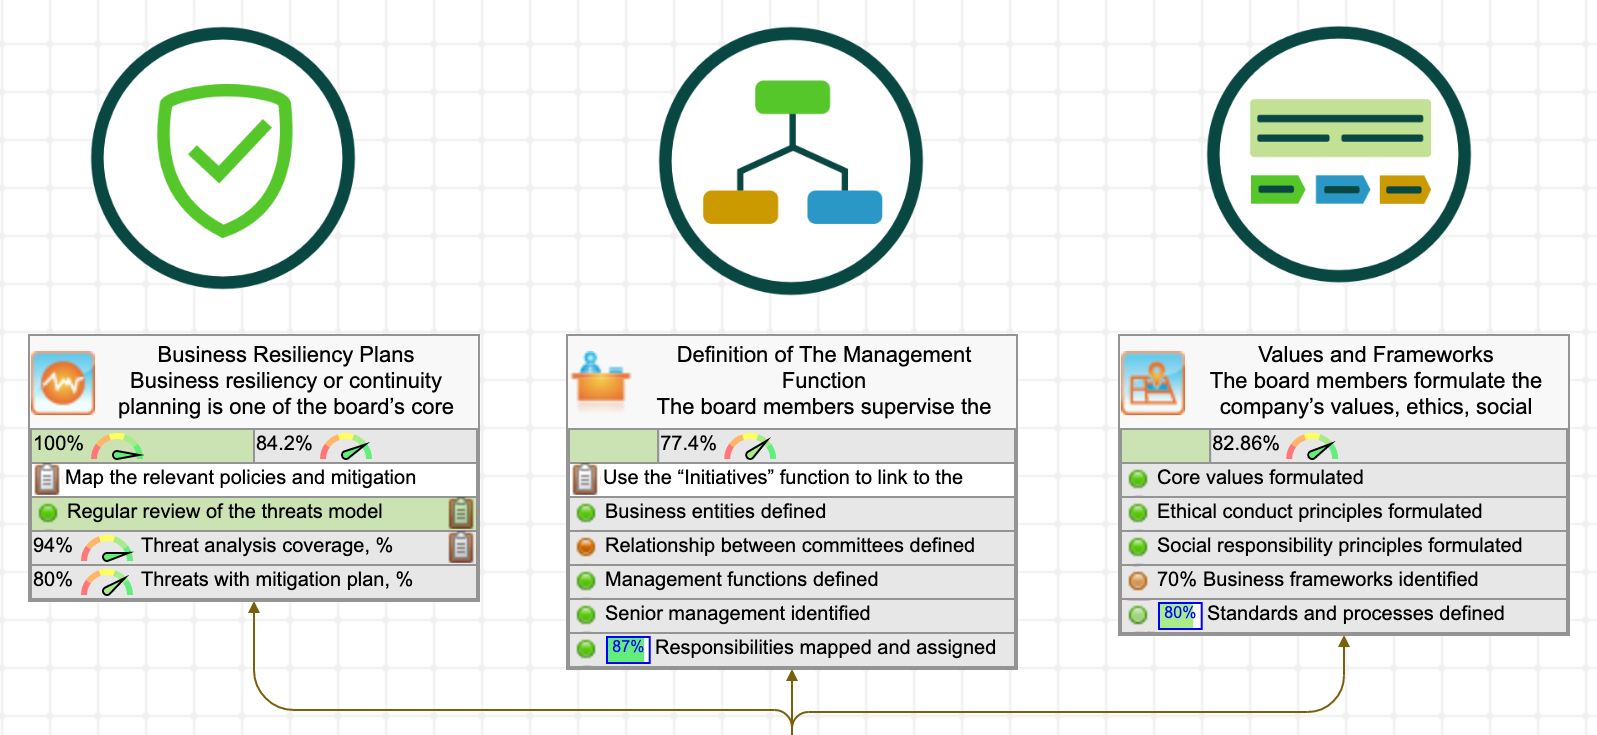
1. Definition of The Management Function
The board members supervise the definition of the management functions.
The binary metrics to track:
- Business entities defined
- Relationship between committees defined (for example, the policy that will regulate the relationship of the IT governance committee and the audit committee)
- Management functions defined
- Senior management identified
- Responsibilities mapped and assigned
Users of BSC Designer can use the “Initiatives” function to link to the respective map and/or policy.
2. Values and frameworks
The board members formulate the company’s values, ethics, social responsibility and sustainability principles. The top-level approach to long-term value creation is defined.
The binary metrics to use in this case:
- Core values formulated
- Ethical conduct principles formulated
- Social responsibility principles formulated
- Business frameworks identified
- Standards and processes defined
Before we discussed the number of strategy planning frameworks; for example, the board can decide to combine the Balanced Scorecard (in the role of a main strategy execution framework) with the PESTEL analysis and innovation planning based on the Three Horizons framework.
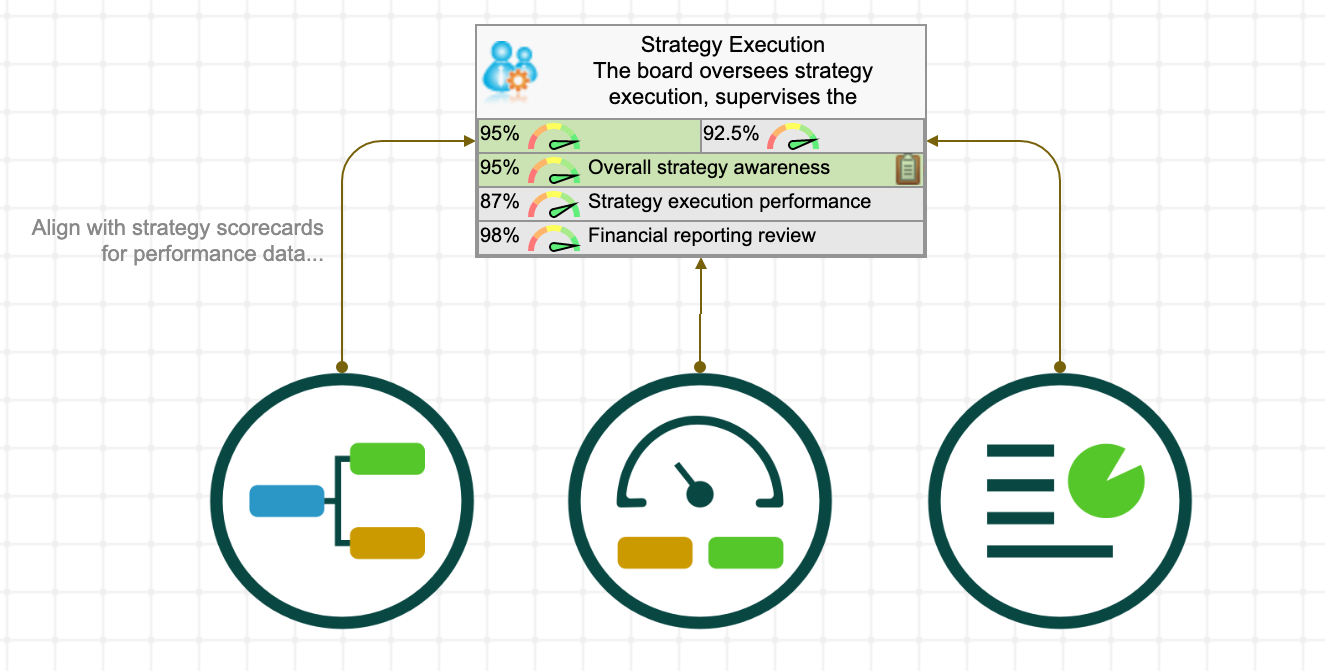
3. Strategy Execution
The board oversees strategy execution, supervises the performance of CEO, capital allocation, risks, financial results, etc.
The top level KPIs for the board, in this case, can be:
- Overall strategy awareness metric, %
- Strategy execution performance review
- Financial reporting review
The performance review can be conducted according to the top level performance indicators of previously approved strategies.
For example, a company can focus its innovation efforts on using a scorecard for innovations and reports according to the efficiency of the innovation pipeline as well as the revenue from the new products.
Business Resiliency Plans
Business resiliency or continuity planning is one of the board’s core responsibilities. The factors to take into account are:
- Physical security
- Cybersecurity
- Crisis management
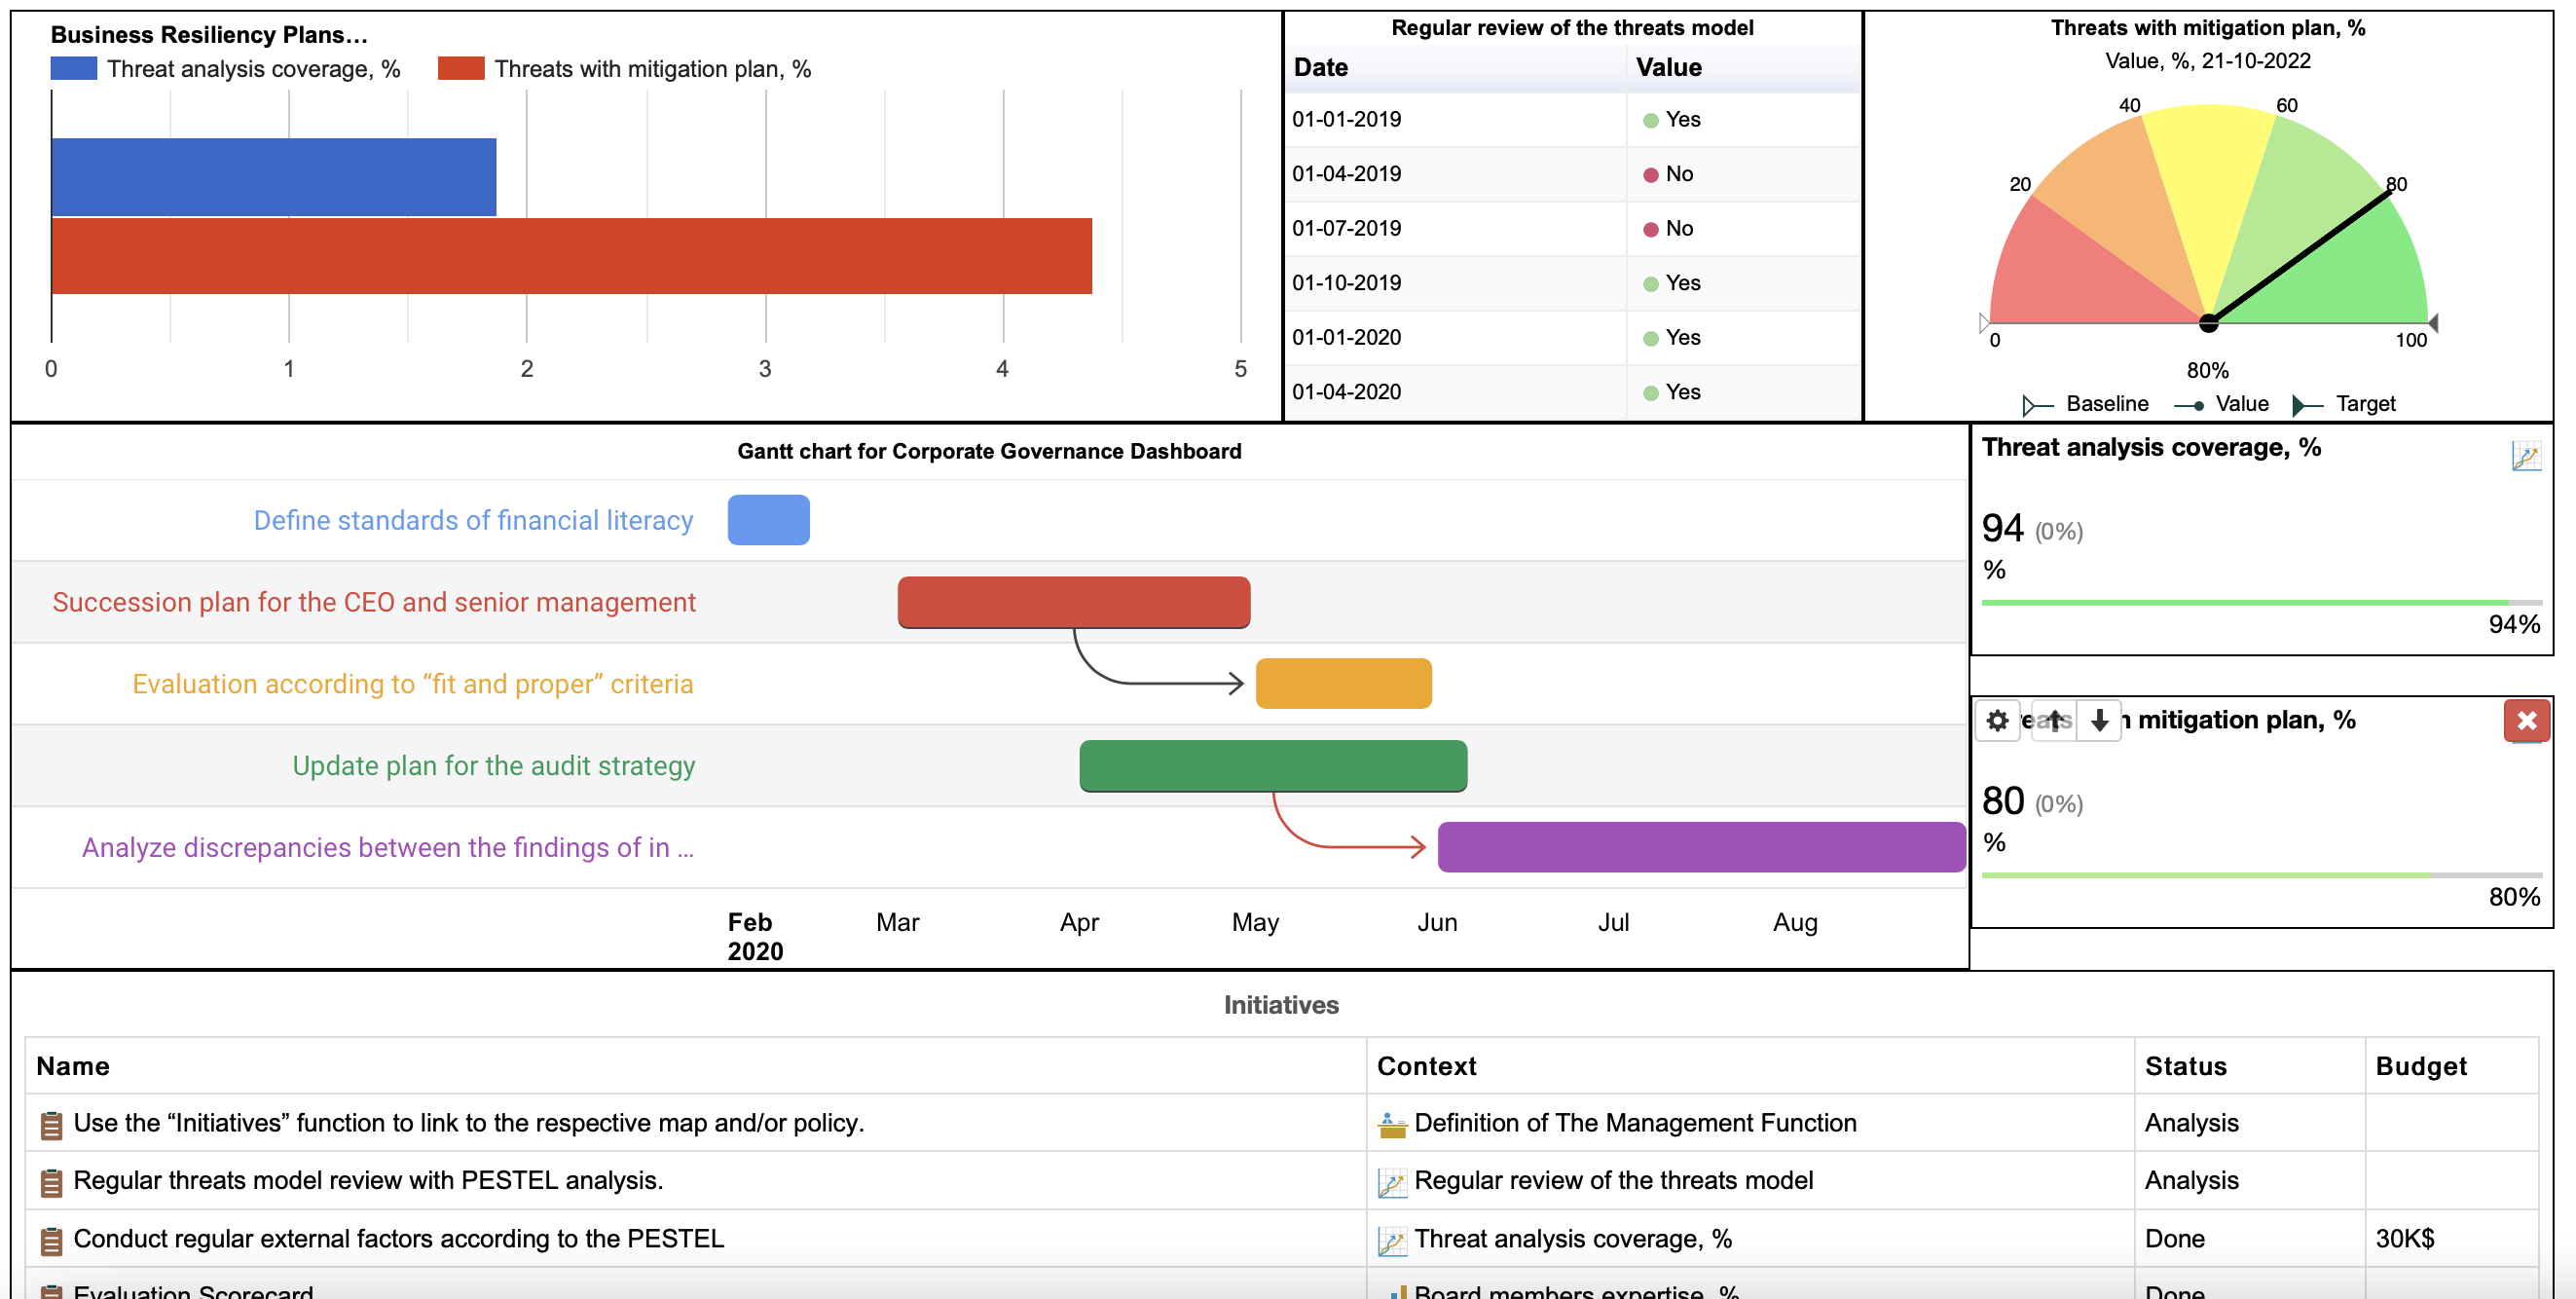
The metrics to be used in this case will include:
- [Leading] Regular review of the threats model
- [Lagging] [Weight=30%] Threat analysis coverage, % Where the 100% might be the analysis of all categories of external factors according to the PESTEL
- [Lagging] [Weight=70%] Threats with mitigation plan, %
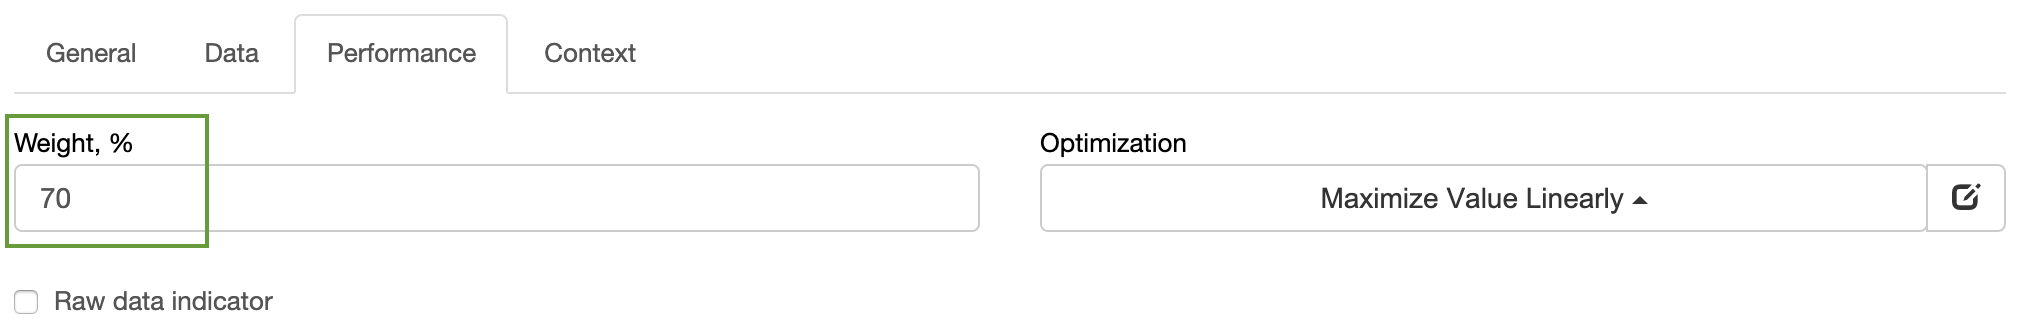
Different weights can be assigned to the lagging metrics to reflect their importance for the overall business resiliency performance:
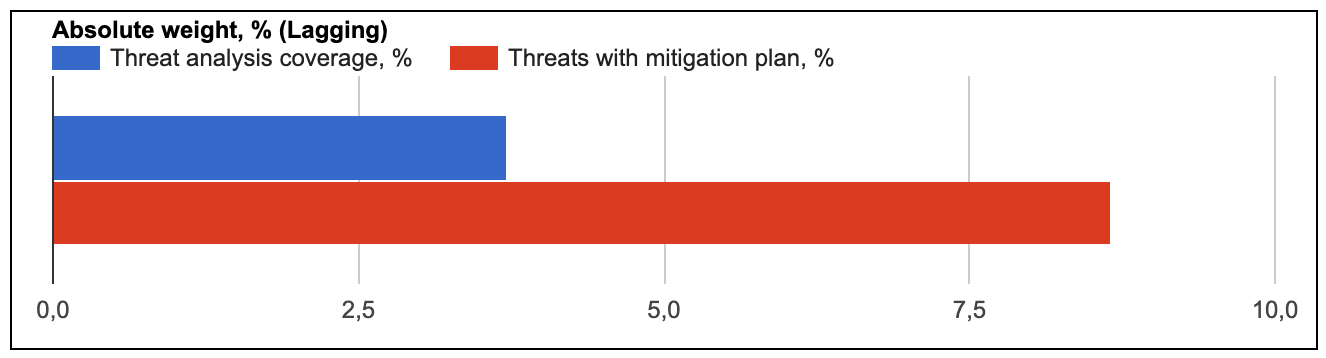
Users of BSC Designer can map the relevant policies and mitigation plans via the “Initiatives” function.
Best Practices for Measurement in GRC Domain
Let’s discuss some best practices related to quantifying and measuring the values of certain indicators in the context of GRC domain.
Expertise Metrics (like “Board members expertise, %”)
Talking about corporate governance, we will be using “expertise metrics” often, for example, for the nominating committee, we suggested using “Board members expertise, %.”
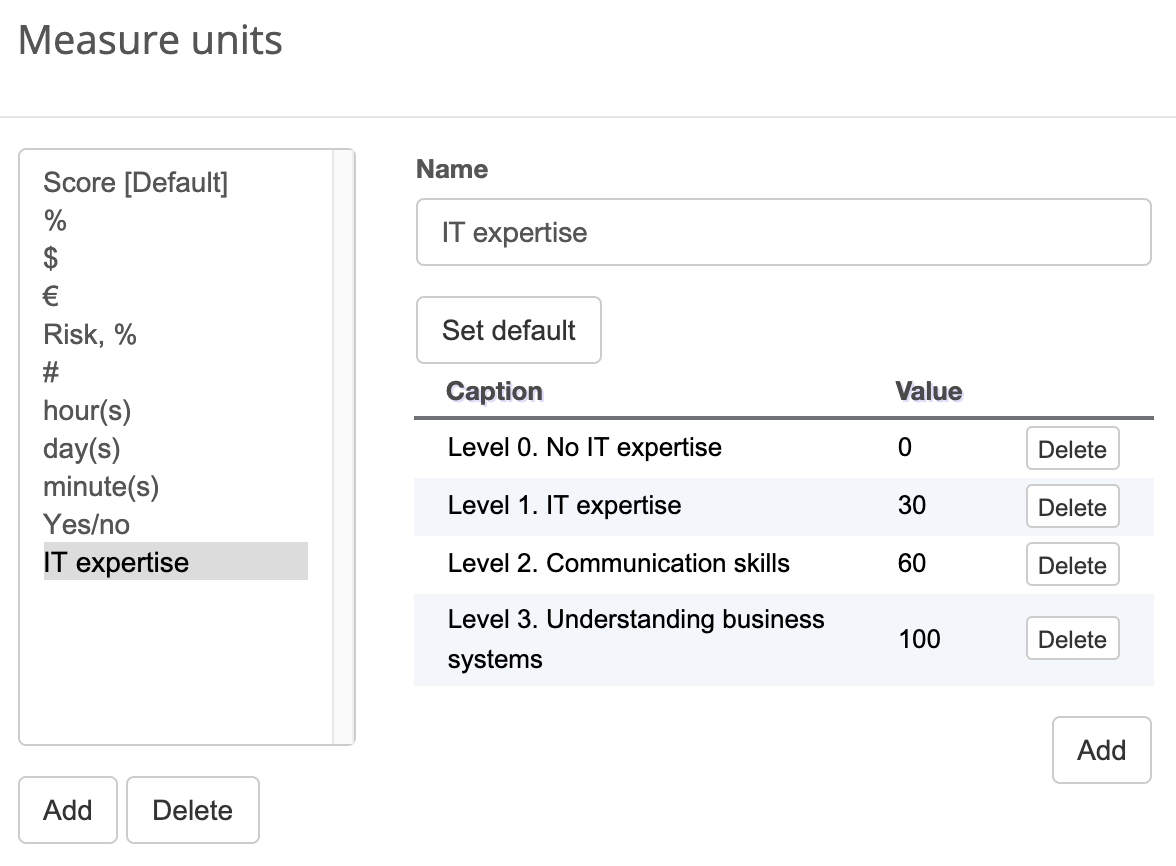
Expertise is a qualitative value, and the easiest way to convert it into the quantitative value is to put it on a certain scale applicable for your case.
For example, if we are talking about expertise in the IT industry, we can map it in the following way:
- Level 0 : 0 … No relevant expertise in IT
- Level 1: 30 … IT expertise (education, professional background, etc.)
- Level 2: 60 … Communication skills (knows both IT and business jargon, can explain complex IT concepts in plain English)
- Level 3: 100 … Relevant experience in the company’s business domain and
Users of BSC Designer can map such types of measures using “Custom measure units.”
The more formal approach to quantifying such indicators would be converting them into an index metric, with relevant sub-metrics and their respective weights:
- Estimation of experience, % (education, previous projects, previous experience in similar companies)
- Communication skills, % (subjective estimation during interviews)
- Vision match with company’s overall strategy, % (subjective estimation during interviews)
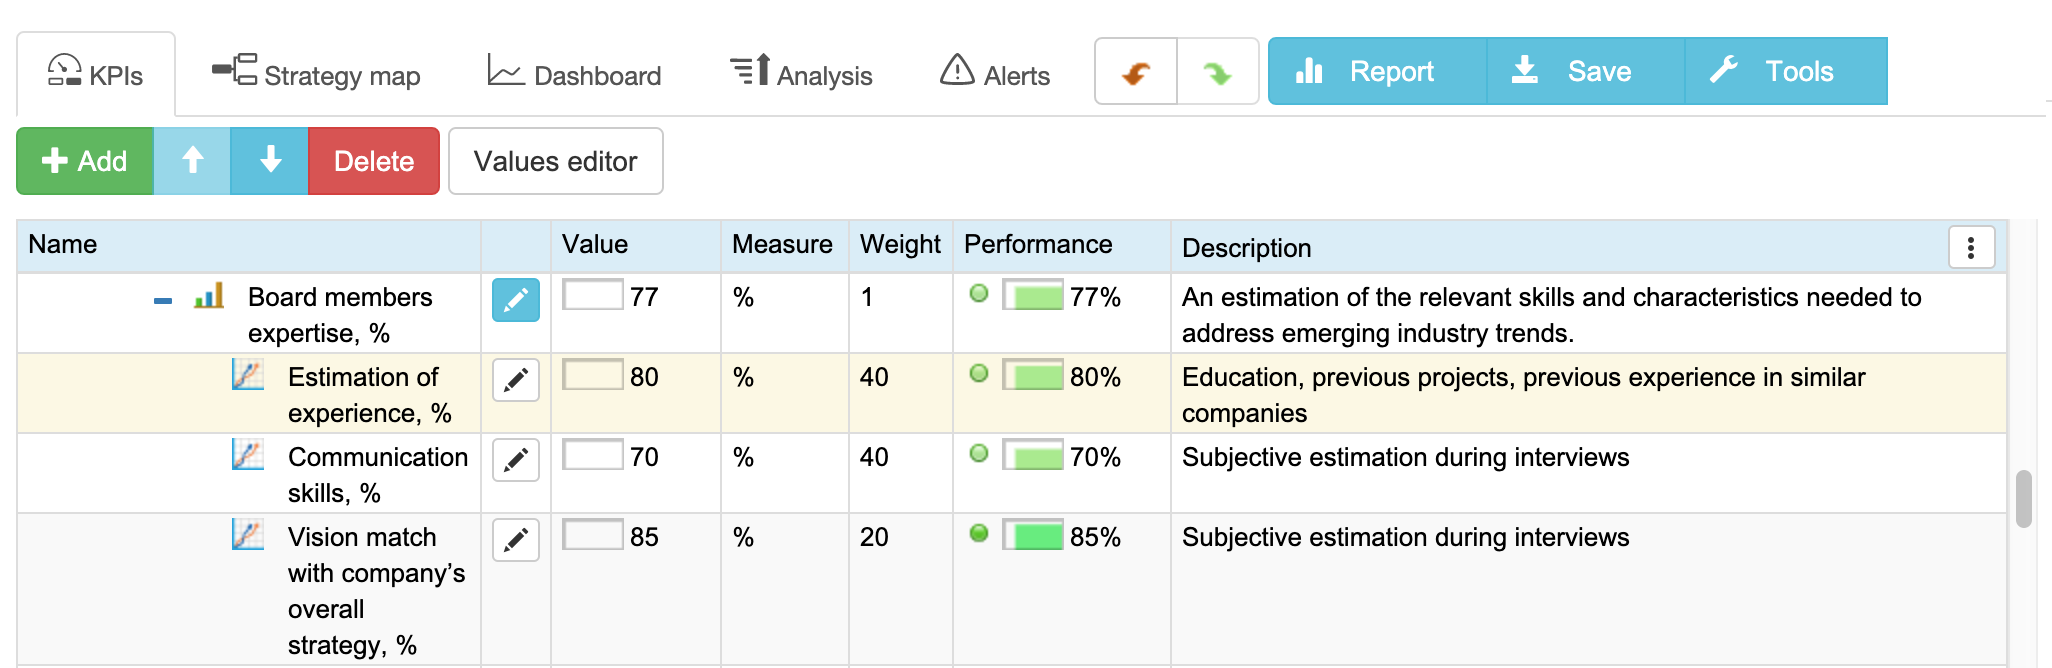
The decision about subjective estimations might involve voting of several members of the nominating committee.
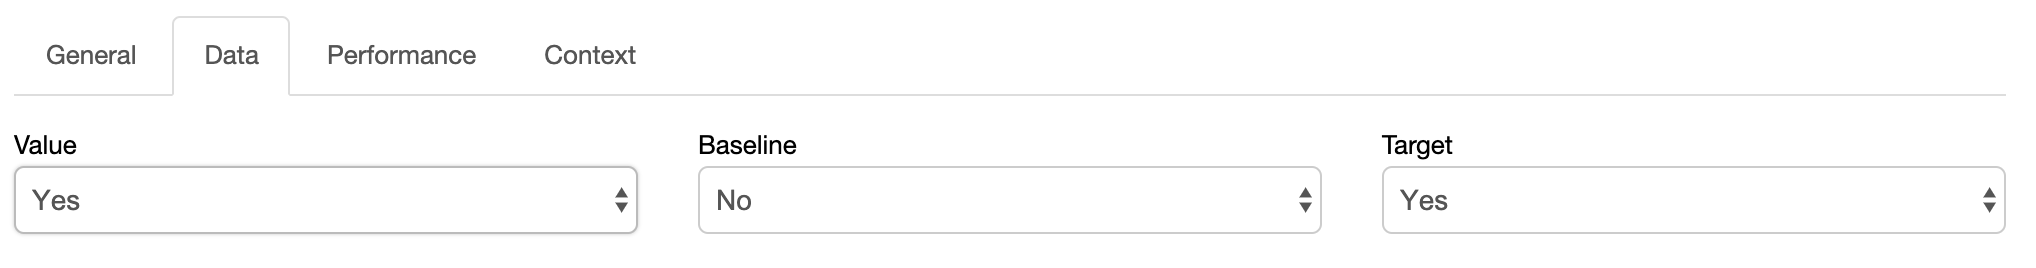
Binary Metrics (like “The separation of the Chairman/CEO positions”)
Certain metrics have a binary nature, and their value can be “yes” or “no.” For example, the “Chairman/CEO positions separated” is a binary metric. The CEO and the chairman are the same people, or those are different persons.
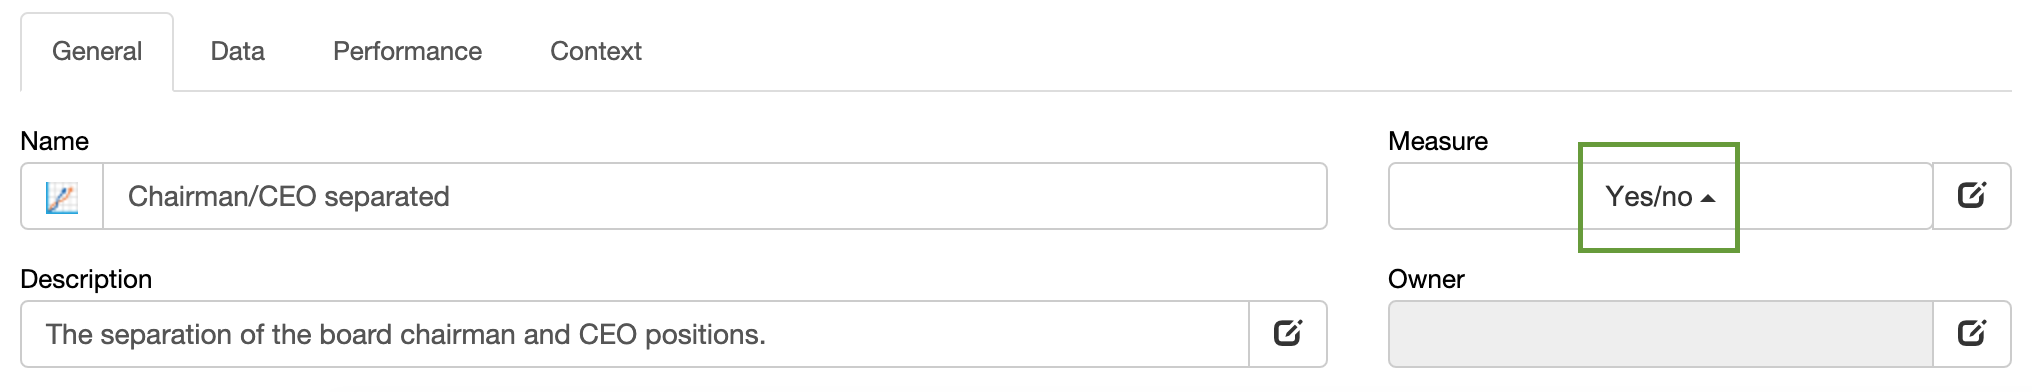
While this indicator is binary, it doesn’t mean that its implementation is straightforward (the separation of the Chairman/CEO positions might imply serious organizational changes).
Make sure to map the context behind this binary indicator, as well as an action plan (the steps needed to achieve and maintain the desired state).
Users of BSC Designer will find the “Initiatives” function useful for this purpose.
Regular Review Metrics (like “Review of the threats model”)
Some metrics imply regular reviews of certain aspects of the organization’s performance. Let’s call them “regular review metrics.” An example of such a metric might be “Regular review of the threats model.”
In the way it is formulated now, it doesn’t look like a metric (for example, there is no obvious quantitative value).
Let’s discuss how to properly put this metric on the scorecard:
- The metric is similar to the binary metric – it tells us if the review was done or not
- Additionally, this metric implies regular updates of its state – the results of threat review for Q1 should not be automatically transferred to Q3
How to automate all these ideas with the software? Here are some ideas for the users of BSC Designer:
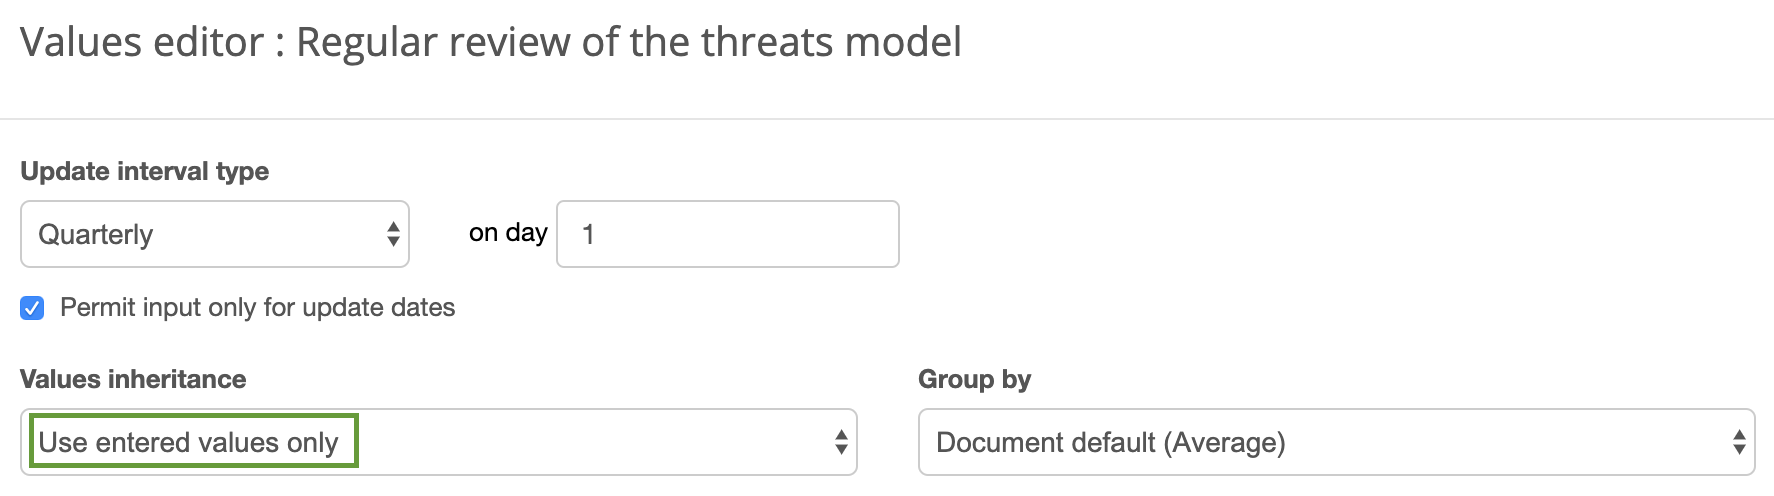
- Set the “Update interval” for the indicator to reflect the proper review period; for example, this can be annual or quarterly updates:

- Use the “Analysis” function to find metrics that require your attention.
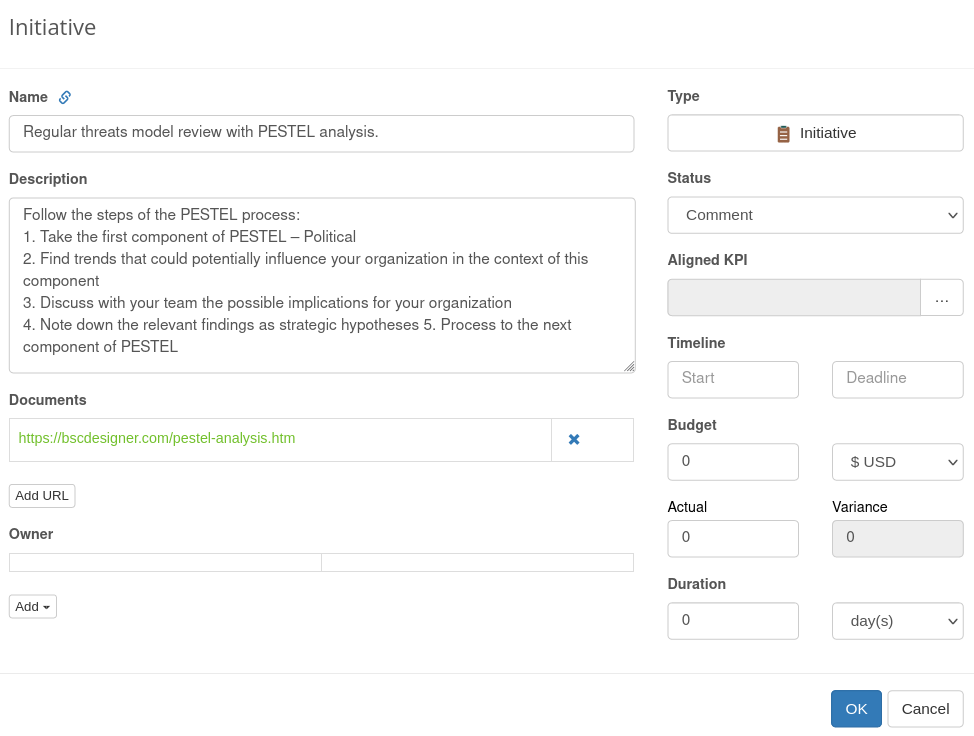
- Use “Initiatives” to explain the details of the regular threats model review. For example, this can be done via PESTEL analysis:
- Follow our
 Strategy Implementation System to align stakeholders, strategic ambitions, and business frameworks into a comprehensive strategy.
 - Automate strategic planning with BSC Designer by organizing goals, initiatives, risks, and KPIs into scorecards.
More About Strategic Planning


Basic Quantitative Metrics (like “The number of committee member”)
There are some basic quantitative metrics that look like obvious ones with low business value. Let’s take “the number of committee members” as an example.
By itself, this metric won’t tell us any story about expected committee effectiveness. The committee of two persons might be as effective as a committee of 20 persons.
How to target this metric? It depends on the current challenges of the organization – are you looking for faster decision making or a more balanced and diverse group of directors? The optimum size will vary around 2 to 10 persons.
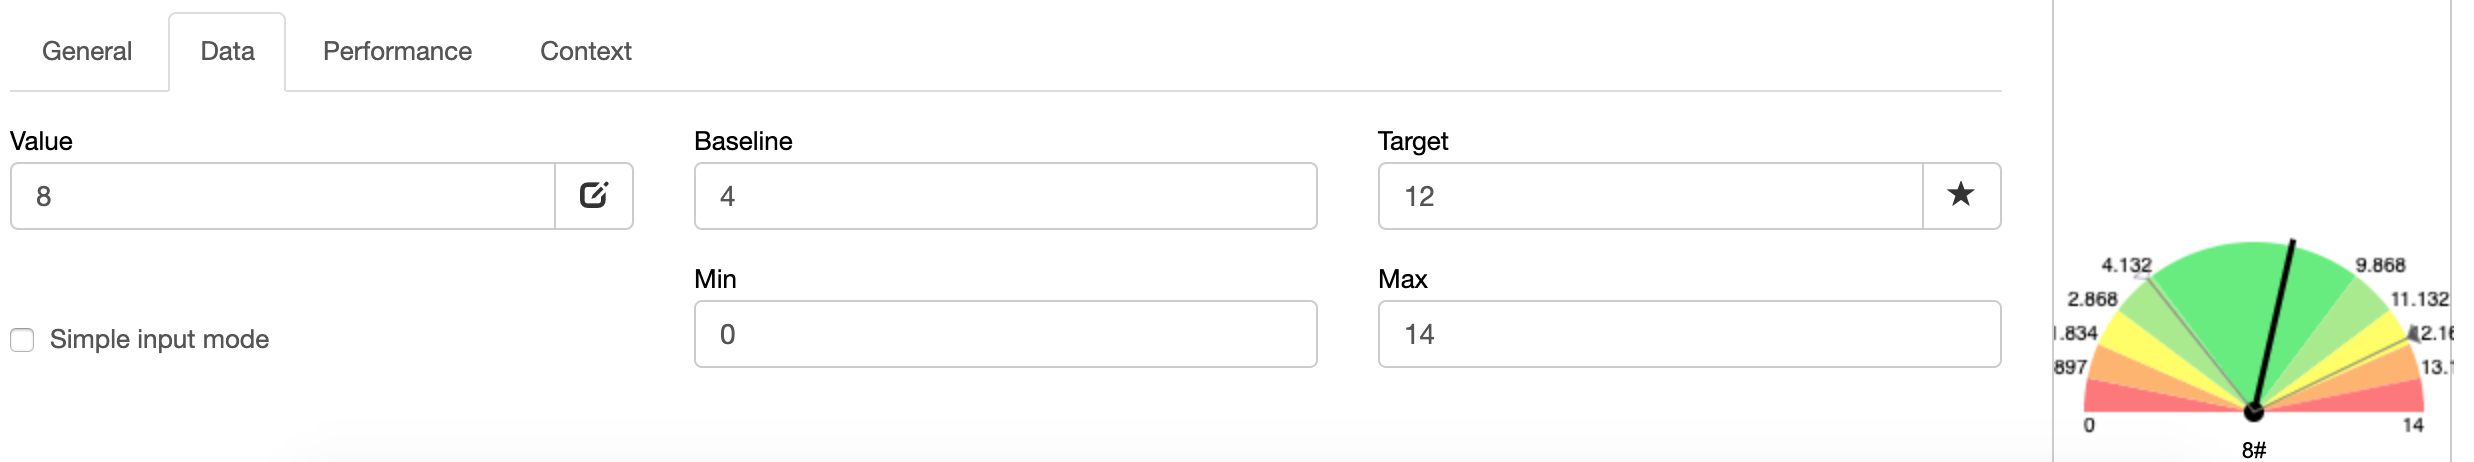
A green zone for this indicator might be somewhere in the middle. The indicator’s stoplight might change rapidly to the red zone if the value superates certain minimal or maximal thresholds.
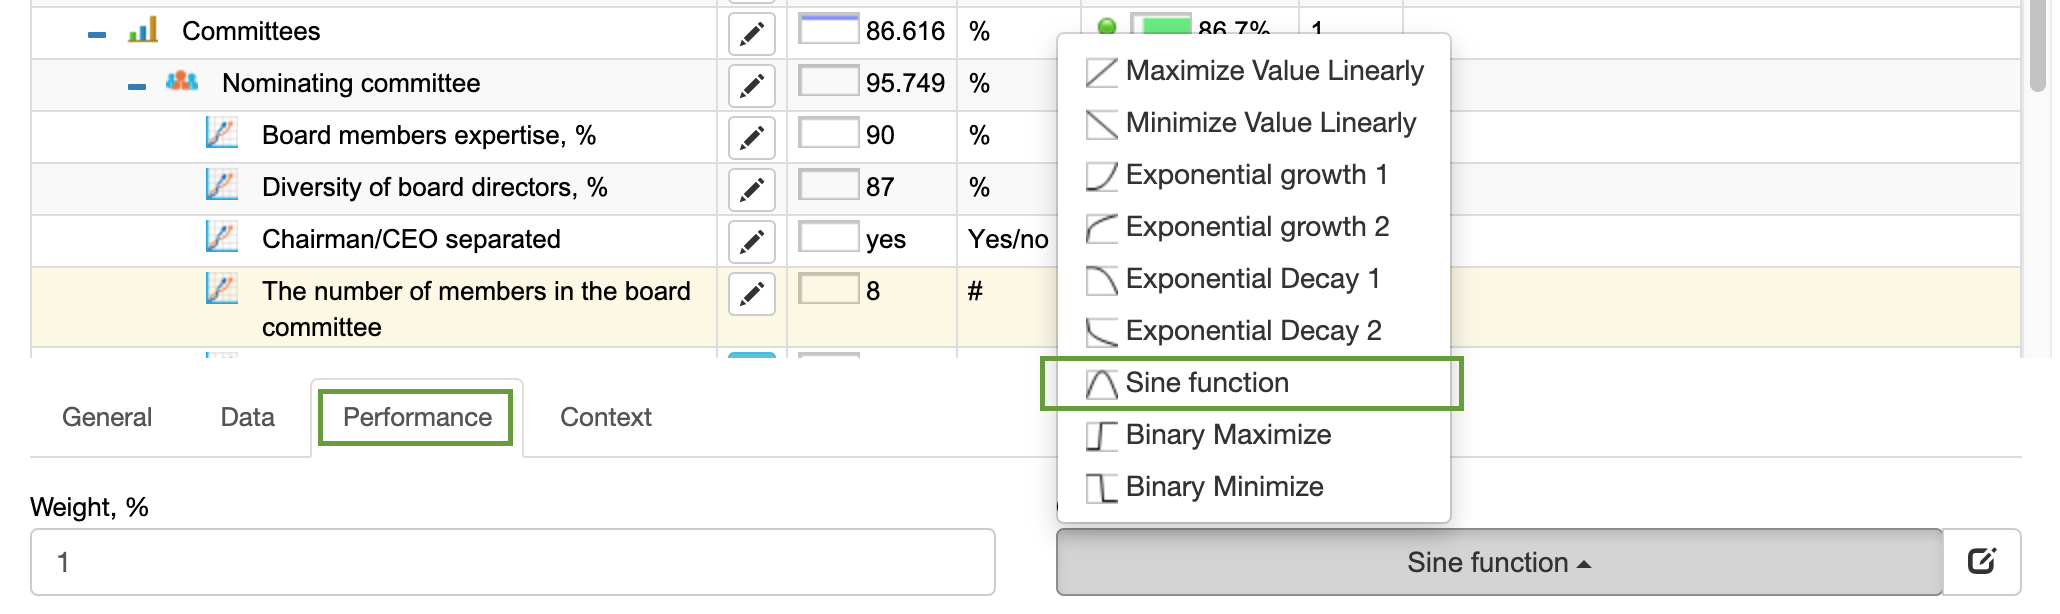
Users of BSC Designer will be able to reflect these values using “baseline” and “target” values for the “committee members” metrics. The change in the “Performance function” will help to better reflect the desired behaviour of the indicator.
Start Governance Scorecard with Stakeholders
Business goals, as well as the performance metrics to track them, are unique for an organization.
- Use metrics from the governance template discussed in this article as a starting point
- Master your skills for finding winning metrics
A good starting point in the search for winning metrics is to have a long list of the stakeholders involved. In a case of corporate governance, these will be:
- Shareholders
- Board members
- Board committees
- External auditors
- CEO and top managers
Other stakeholders:
- Customers
- Employees
- Community
- Government
- Regulators
- Suppliers
- Partners
What’s next? Check out our “KPI System” for more guidance.
Leading vs. Lagging Metrics
The primary role of the board is overseeing the strategy execution. It’s important to remember the difference between:
- Success factors (as quantified by leading indicators) and
- Achieved results (as measured by the lagging metrics).
What should the board look at? In the ideal case, the management team should present to the board both – top level leading and lagging indicators.
Here is an example of the leading indicators (green color) and lagging indicators (gray color) in the context of IT governance committee:
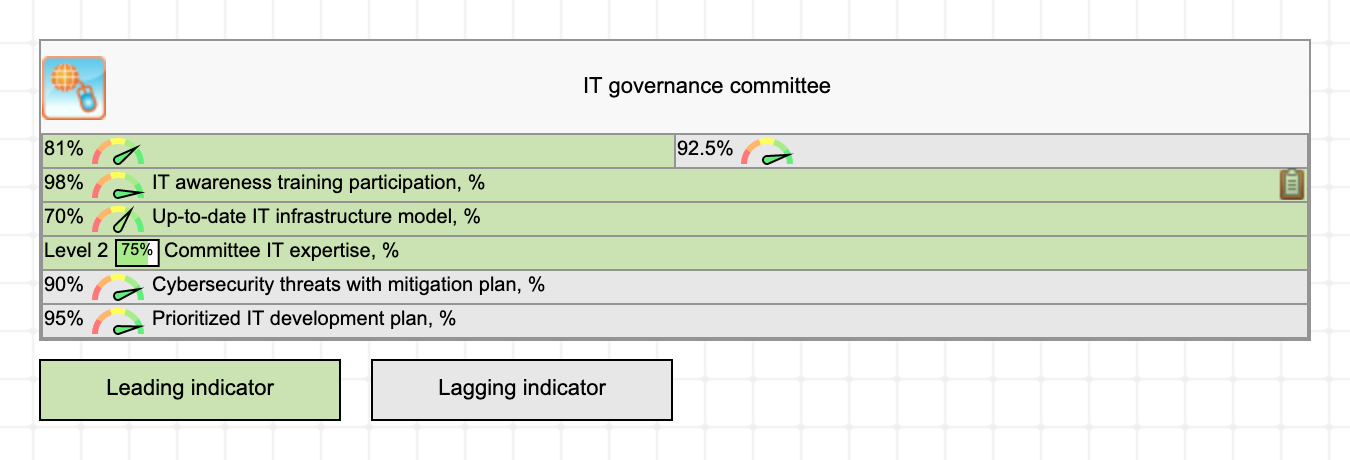
In this example, the “IT awareness training” and “Up-to-date IT infrastructure” are the success factors for the future effective mitigation plan for cybersecurity threats.
Another classical (not necessarily the best one) leading indicator is budget required, the lagging indicators to validate the result are the financial performance indicators.
A good question to ask:
Is budget the only factor of successful strategy execution?
This question is a starting point for the discussion. The idea is not to find more leading indicators (it will be a good side effect) but to find points where the board could contribute with their experience.
GRC Software: Do We Need a Separate Tool for GRC?
Most of the organizations already have their strategy execution process automated in some way. Do they need to invest in a specialized GRC software?
In my opinion, GRC should not be a standalone part of business. On the contrary:
GRC should be a part of a comprehensive strategy execution framework.
A specialized GRC tool will certainly add another layer of organization to the policies, risk definitions, and compliance procedures, but this will inevitably lead to an additional layer of bureaucracy and informational isolation. Is your organization ready to pay the price of another informational silo?
My recommendation is to look first at the tool you already use for strategy execution. Probably, that tool will successfully support most of the automation challenges of the GRC domain. Let’s discuss some of those challenges below.
Managing Policies and Procedures
One of the main functions of a GRC tool is to manage policies, procedures and other supporting documentation. Can a strategy execution software address this challenge?
The main idea behind GRC is to align activities with business goals. The easiest practical way to do this is to simply link a specific policy directly to the business goal or indicator.
Should you use specialized GRC software just to keep all policies/procedures in one place? In my opinion, this doesn’t make a lot of sense unless you are in a heavily regulated business. From a practical point of view, it’s easier to give a link to the internal content management system where the policies are stored in an organized way.
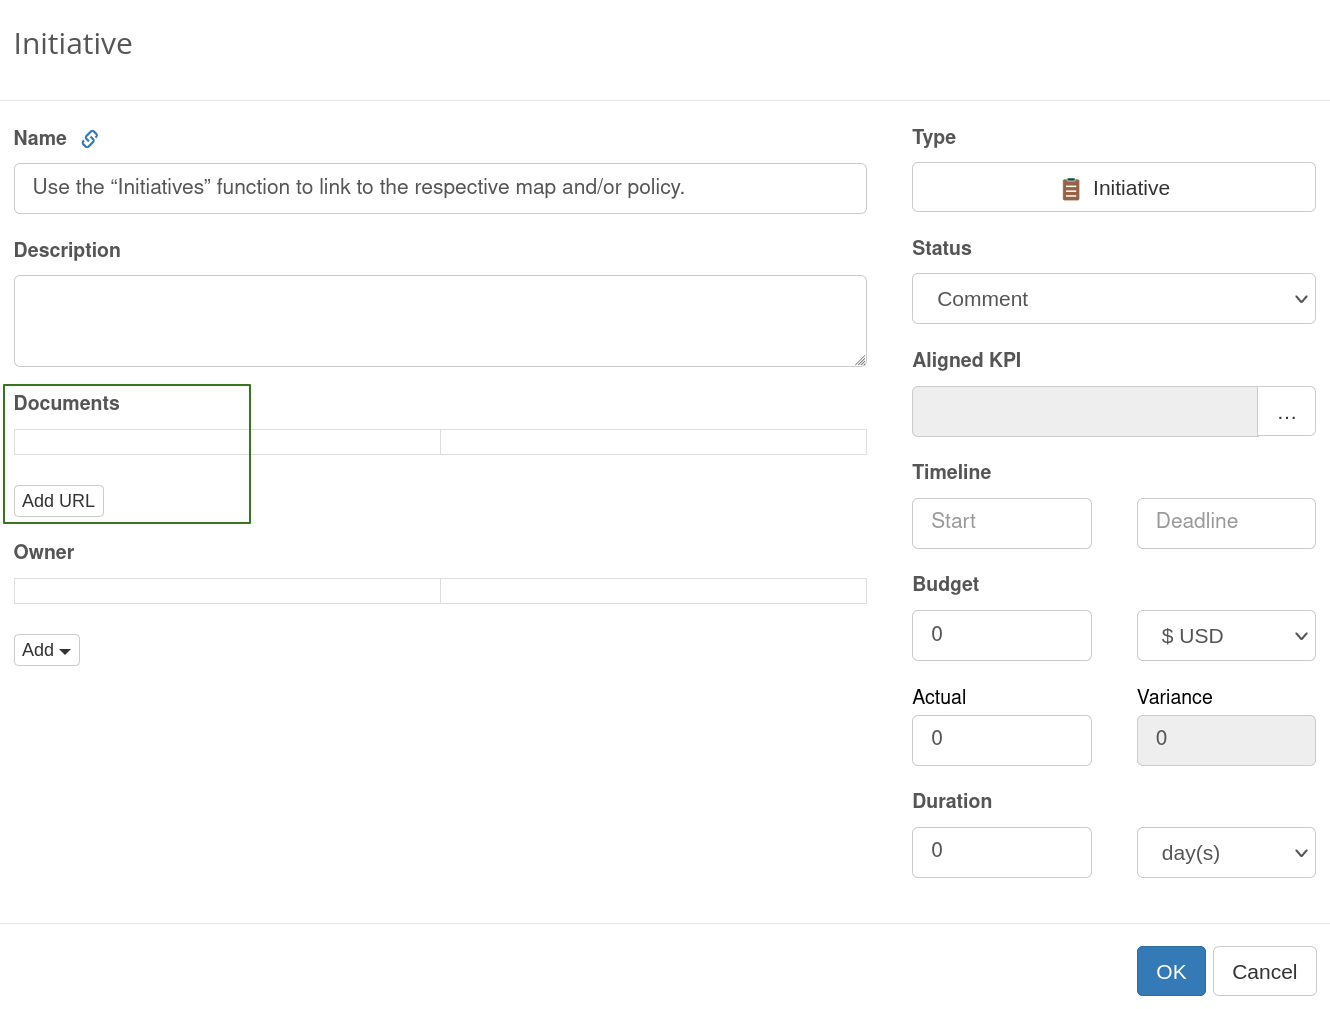
If you are using BSC Designer, then you can do it via the initiatives dialog. In this way, you can map policies to the areas of compliance.
Managing Risk Definitions
The best way to define a risk is to quantify it. In this sense, risk is another indicator that we need to track.
As for any indicator, we can write down its complete definition in the description field:
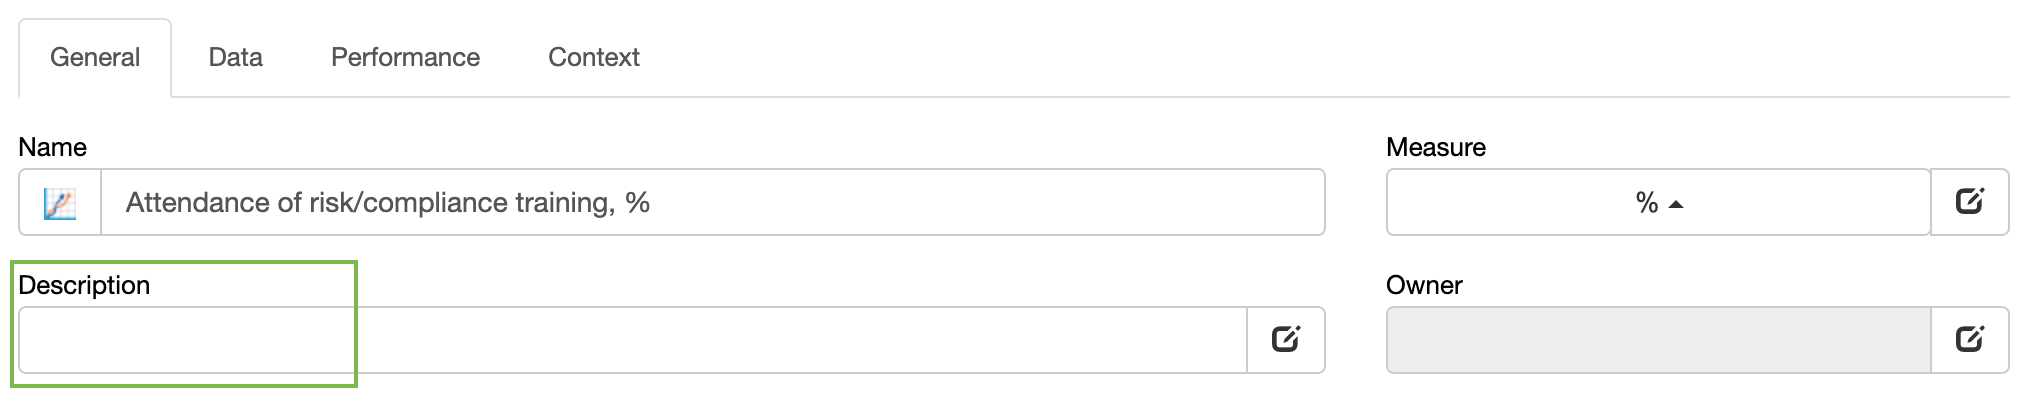
The persons in charge of the risk analysis and risk mitigation plans can be the owners of the Key Risk Indicator and/or the owner of the business goal that defines the context for this risk.
Similar to the policies, additional information can be explained via initiatives. For example, a link to the relevant risk analysis reports will make the discovery and retention of required information easier.
Balanced Scorecard for Corporate Governance
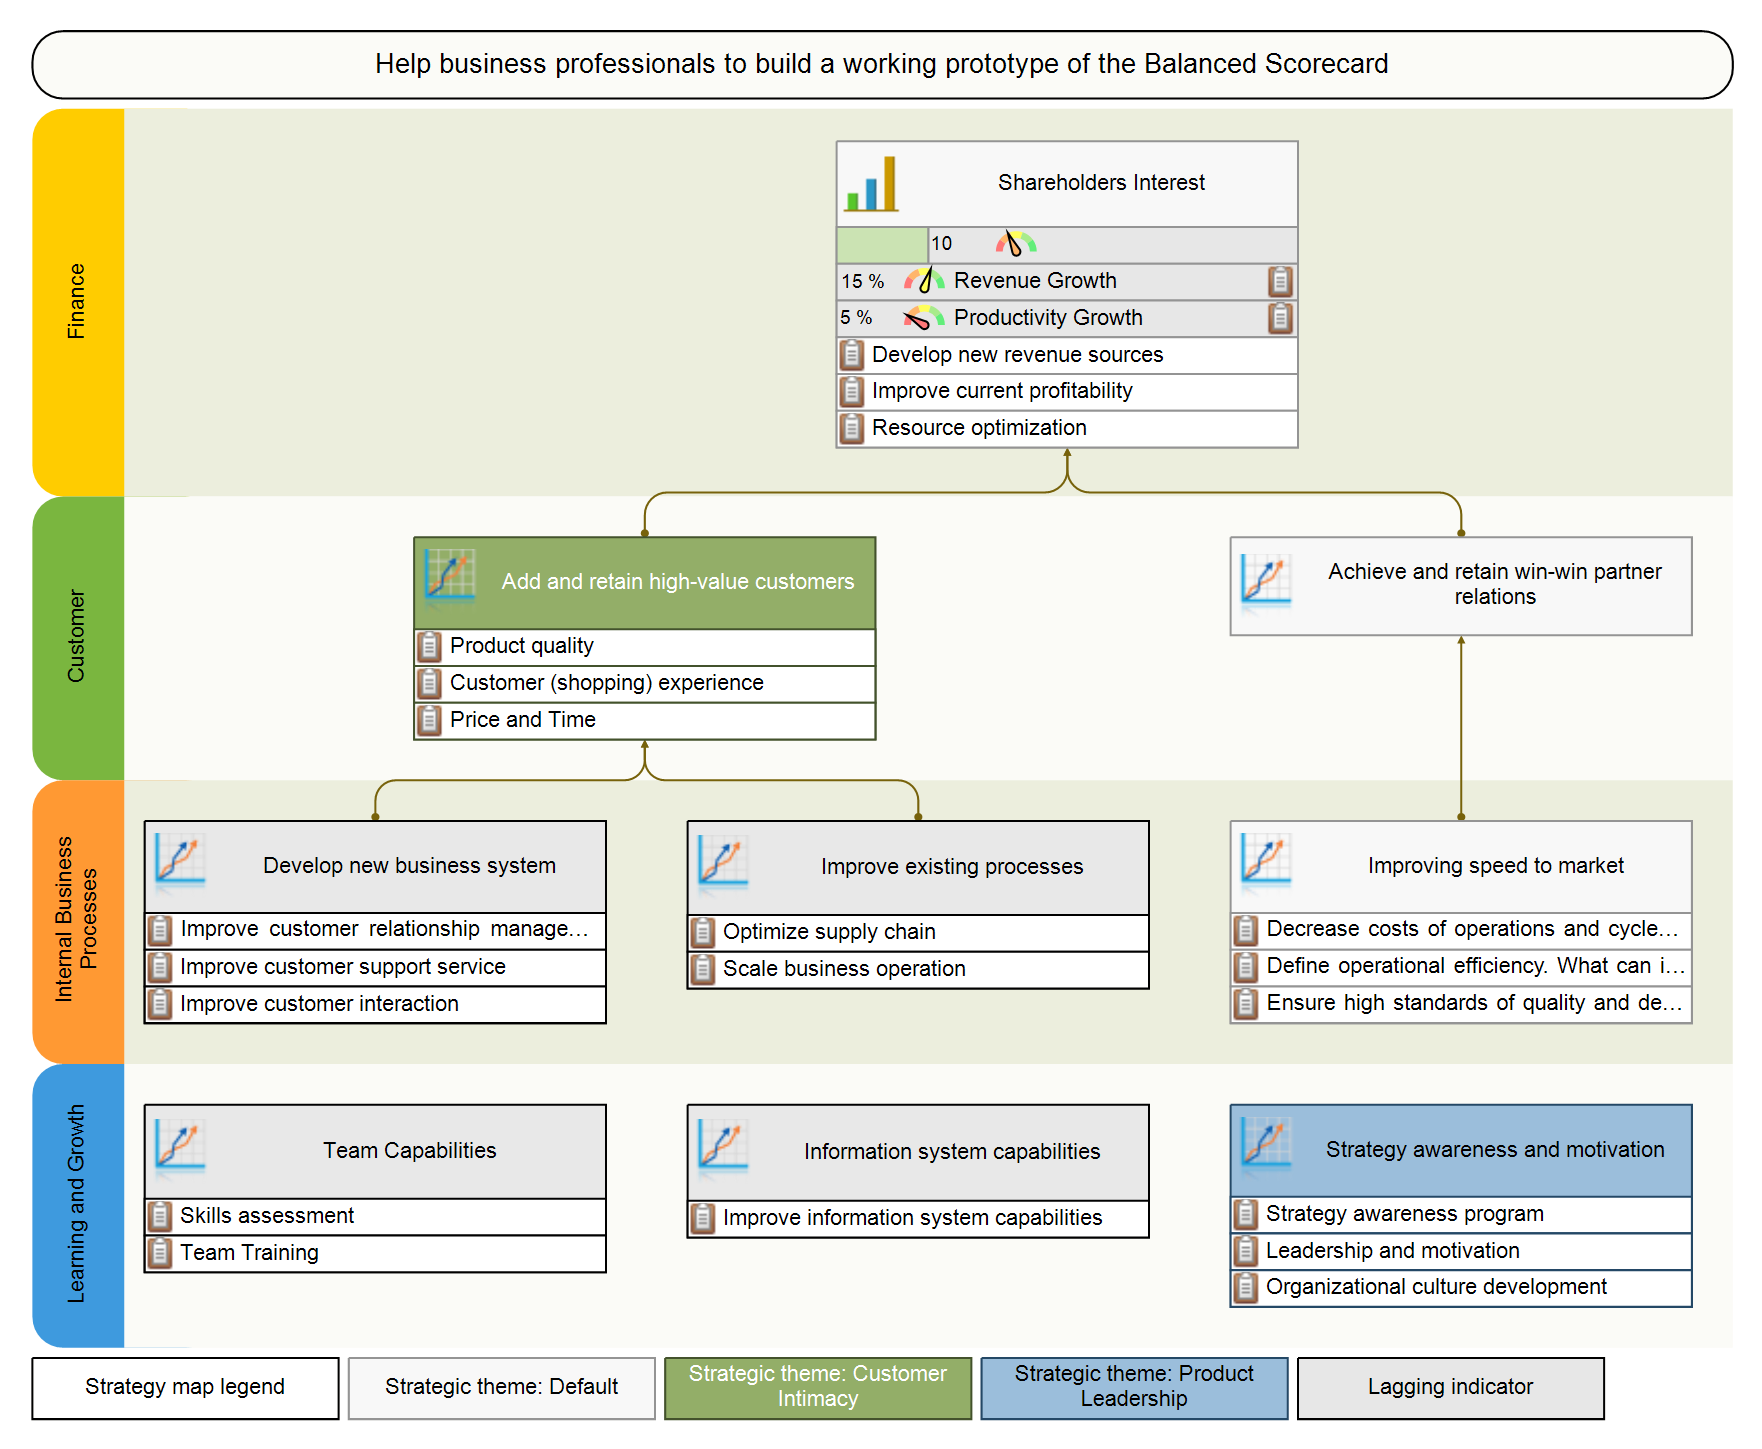 Corporate governance, in its essence, is focused on proper strategy execution. The choice of the supporting framework will define the effectiveness of the discussions around strategy, strategy awareness, and alignment of the low level strategies with the overall company’s strategy.
The Balanced Scorecard framework is a good choice for this challenge. Among its benefits is a wide adoption within Fortune 1000 companies that makes it a universally recognized “language” for strategy description and execution.
The cause-and-effect logic between the strategic goals, cascading, as well as the focus on the quantification of the goals shifts the strategy execution process to a higher level of effectiveness.
Users of BSC Designer will enjoy native support of the Balanced Scorecard framework with a full toolkit for strategy maps and KPIs management, as well as access to other strategic planning frameworks, such as PESTEL, OKR, Three Horizons, and VRIO.
What's next?- Follow our Strategy Implementation System to align stakeholders, strategic ambitions, and business frameworks into a comprehensive strategy.
- Automate strategic planning with BSC Designer by organizing goals, initiatives, risks, and KPIs into scorecards.
More About Strategic Planning
- Principles of Corporate Governance, 2016, Harvard Law School Forum on Corporate Governance ↩
- When and Why Diversity Improves Your Board’s Performance, CrearyMary-Hunter, McDonnell, Scruggs, 2019, Harvard Business Review ↩
- Why the Next 5 Years will be the Most Challenging for Boards, Craig Guillot, 2017, Chief Executive ↩
- Information Technology and the Board of Directors, Nolan, McFarlan, October 2005, Harvard Business Review ↩
![]() CEO | Author | Speaker
CEO | Author | Speaker
BSC Designer is strategy execution software that enhances strategy formulation and execution through tangible KPIs. Our proprietary strategy implementation system reflects our practical experience in the strategy domain.