Effective compliance goes beyond educating employees about new regulations and tracking the number of non-compliance incidents. In this implementation guide, we focus on a holistic view of compliance that involves key stakeholders and suggests specific quantification of the compliance efforts and results through 7 steps.
Stakeholders Definition
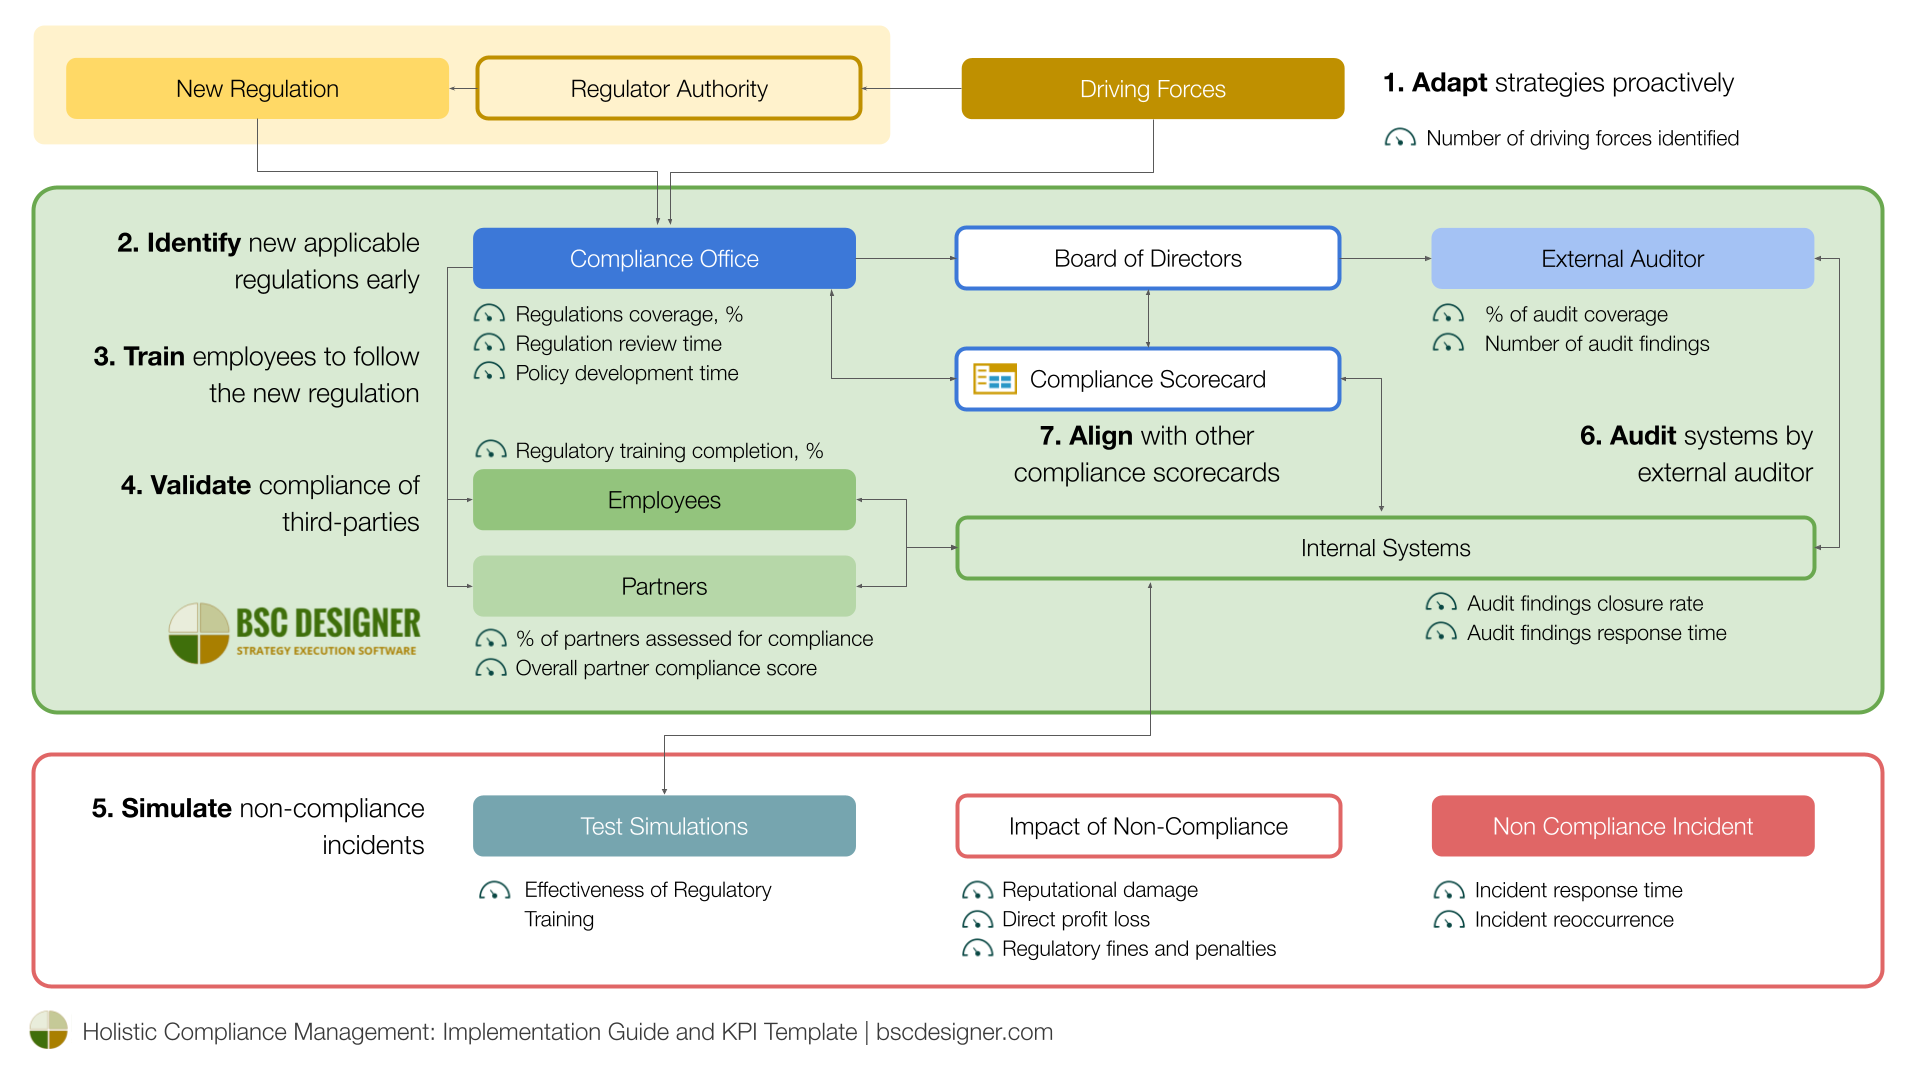
Let’s start with the definition of generic stakeholders involved in compliance:
- Board of Directors. Representing the interests of organizations.
- Compliance Office. A specialized department that ensures compliance of the organization in accordance with applicable laws, regulations, internal policies, etc.
- Internal Business Systems. IT and other business systems that support compliance efforts.
- Employees who can impact or be impacted by compliance policies.
- Third-Parties. Partners and similar external stakeholders.
- External Auditor. An expert in the regulation in question.
- Regulator. Authority that establishes the regulation.
In BSC Designer, navigate to Settings > Strategy > Stakeholders to add relevant stakeholders to the list. Later, those stakeholders can be aligned with specific goals and metrics through the Owner field.
Compliance Template and KPIs
Users of BSC Designer have access to the compliance scorecard template with KPIs discussed in the article:
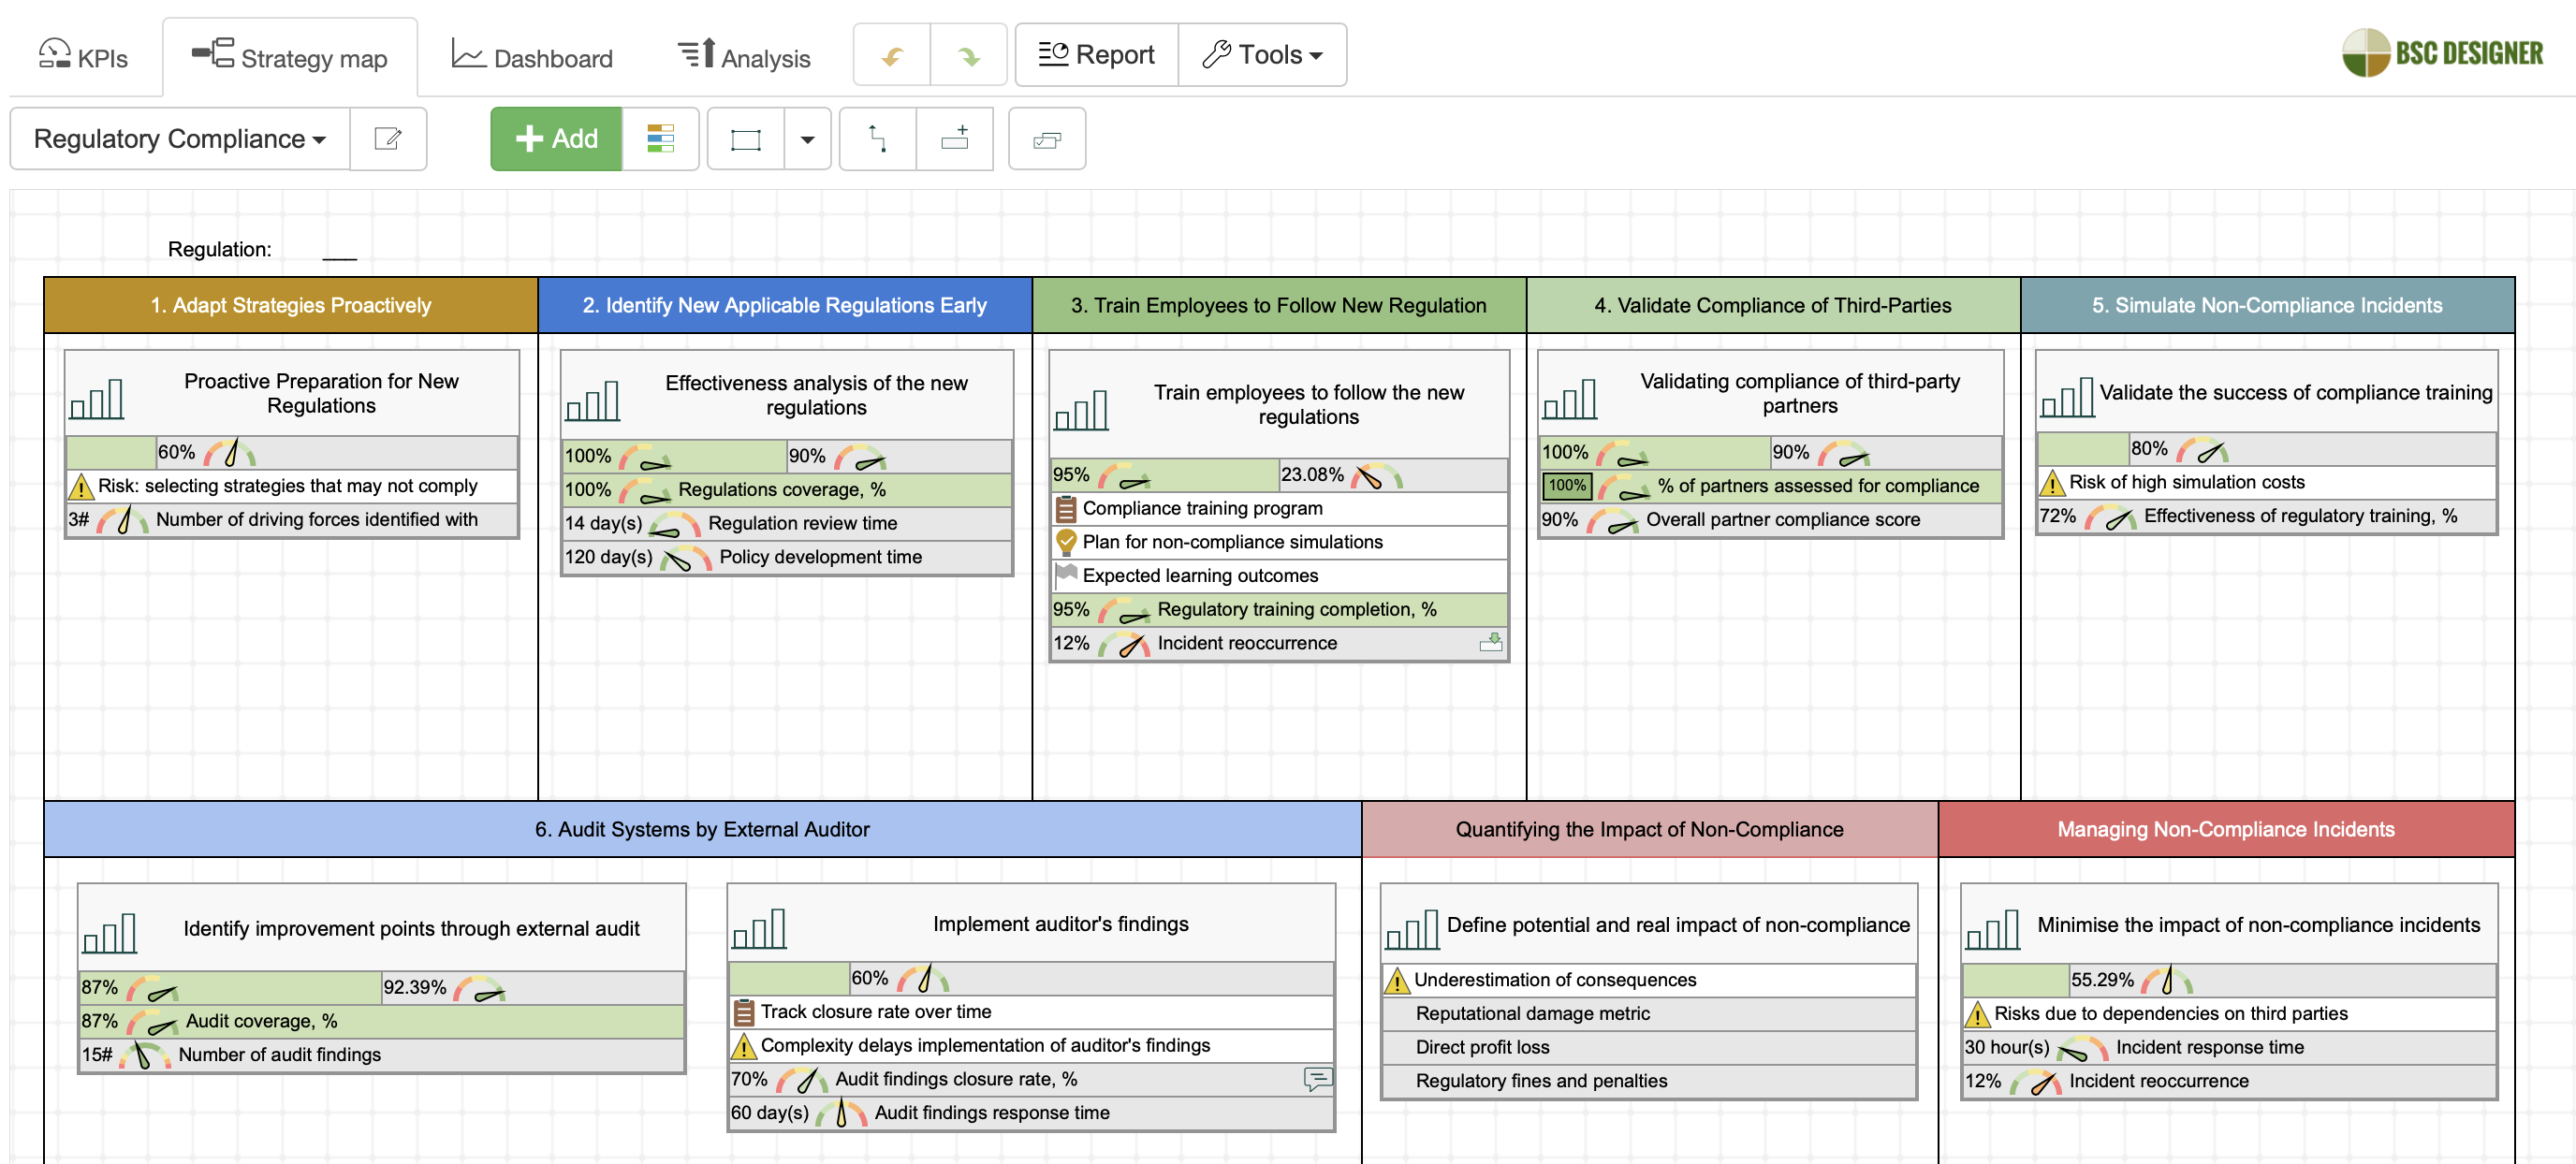
- This template can be customized to match the requirements of the specific regulation.
- The scorecards created for various regulations can later be combined into a comprehensive compliance scorecard featuring an overall compliance index.
1. Adapt Strategies Proactively
Regulatory authorities start formulating new regulations in response to a variety of factors, including social, technological, political, etc. Organizations can proactively prepare strategies for potential regulations by conducting an analysis of external factors, similar to the one conducted by regulatory authorities.
Use the PESTEL analysis template available in BSC Designer to:
- Formulate potential driving forces and
- Define early sign indicators.
To quantify this proactive preparation we can use the indicator:
![]() Number of driving forces identified with regular PESTEL analysis.
Number of driving forces identified with regular PESTEL analysis.
In the template, this metric is configured for annual updates:
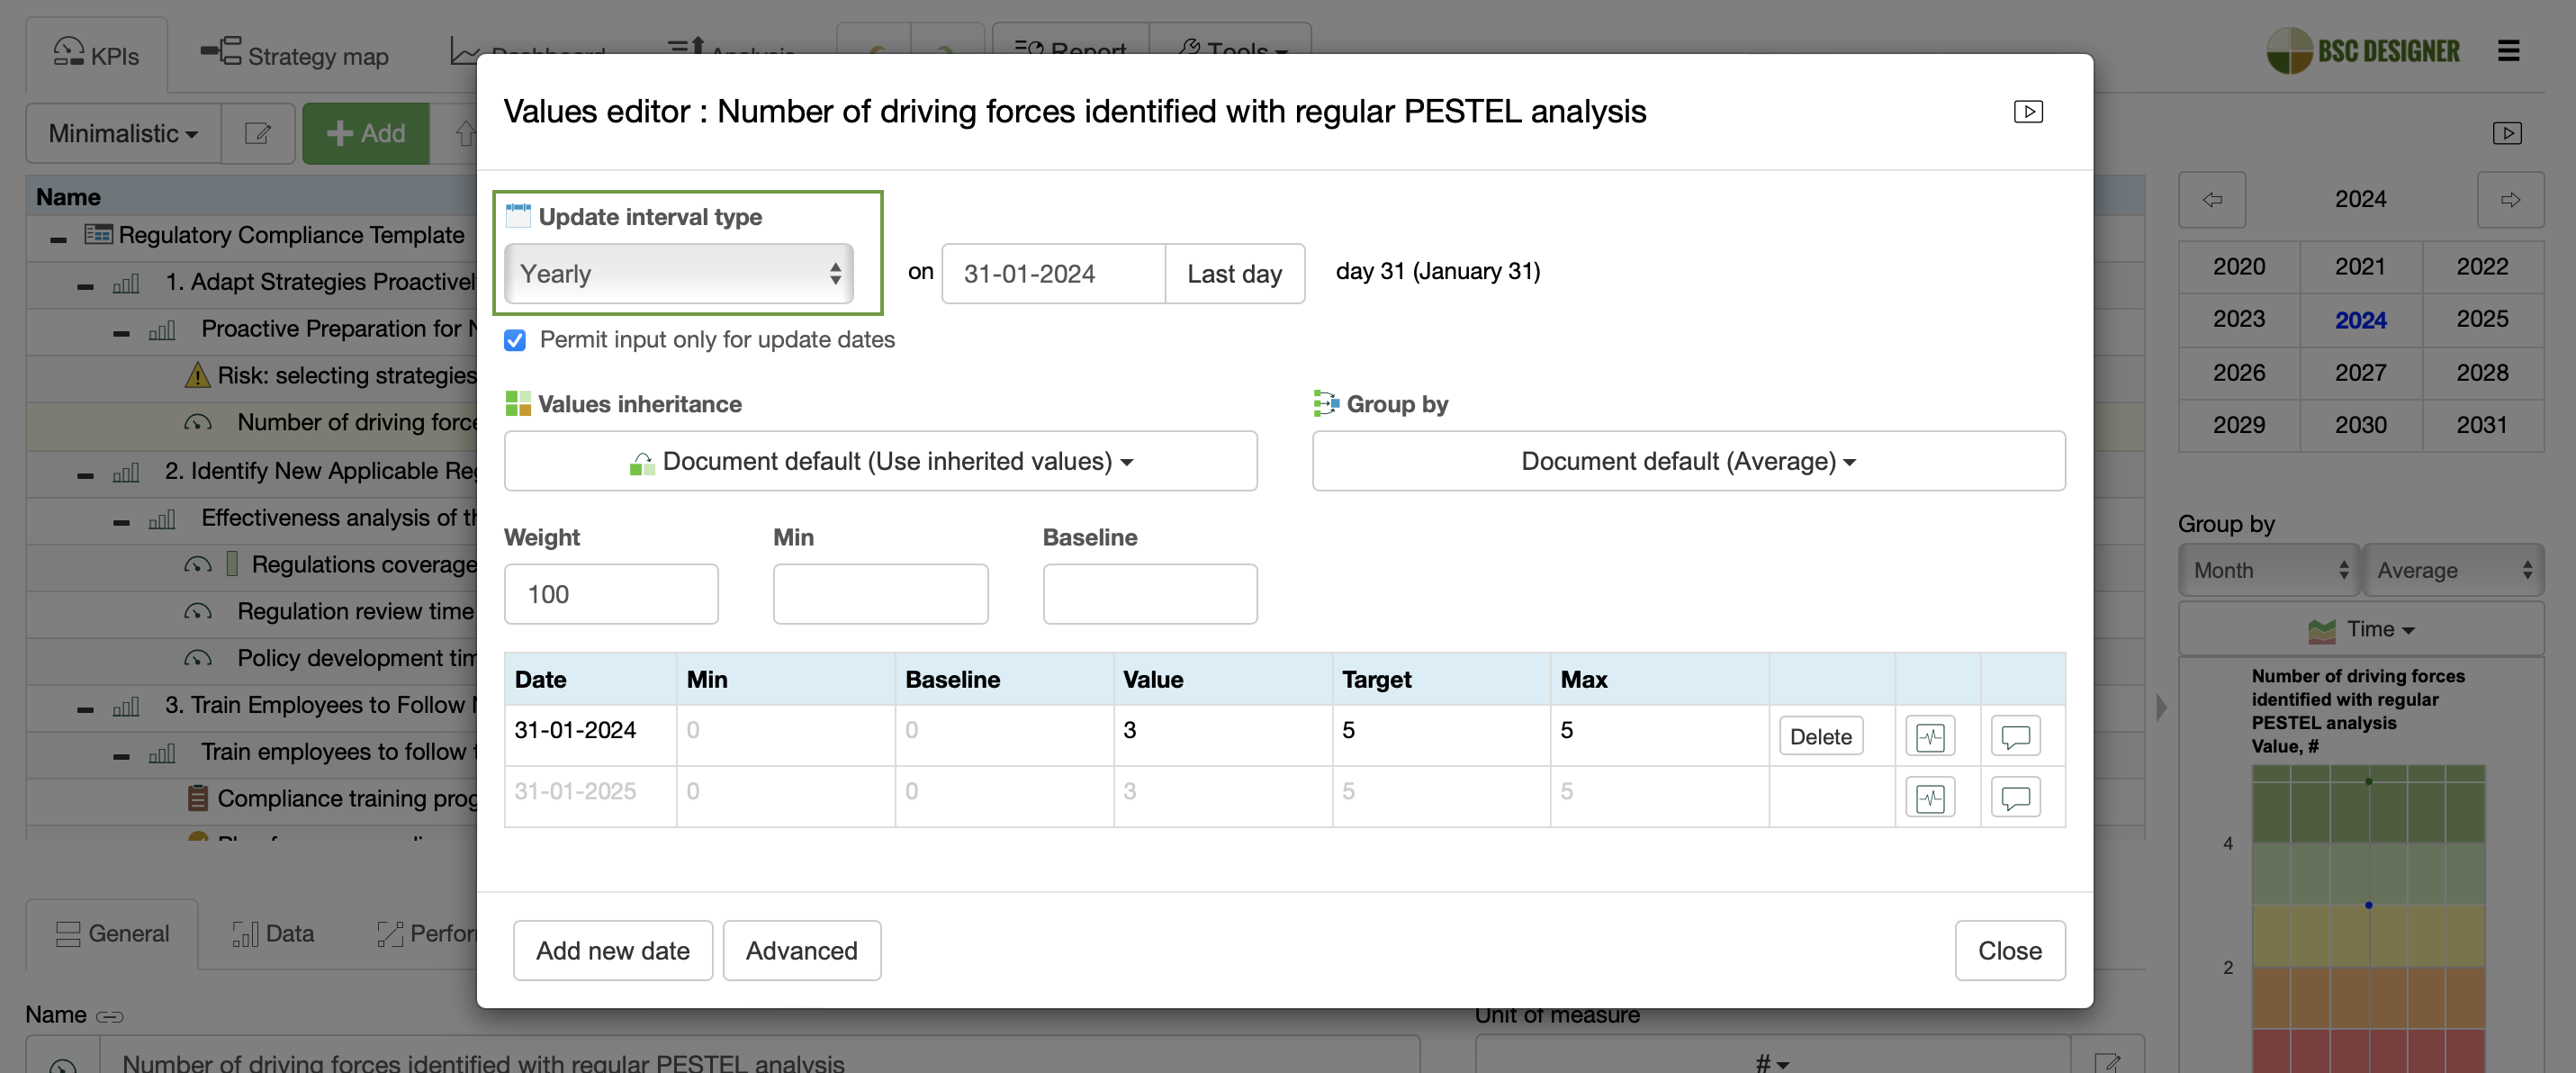
For example, emerging technologies, specifically advancements in AI, are identified as one of the driving forces in PESTEL analysis.
2. Identify New Applicable Regulations Early
The role of the compliance office is to identify new applicable regulations early and start preparation within the organization. Typically, regulators provide sufficient time for analysis and preparation by initially publishing a draft of the regulation, and there is a transition period once the regulation is officially released.
To quantify the efficiency of the compliance office, we use:
![]() Regulations coverage, %. Tracking the percentage of applicable regulations detected by the compliance office at an early stage.
Regulations coverage, %. Tracking the percentage of applicable regulations detected by the compliance office at an early stage.
In the template, the regulation coverage metric has a higher weight in the index, compared to other metrics.
![]() Regulation review time. Average time that it takes from the initial publication of the regulation until the development of the preparation plan.
Regulation review time. Average time that it takes from the initial publication of the regulation until the development of the preparation plan.
![]() Policy development time. Average time it takes to develop internal guiding policies and relevant educational materials.
Policy development time. Average time it takes to develop internal guiding policies and relevant educational materials.
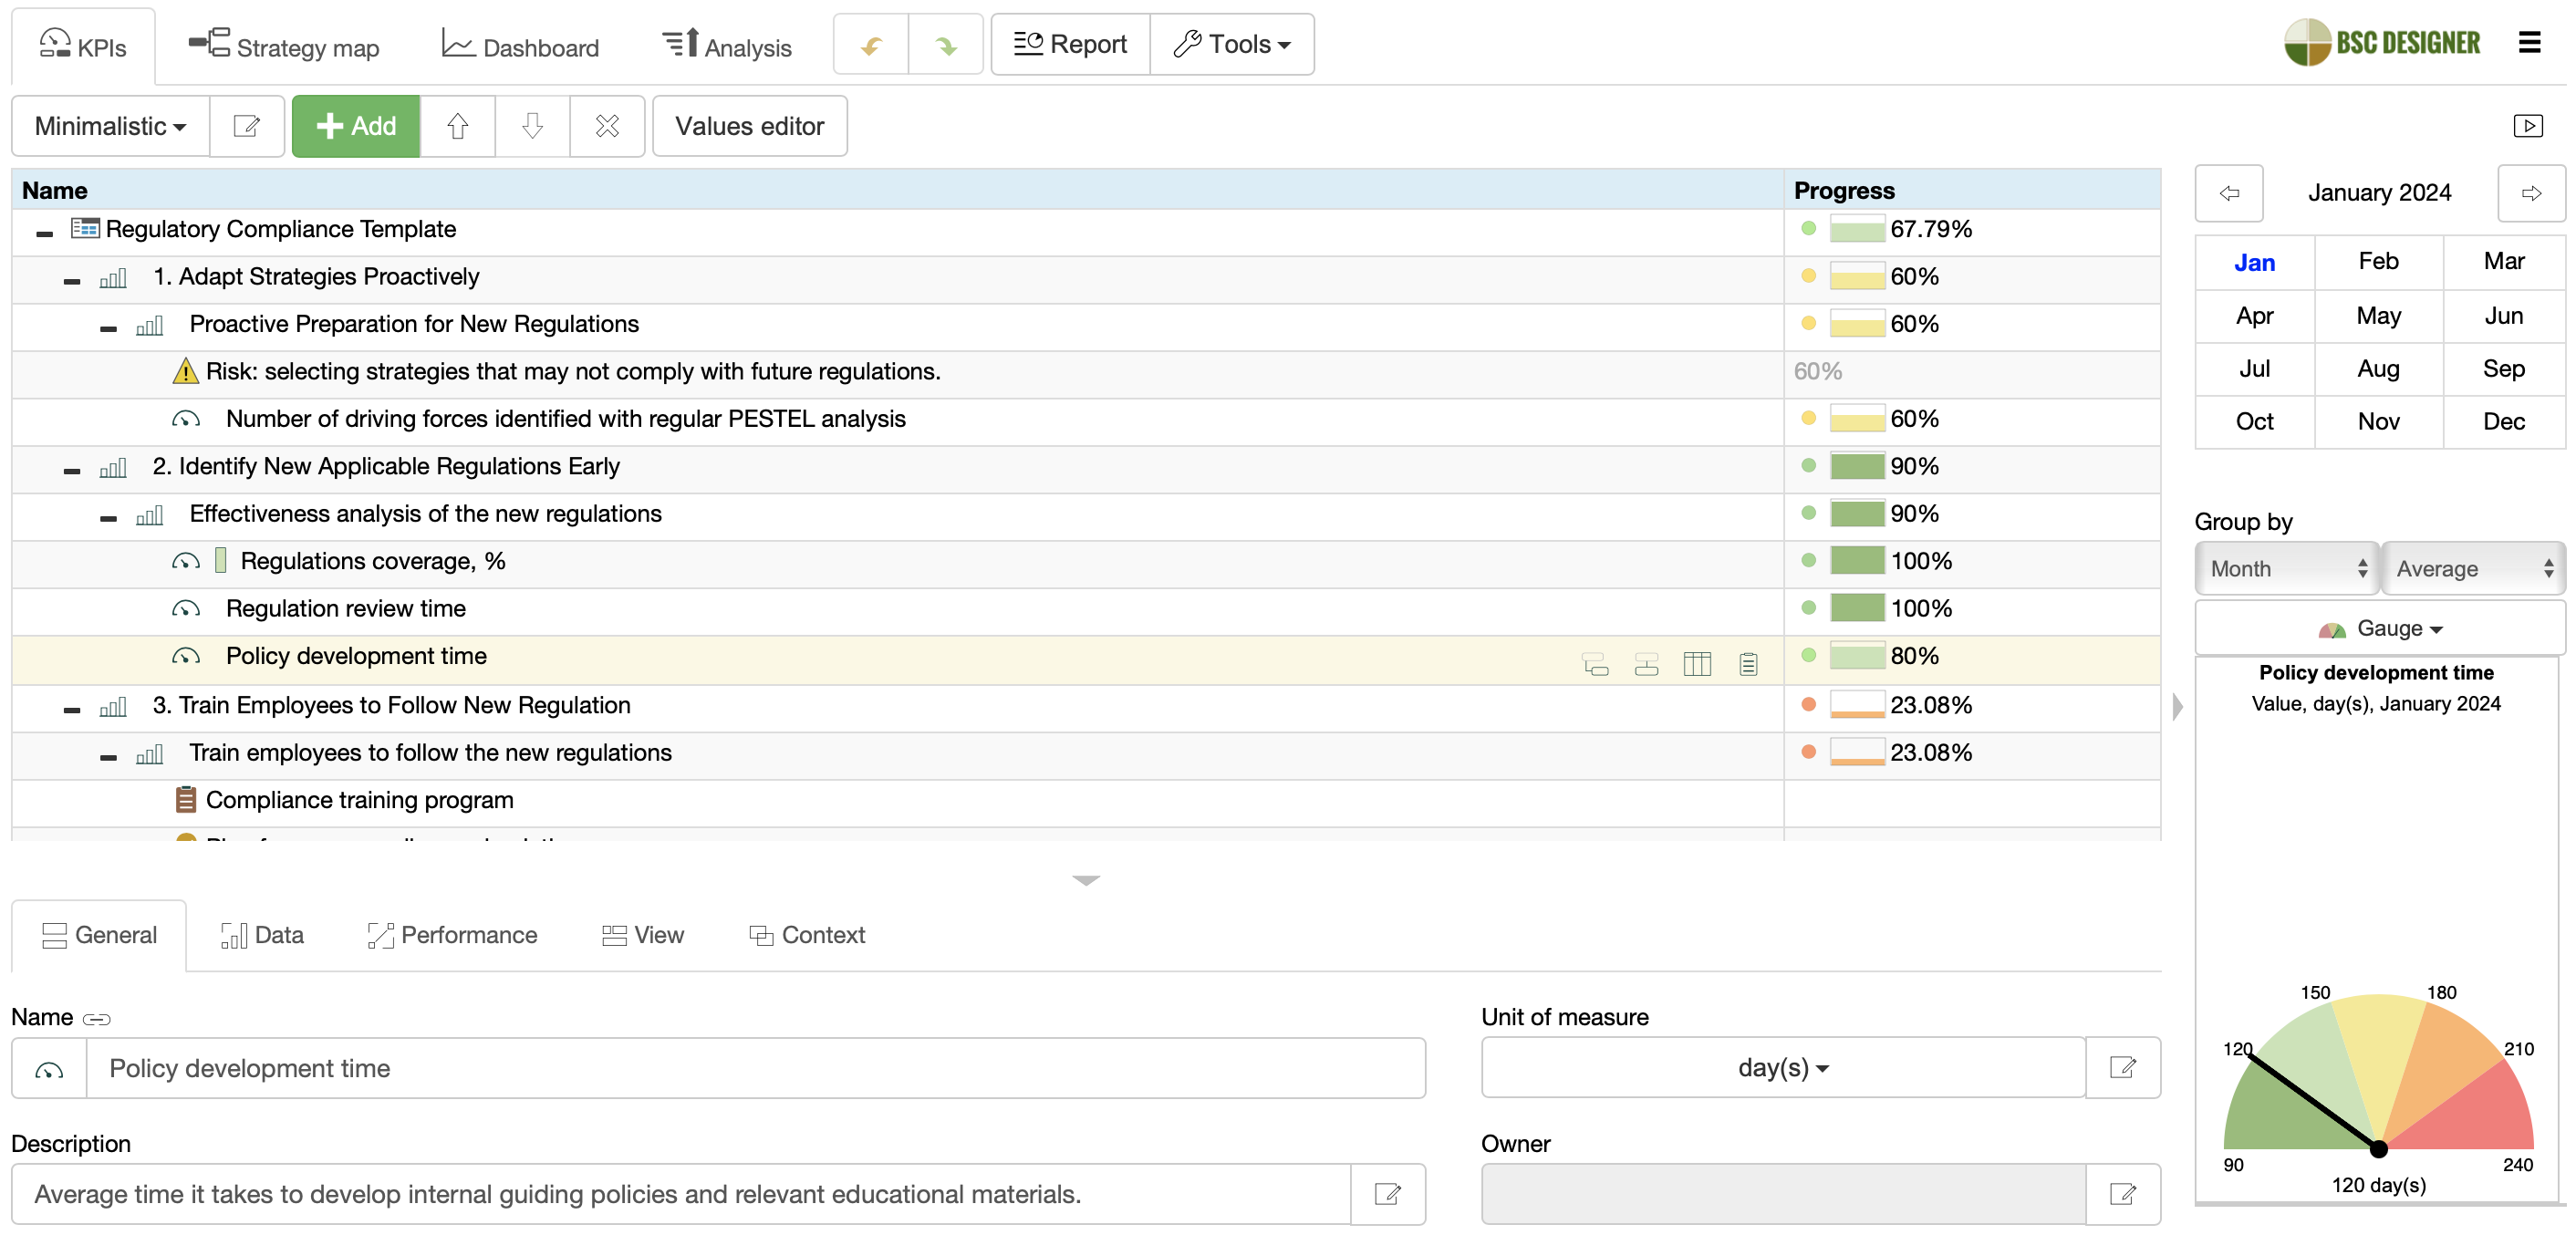
Estimations for the time metrics might be used as criteria to determine whether the work on specific regulations should be conducted in-house or outsourced to a third-party advisory firm.
For instance, many regulatory bodies release and update AI-related policies. Using the mentioned metrics, we can ensure these policies are properly examined within the context of a specific organization and translated into guiding procedures.
3. Train Employees to Follow New Regulation
Once corresponding policies are formulated, the organization needs to train its employees to follow the new regulations. To track the process, we use a basic metric:
![]() Regulatory training completion. Might include basic awareness about new regulation or detailed modeling of compliance and non-compliance scenarios.
Regulatory training completion. Might include basic awareness about new regulation or detailed modeling of compliance and non-compliance scenarios.
For more complex regulations, consider employing a dedicated training scorecard to track the process.
4. Validate Compliance of Third-Parties
Most regulations require looking along the value chain and validating compliance of third-parties. The organization might not be interested in looking into the details; instead, it can focus on tracking the overall compliance score of partners and the percentage of partners assessed for compliance.
![]() % of partners assessed for compliance.
% of partners assessed for compliance.
![]() Overall partner compliance score (see for example, vendor risk management scorecard).
Overall partner compliance score (see for example, vendor risk management scorecard).
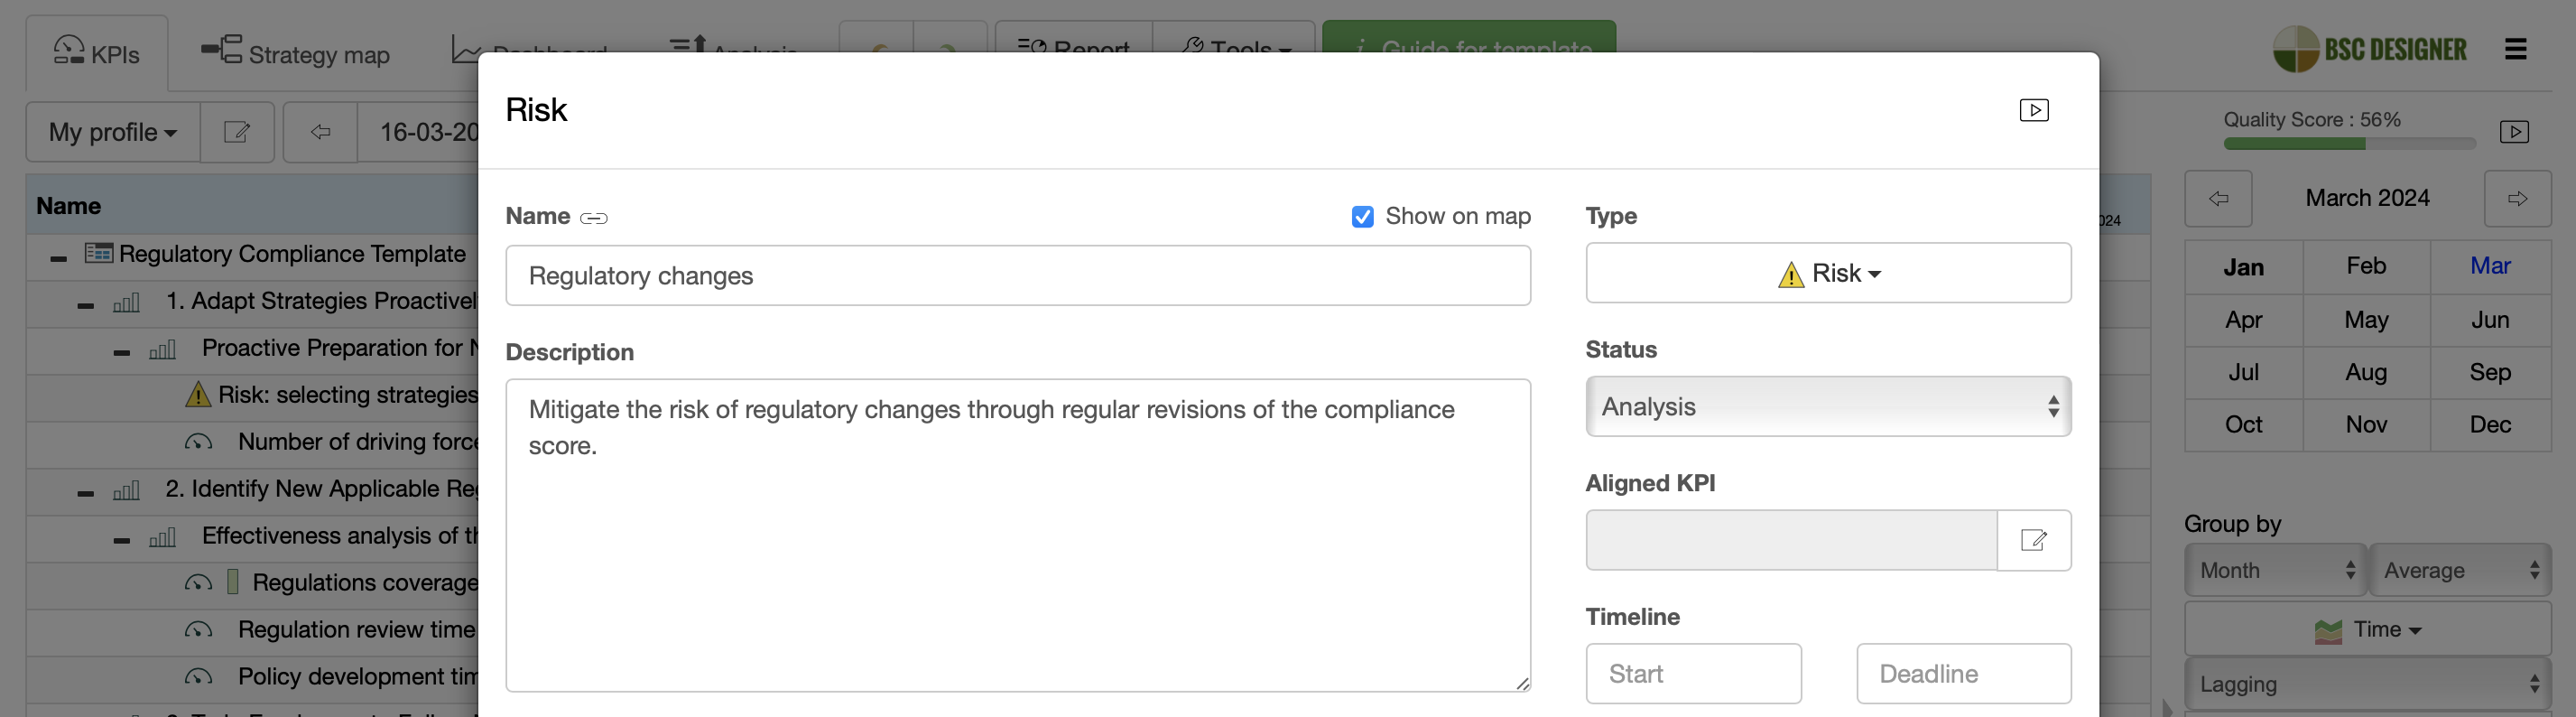
![]() Risk identification and mitigation is critical for long-term success of compliance. In this case, a risk was identified as “Changes in regulation” with mitigation plan:
Risk identification and mitigation is critical for long-term success of compliance. In this case, a risk was identified as “Changes in regulation” with mitigation plan:
- “Mitigate the impact of regulatory changes on third parties that have already passed the compliance check through regular reviews and revisions of the compliance score.”
5. Simulate Non-Compliance Incidents
To validate the success of compliance training, the organization can simulate non-compliance incidents and assess the appropriate reactions of the responsible employees. The results of such validation can be quantified as:
![]() Effectiveness of regulatory training, as validated by non-compliance simulations.
Effectiveness of regulatory training, as validated by non-compliance simulations.
Quantifying the Impact of Non-Compliance
The impact of non-compliance can be validated using:
![]() Reputational damage metric – can be quantified by the duration of negative media coverage.
Reputational damage metric – can be quantified by the duration of negative media coverage.
![]() Direct profit loss.
Direct profit loss.
![]() Regulatory fines and penalties.
Regulatory fines and penalties.
Their dynamic over time will indicate the effectiveness of the compliance efforts introduced. While all these metrics are lagging in their nature, the compliance office can use the risks associated with these metrics to prioritize certain activities and justify compliance budgets.
6. Audit Systems by External Auditor
In cases involving critical regulations, where potential non-compliance could lead to significant economic and reputational consequences, the board of directors engages independent auditors.
The metrics to focus on in the context of an external auditor:
![]() Audit coverage, %. We are interested in a comprehensive audit of all relevant functions of the organization to make sure the maximum possible compliance risks were detected at an early stage.
Audit coverage, %. We are interested in a comprehensive audit of all relevant functions of the organization to make sure the maximum possible compliance risks were detected at an early stage.
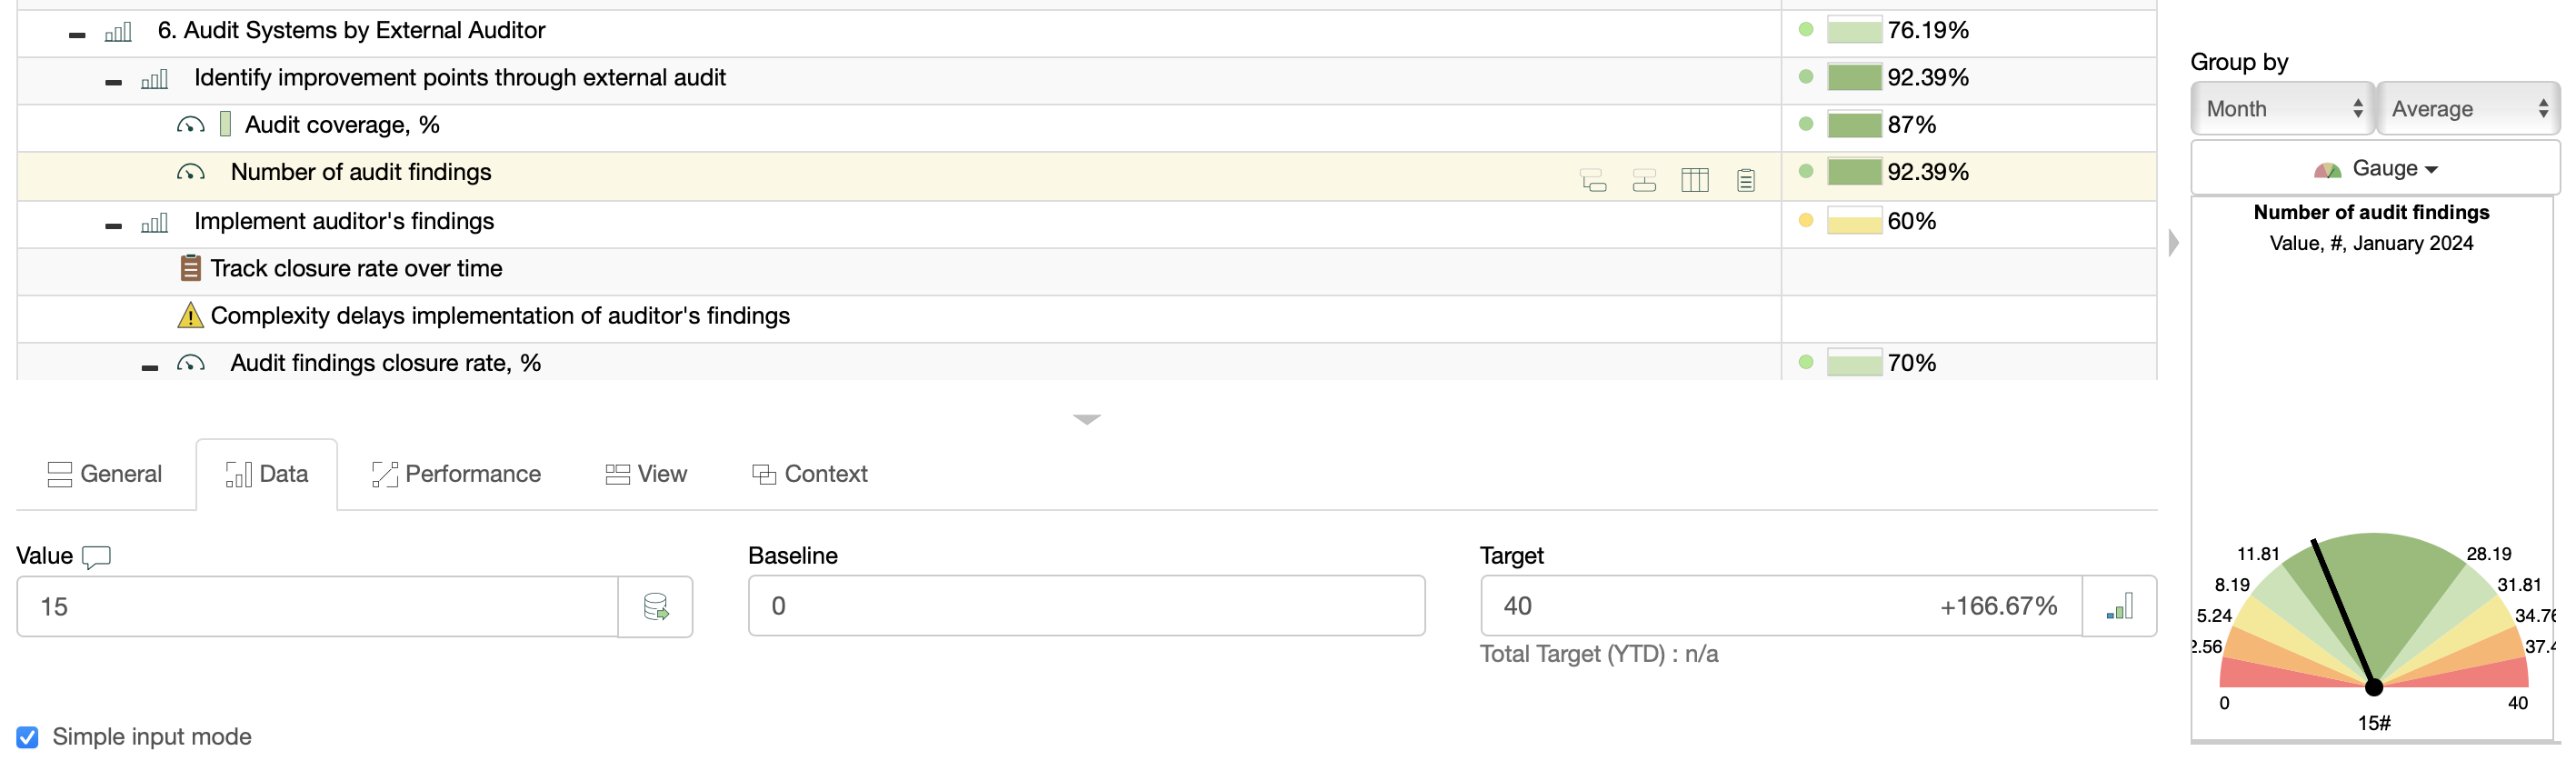
![]() Number of audit findings. Besides its direct application, this metric can be used to validate the effectiveness of the compliance office in the analysis and implementation of the requirements of the regulation.
Number of audit findings. Besides its direct application, this metric can be used to validate the effectiveness of the compliance office in the analysis and implementation of the requirements of the regulation.
For repetitive actions like external audits, it is advisable to track metrics over time. Users of BSC Designer can establish update intervals for the metrics to ensure data consistency.
Another nuance regarding this type of metric is the difficulty to establish a target. For instance, a small number of audit findings might be seen as insufficient attention from the auditor, while a high level of findings may indicate that the compliance office did not conduct an effective internal audit. To capture this idea, the performance function of the indicator was modified.
Additionally, all the findings can be categorised according to their impact, giving the highest weight to the most critical findings. This will help avoid misusing the metric by focusing on a large number of low-value findings. An example of such categorisation is weighted risk index in the cybersecurity scorecard.
Some indication of the effectiveness of implementing the auditor’s findings can be quantified by:
![]() Audit findings closure rate. While the obvious target for this metric is 100%, there might be time and resource constraints that prevent implementing all the recommendations of the auditor right away.
Audit findings closure rate. While the obvious target for this metric is 100%, there might be time and resource constraints that prevent implementing all the recommendations of the auditor right away.
![]() Audit findings response time. Another view on fixing noncompliance vulnerabilities detected by the audit, we are looking at the time needed to close the issue from its detection.
Audit findings response time. Another view on fixing noncompliance vulnerabilities detected by the audit, we are looking at the time needed to close the issue from its detection.
Users of BSC Designer can update the indicators with the latest data and include a note on the most recent update. For instance, they can provide additional details explaining why, at a certain stage, it may not be possible to close some of the audit findings.
Both closure rate and response time are leading metrics for the improvement of the compliance systems, focusing on making the whole process more agile and less complex for the end-user stakeholders.
Managing Non-Compliance Incidents
Proper preparations by the internal compliance office and external audits don’t assure the organization against possible compliance breaches.
Metrics to track in this context:
![]() Incident response time. To ensure compliance breaches are resolved fast to minimize the impact on the organization.
Incident response time. To ensure compliance breaches are resolved fast to minimize the impact on the organization.
![]() Incident reoccurrence. Preventing the reoccurrence of incidents of the same type is an indicator of how well an organization is learning from mistakes.
Incident reoccurrence. Preventing the reoccurrence of incidents of the same type is an indicator of how well an organization is learning from mistakes.
The measurement unit for the response time metric might be hours or days, depending on the nature of the incident.
Following the logic that the reoccurrence of incidents is an indicator of the effectiveness of the compliance office, the “Incident Reoccurrence” indicator was aligned with the goal ‘Train employees to follow the new regulations’ by data as a lagging indicator.
7. Align Compliance Scorecards
The discussed metrics will be specific for a certain regulation. For each regulation, there will be its own compliance scorecard featuring the metrics adjusted for that specific regulation.
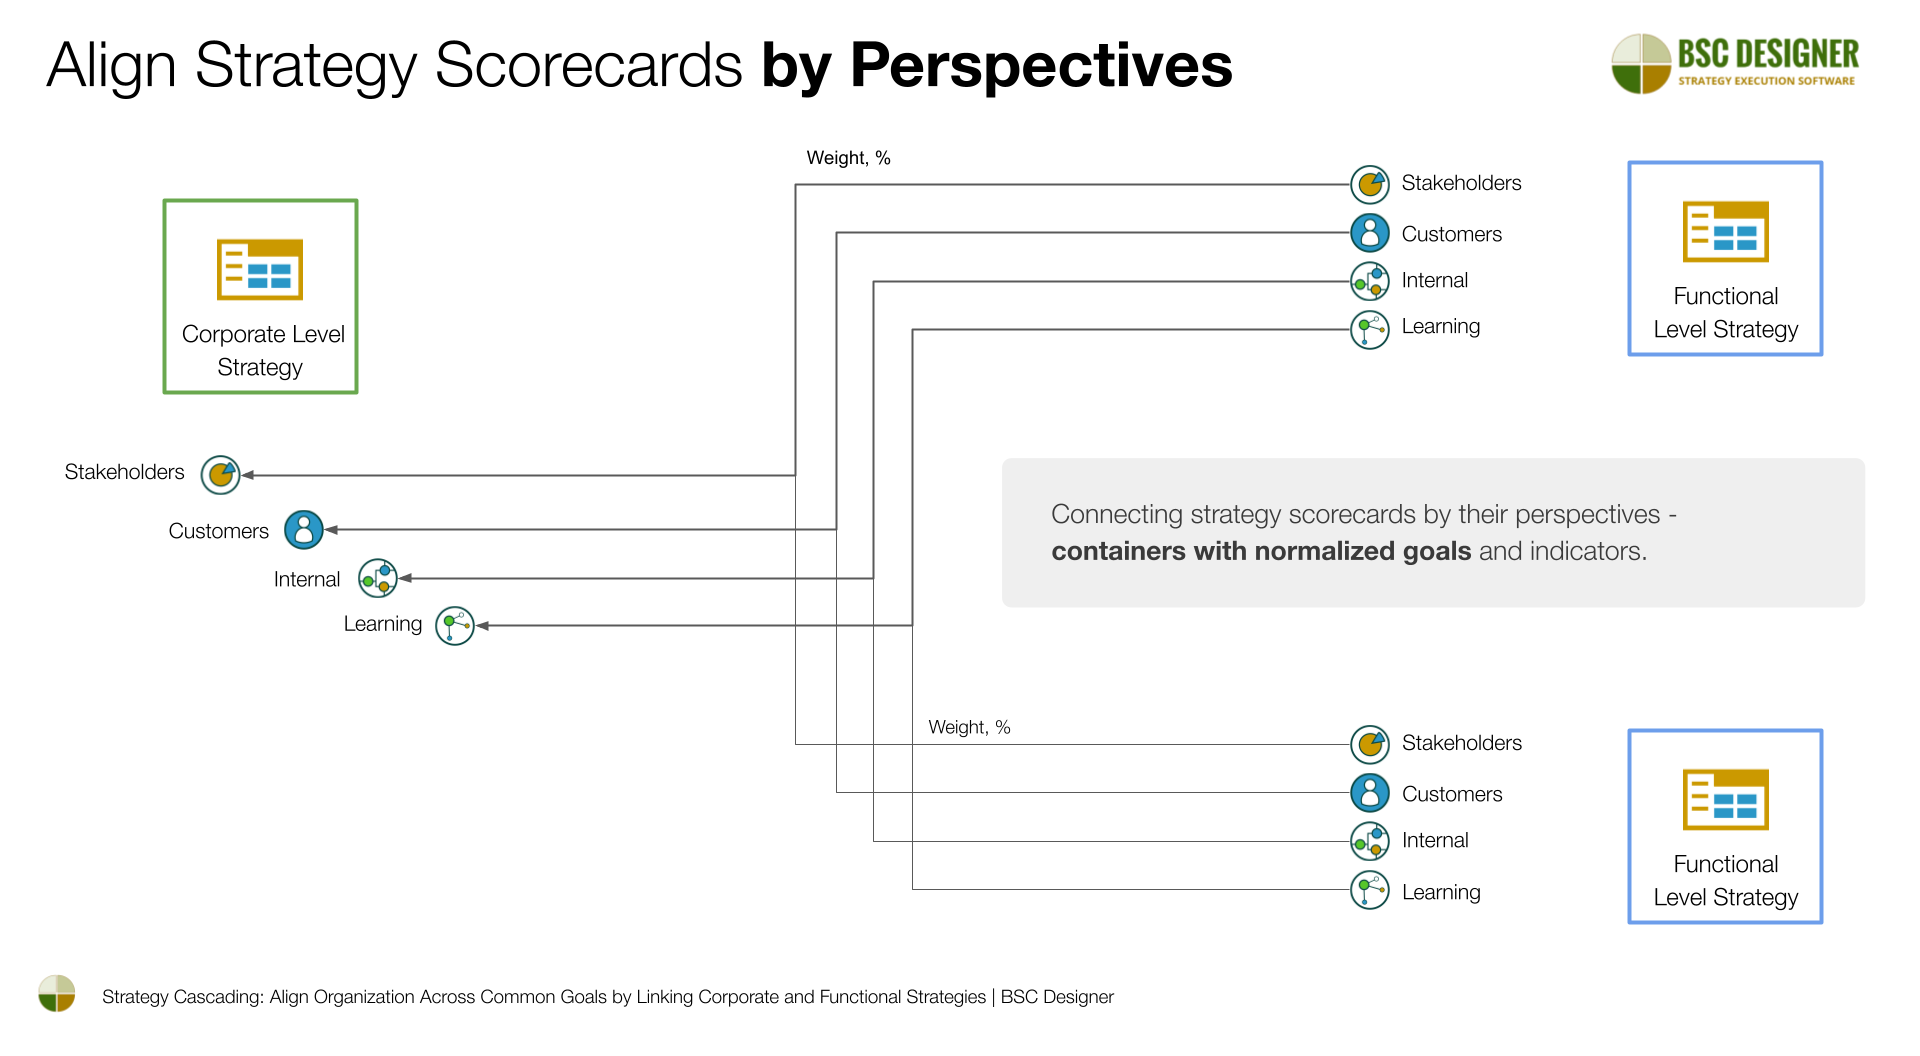
To have a high-level picture of the GRC (Governance, Risk, and Compliance) efforts, we can align the GRC scorecards for specific regulations into an overall GRC scorecard.
What's next?- Follow our
 Strategy Implementation System to align stakeholders, strategic ambitions, and business frameworks into a comprehensive strategy.
 - Automate strategic planning with BSC Designer by organizing goals, initiatives, risks, and KPIs into scorecards.
More About Strategic Planning


![]() CEO | Author | Speaker
CEO | Author | Speaker
BSC Designer is strategy execution software that enhances strategy formulation and execution through tangible KPIs. Our proprietary strategy implementation system reflects our practical experience in the strategy domain.