Start with analysis of the trends, define diversification strategies, quantify and compare alternatives to find the most promising growth directions.
The content of the article:
- History of the Ansoff Matrix, its modern 2×2 and 3×3 extended versions
- Rationale and general principles of selecting business growth alternatives
- Three steps to plan growth strategy with the Ansoff Matrix
- Example of using the Ansoff Matrix
History of The Ansoff Matrix
In 1957, Igor Ansoff applied mathematician by education, manager in the Corporate Planning Department of Lockheed, published in Harvard Business Review the article titled “Strategies for diversification”1. He argued that business growth and diversification are imperative factors of business survival and suggested a quantitative approach for selecting viable growth strategies.
The “Exhibit 1: Product-Market Strategies for Business Growth Alternatives” was later popularized under the name “The Ansoff Matrix.” The original diagram, however, was not exactly the Ansoff Matrix we see today.
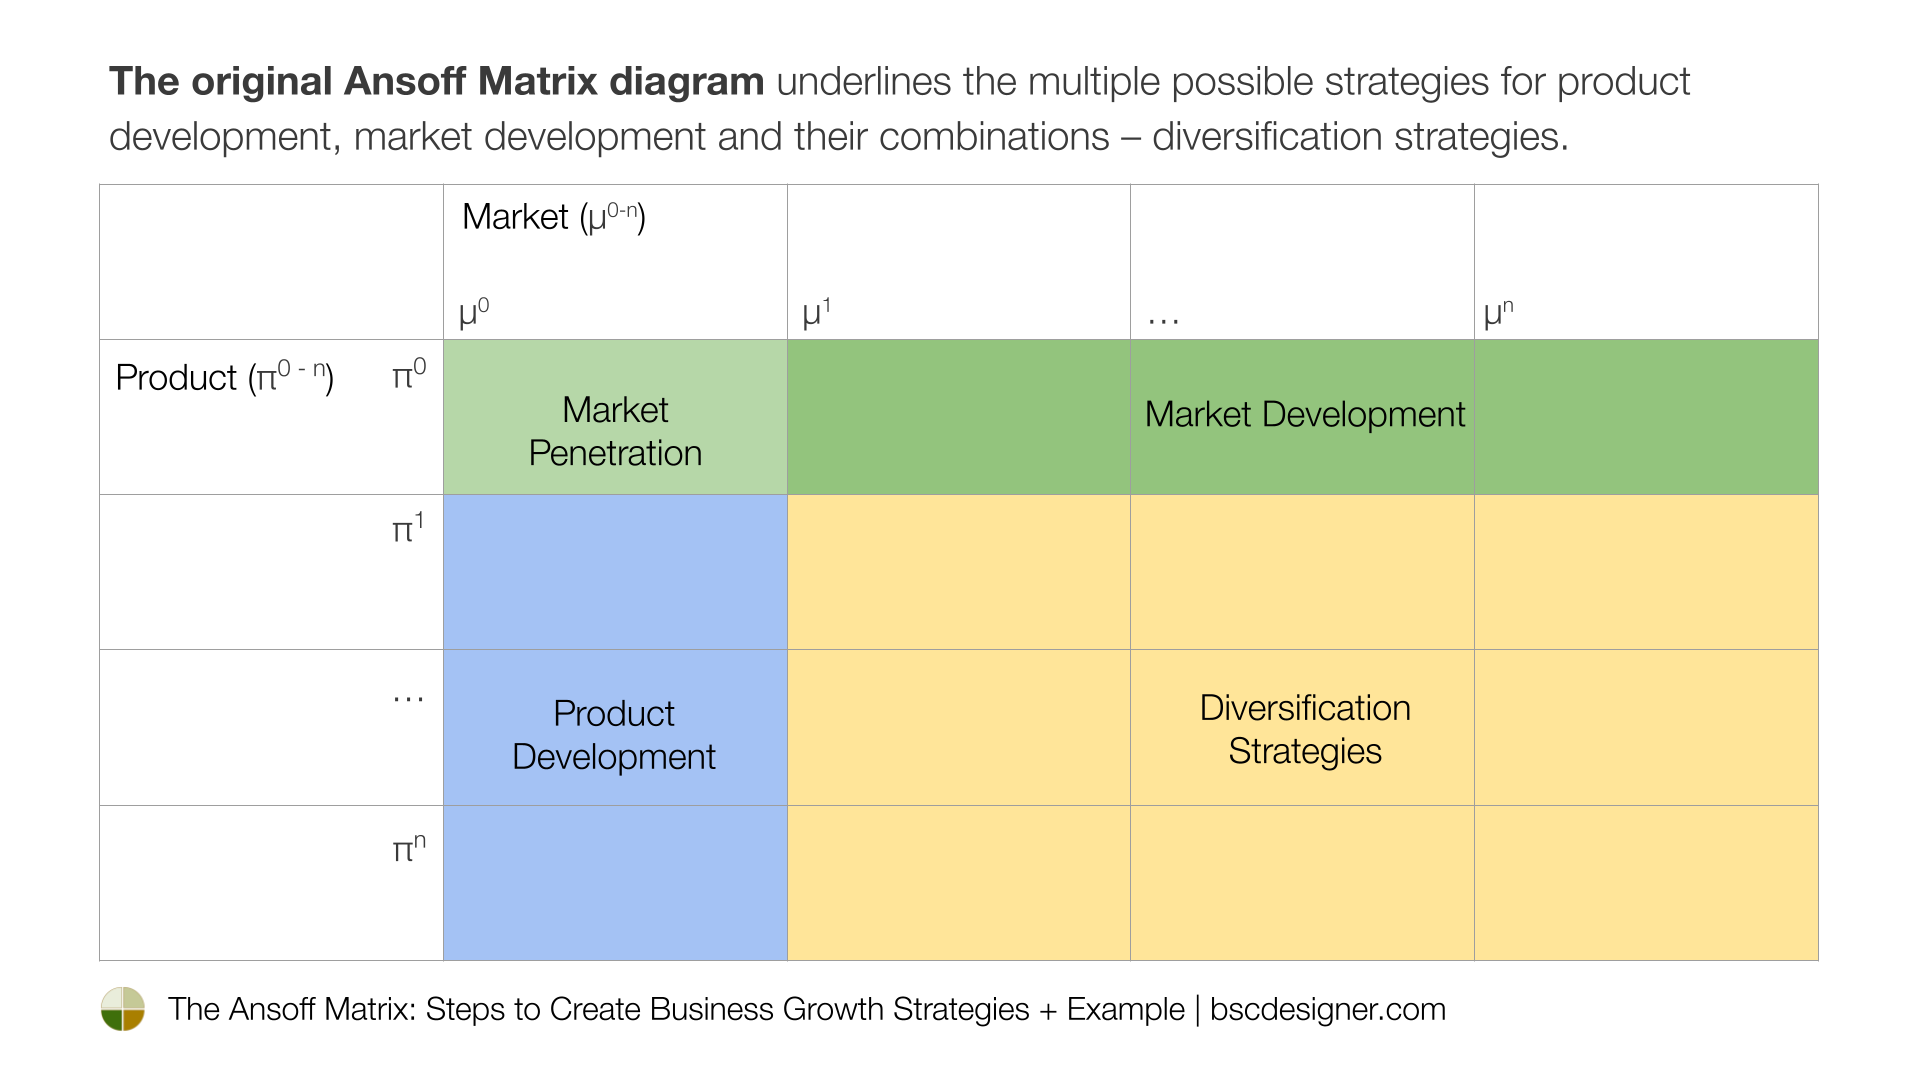
It was a diagram with:
- “Product line” column, where product was defined as π0…πn
- “Markets” row, where set of missions were defined as μ0…μn
In its original version, it was not a 2×2 matrix:
- The sector π0 / μ0 corresponded to the “Market penetration” strategy
- The row π0 to market development strategies
- The column μ0 to product development strategies
- The rest of the diagram, e.g., sectors defined as {π1…πn, μ1…μn} were reserved for diversification strategies
In the modern version of the Matrix, the n=1, meaning that we have a 2×2 matrix with the sectors:
- Market Penetration
- Market Development
- Product Development
- Diversification
The Extended Ansoff Matrix is a compromise between the original and modern formats. In this case, n=2 and respectively, the final matrix is 3×3 with additional strategies in the middle:
- Market expansion
- Product modification
- Limited diversification
General Principles of the Ansoff Matrix
The Ansoff Matrix is one of the powerful tools for strategic planning2. Let’s explore the reasoning and general principles behind it as they were explained in the original article.
Principle 1. Growth is Imperative
A key theme of the article was:
Growth of business is imperative for its long-term survival and success.
It was stressed from the very beginning with the quote of another mathematician, Lewis J. Carroll (the Red Queen’s race incident):
“It takes all the running you can do to keep in the same place. If you want to get somewhere else, you must run at least twice as fast as that!”
For a case poetic analogy was not enough, the conclusions of the survey of the largest US corporations from 1909 to 19483 supported empirically the idea of diversification (as a derivative of innovation and competition) as a long-term survival factor:
“There is no reason to believe that those now at the top will stay there except as they keep abreast in the race of innovation and competition.”
For me, as an applied mathematician by formal education, it’s interesting to see that the conclusions of the report that Ansoff cited were formulated as required by not sufficient conditions. Reasonably, the prediction formulated in that way resulted to be more accurate than predictions formulated as success factors by Jim Collins in “Built to Last.”4 5
Principle 2. Existence of Multiple Strategies
A modern version of the Ansoff Matrix has a one “product development” quadrant. We can mistakenly conclude that a company should focus on a one product development strategy.
The original diagram underlines the multiple possible strategies for product development, market development and, respectively, their combinations – diversification strategies.
Principle 3. Simultaneous Execution of Strategies
Another idea underlined by Ansoff is that the final selection of strategies can and should be executed simultaneously.
He stressed this idea several times in the article, even formulating it as one of the criteria of a well-run business:
“Simultaneous pursuit of market penetration, market development, and product development is a sign of a progressive, well-run business.”
Principle 4. Compare Strategies Quantitatively
Ansoff shared some mathematical models to quantitatively estimate and compare the alternative growth strategies. The suggested models used projections of expected increase of stability and growth rate as a result of strategy implementation.
The estimation is supposed to be made in relative numbers, limiting to the aim of comparing alternative strategies, not finding absolute dollar value of the diversification.
Principle 5. Plan for Unforeseeable Events. Distribute Risk.
The rationale behind Ansoff Matrix overlaps with the reasoning of scenario planning. Ansoff invites companies to plan for “contingencies” and “unforeseeable events” using the diversification strategies as prevention tools.
On some modern versions of the Ansoff Matrix, the diversification quadrant is marked as “high risk.” In the short term, this is correct as the company faces two unknowns at once – the new product and the new market.
In the long term, and that’s why Ansoff suggests companies start developing diversification strategies, it’s one of the ways to distribute risks and minimize overall risk in a sense of business long-term survival.
The risk of the failed diversification strategies is not specifically analyzed in the article. To have a complete picture, it is worth balancing the ideas of the Ansoff matrix with analysis of competition and strategic assets6 of company.
3 Steps to Plan Growth Strategies with the Ansoff Matrix
The process to develop growth strategies using the Ansoff Matrix by BSC Designer includes three steps.
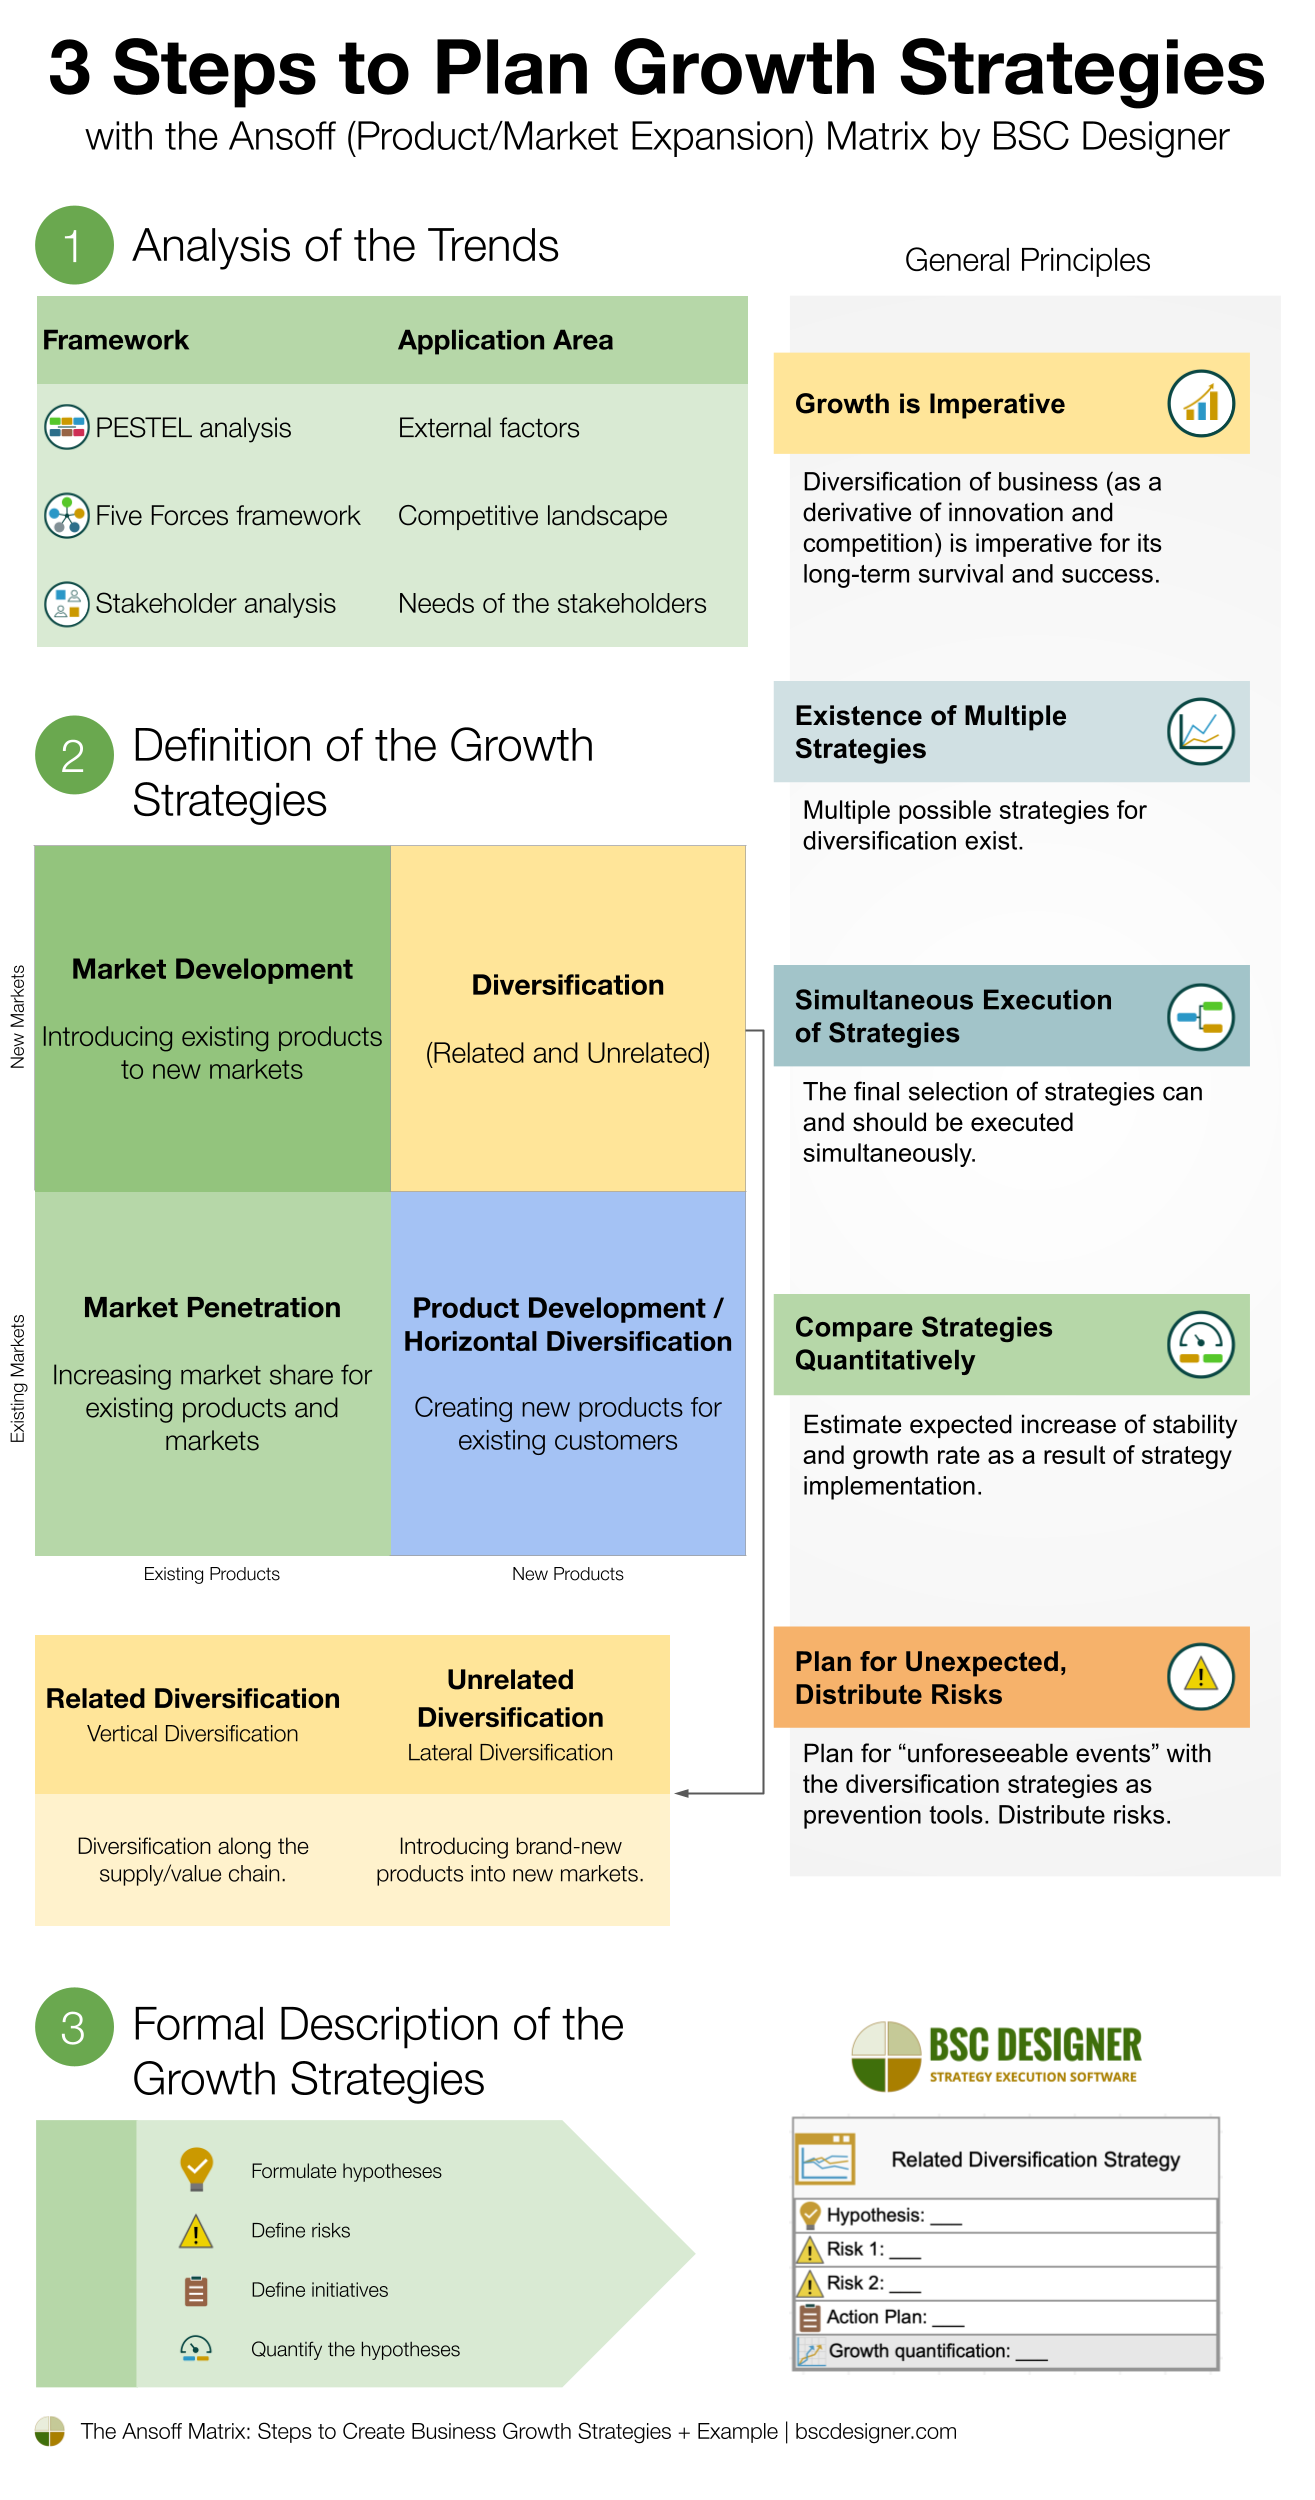
Step 1. Analysis of the Trends
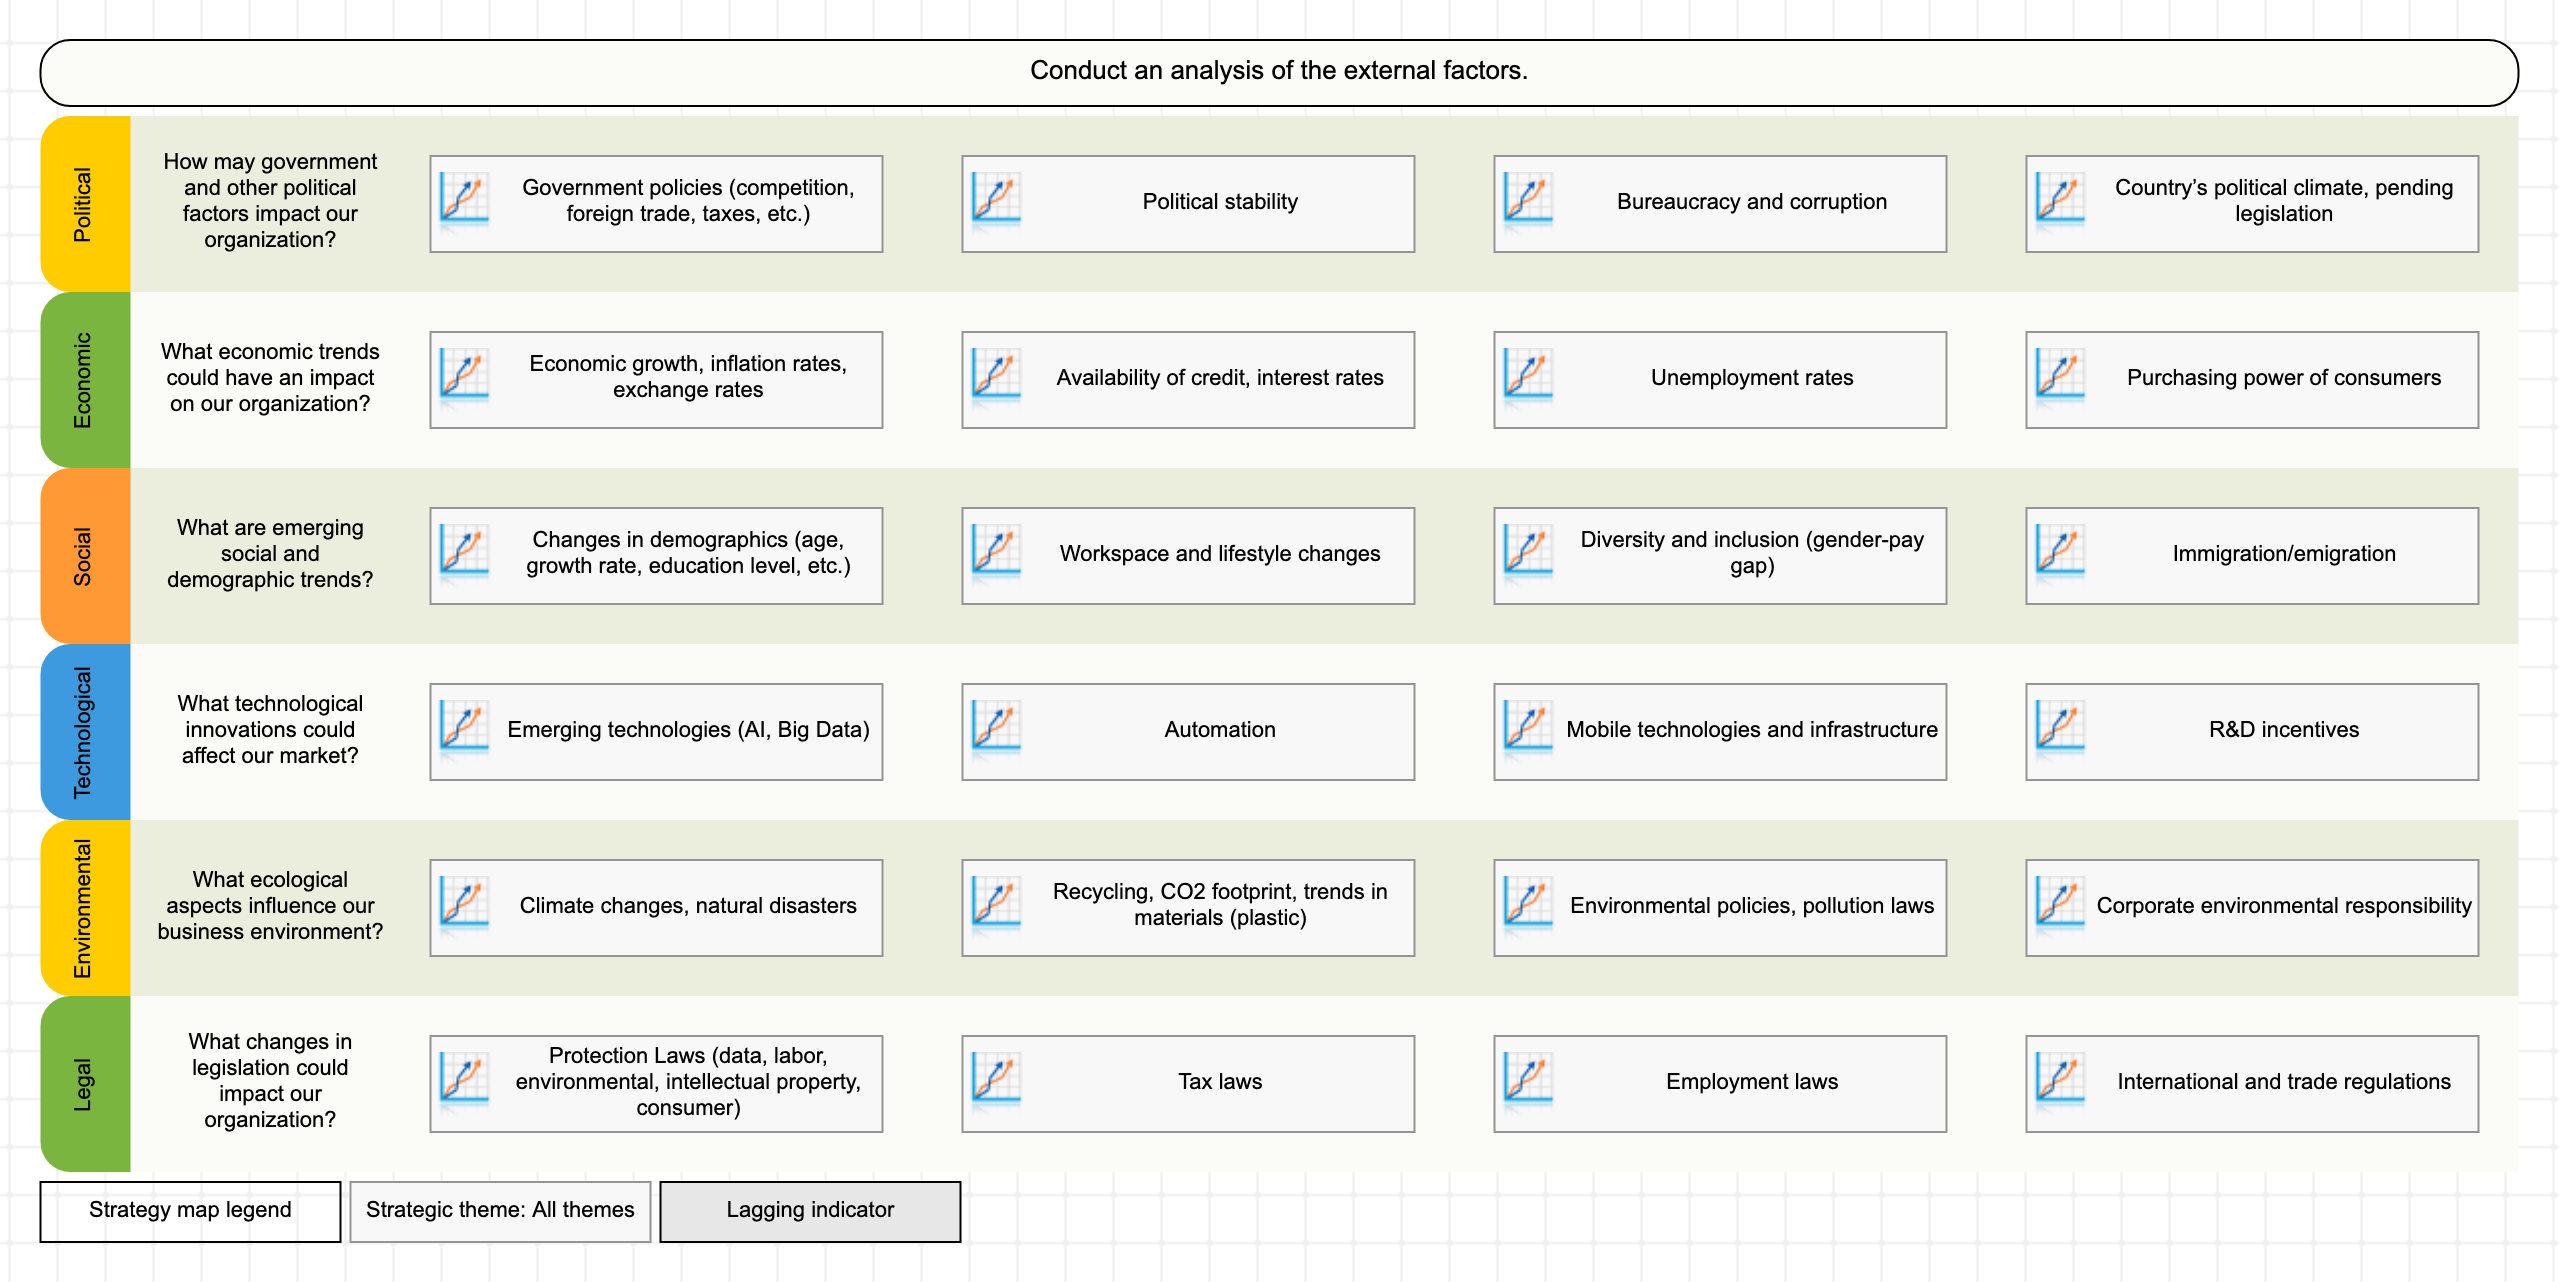
A company needs to create a comprehensive picture of business and competitive landscape. Recommended tools:
Users of BSC Designer will find the PESTEL and Five Forces templates available in their account (see New > New scorecard > More templates…)
Step 2. Definition of the Growth and Diversification Strategies
Depending on the trends detected in Step 1, a company can define one or several diversification strategies:
- Market Penetration – increasing market share for existing products and markets
- Market Development – introducing existing products to new markets
- Product Development or Horizontal diversification – creating new products for existing customers
- Vertical Diversification (related diversification strategy) – diversification along the supply/value chain, introducing new products into new markets
- Lateral Diversification (unrelated diversification strategy) – introducing brand-new products into new markets
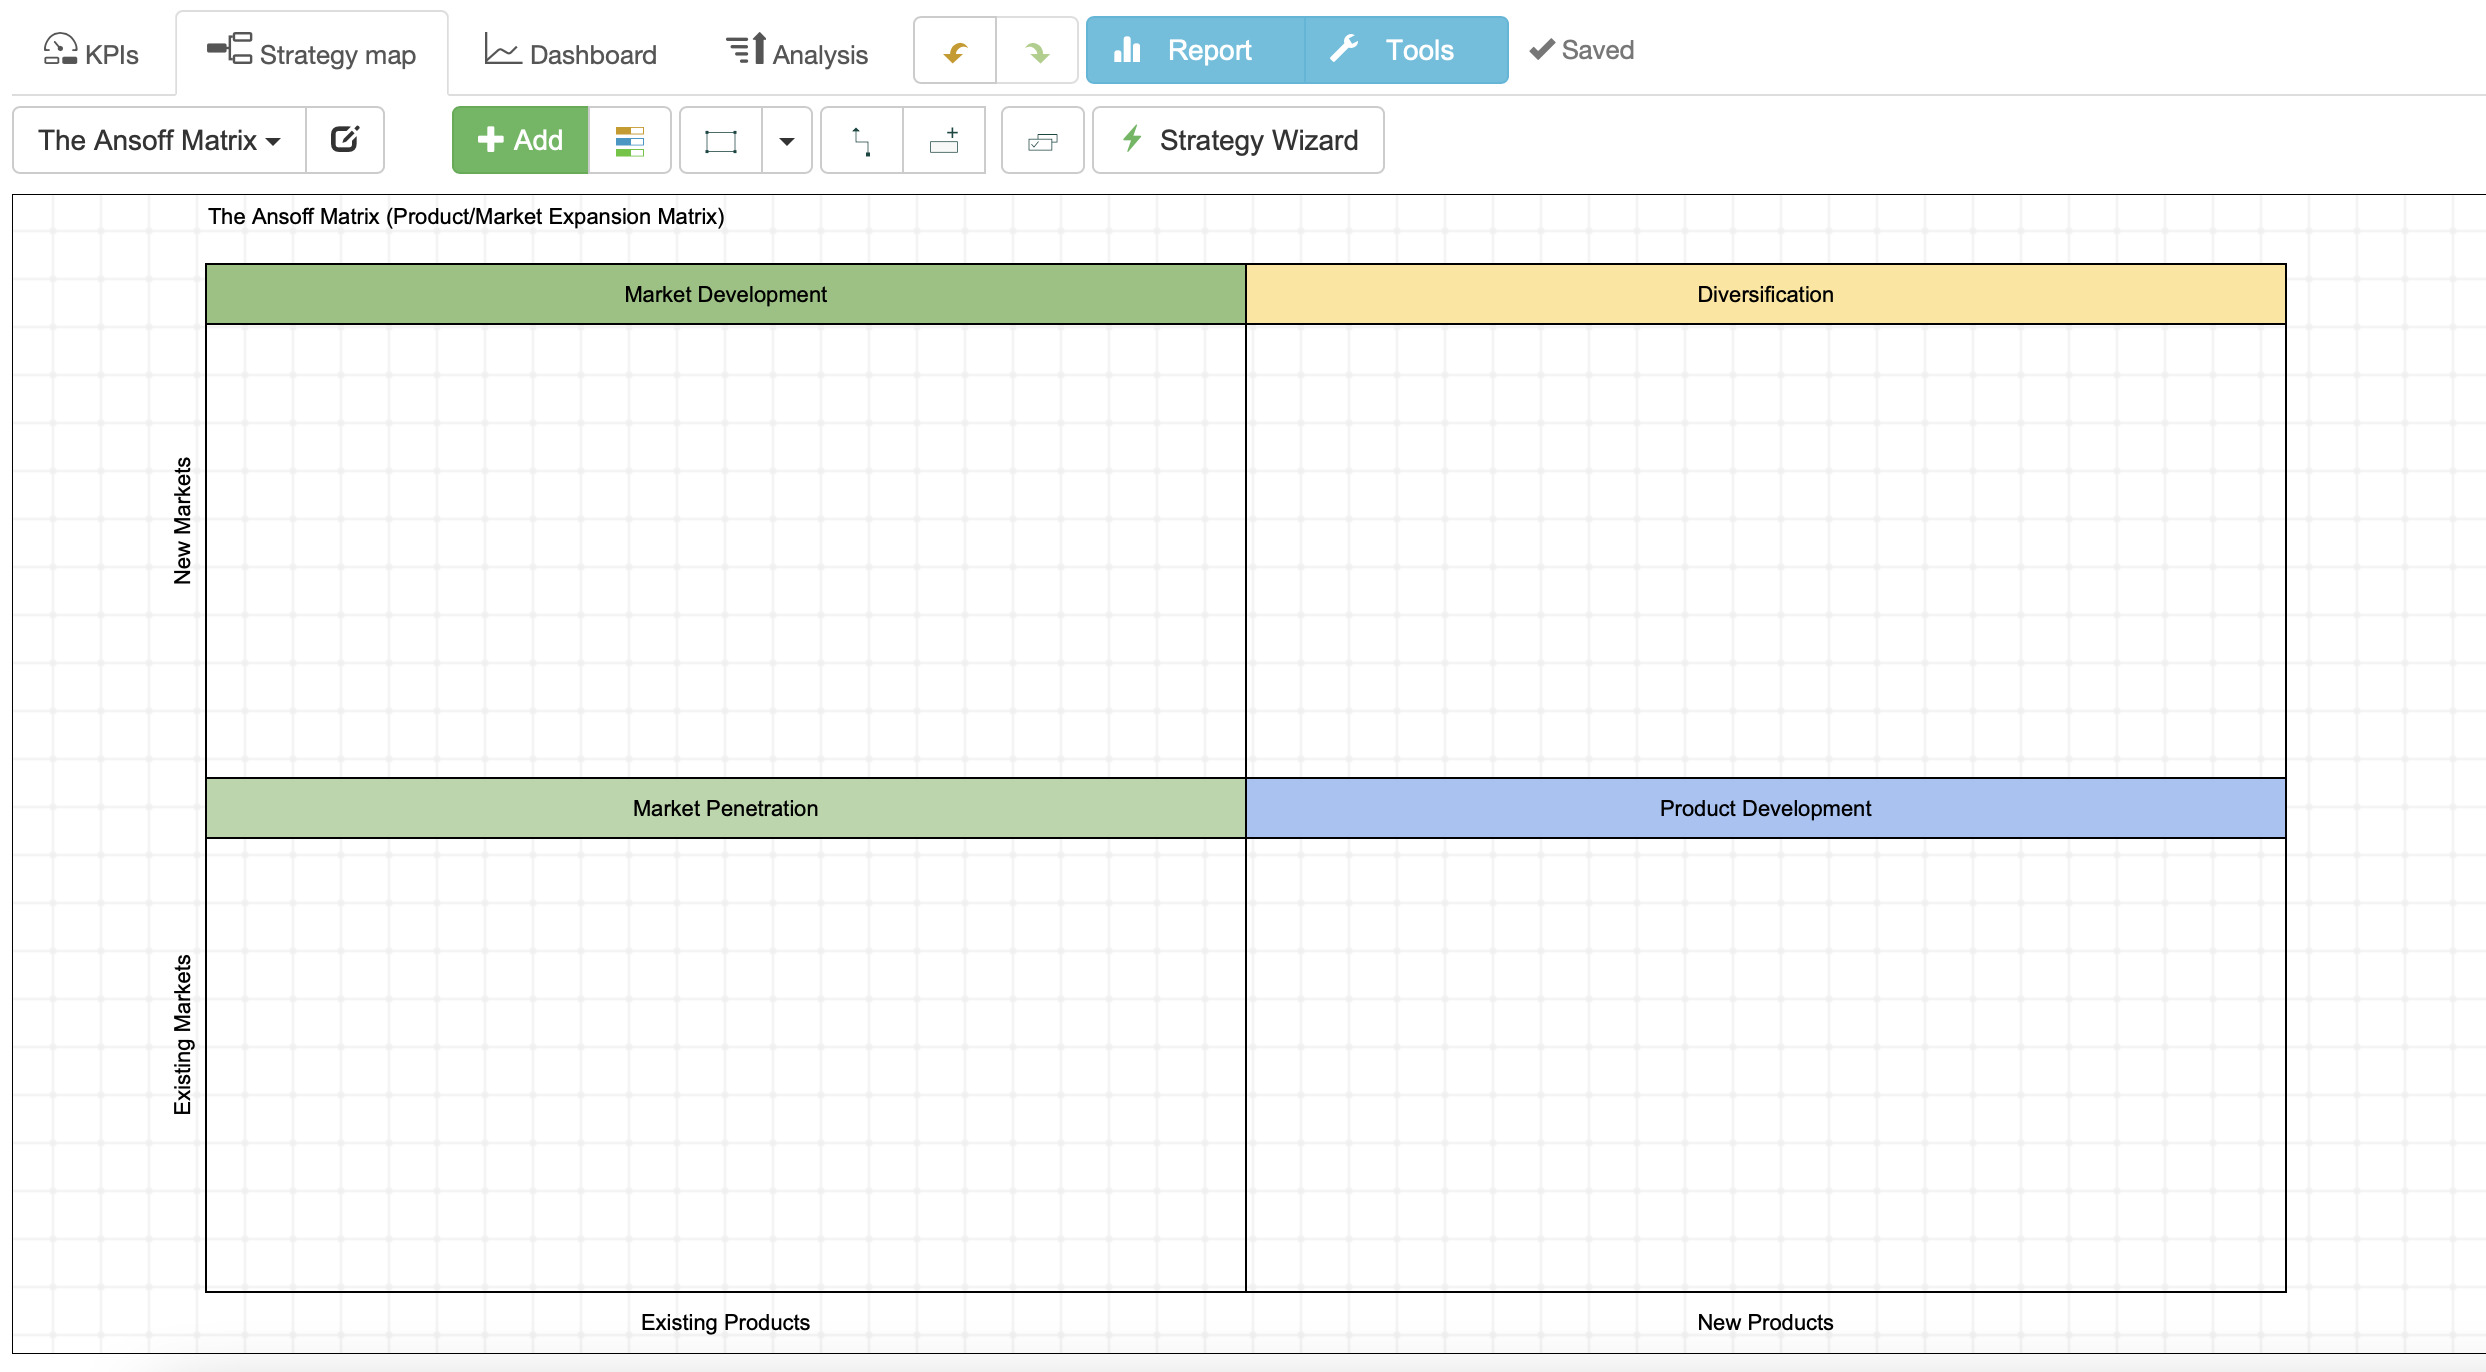
Classify the suggested strategy into the corresponding quadrant of the Ansoff Matrix.
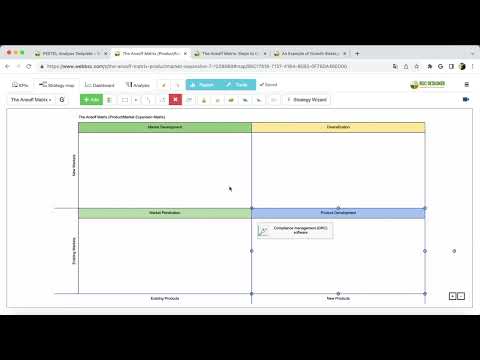
Users of BSC Designer will find the Ansoff Matrix in the available templates (see New > New scorecard > More templates…).
To Add a strategy to the template:
- Switch to the Strategy Map tab
- Select the corresponding quadrant of the matrix
- Click the Add button on the toolbar
Step 3. Formal Description of the Growth Strategies
As part of disciplined strategic planning, a company describes selected strategies by:
- Formulating hypotheses to validate
- Defining specific initiatives to validate the hypotheses
- Defining risks
- Quantifying the hypotheses with performance indicators
- Quantifying the strategy to compare it with alternatives
As explained in “Compare Strategies Quantitatively,” good candidates for the quantification are the criteria of stability and growth.
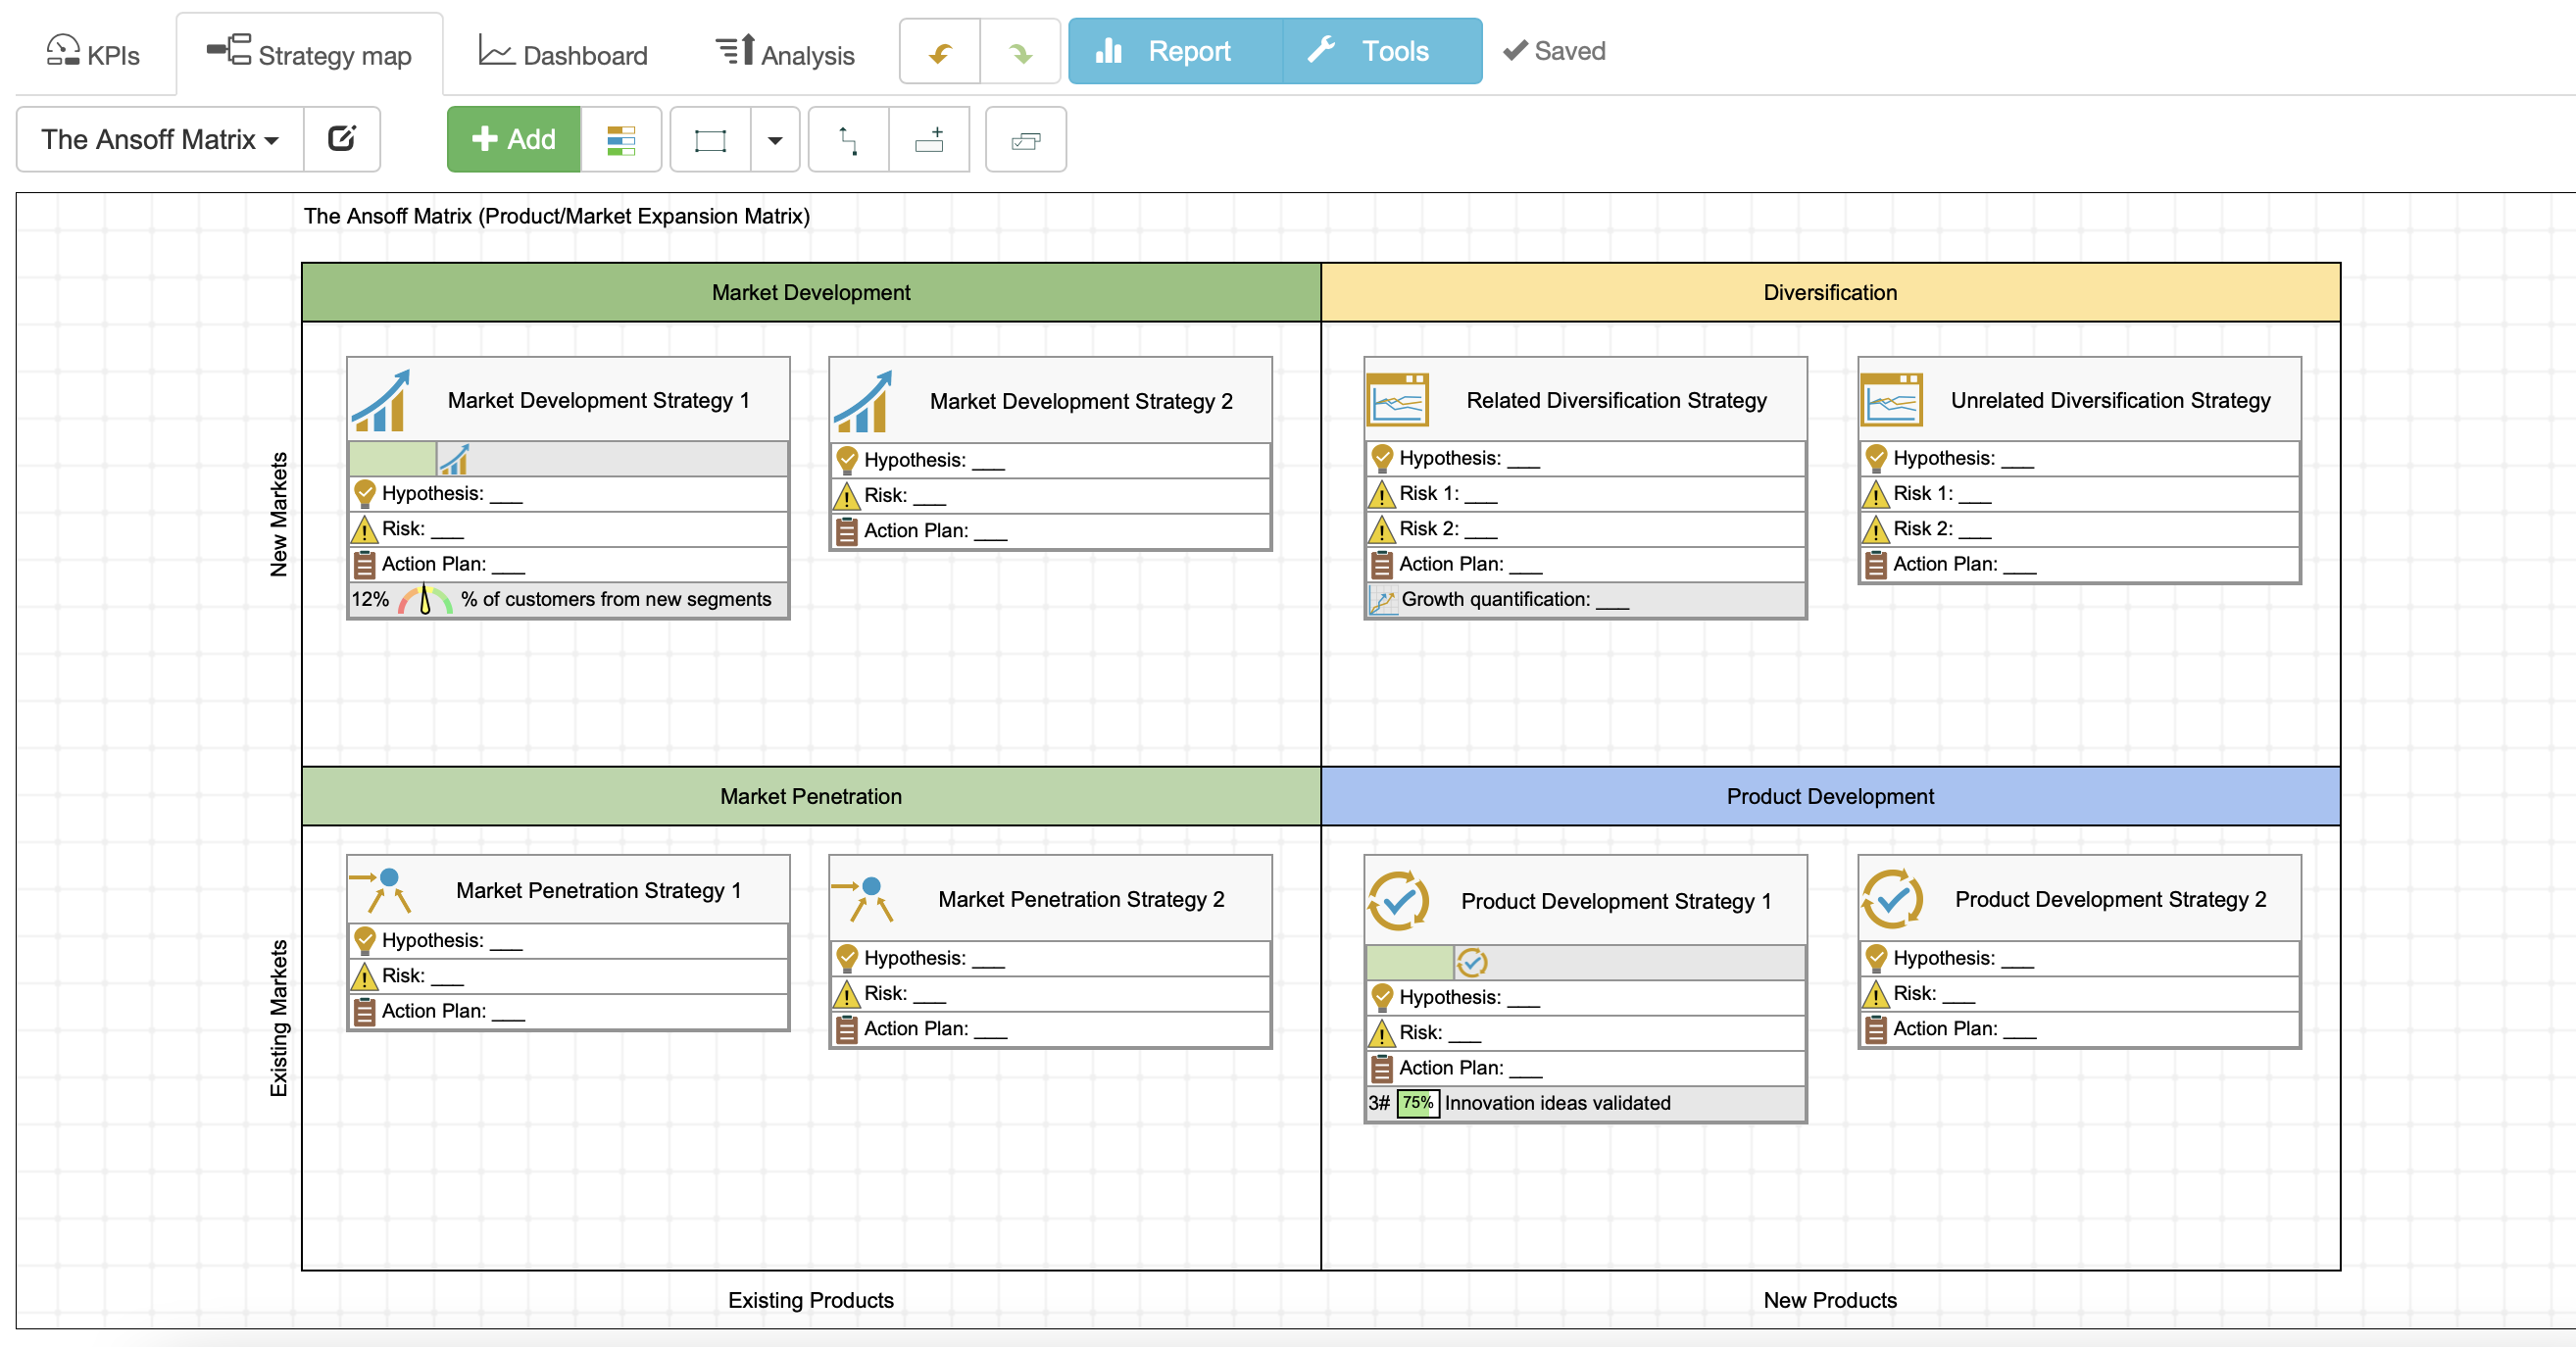
Users of BSC Designer can align risks/initiatives with the strategy, as well as define the performance indicators.
Example of Using Ansoff Growth Matrix
Let’s use the BSC Designer company as an example to illustrate the steps of developing a growth strategy using the Ansoff Matrix.
Analysis of the trends (Step 1)
Our current focus is on strategic planning software. We used the PESTEL analysis and scenario planning to understand new trends and possible scenarios relevant for our company.
Among high priority trends, we saw:
- Impact of VUCA, increasing complexity of business environment. Companies are looking for more specialized help in their strategic planning efforts.
- Growing role of compliance in the daily business of organizations (GDPR, Risk Management, Cybersecurity, Sustainability Reporting Regulations).
- Increasing impact of remote work and related challenges, like complexity of managing remote teams and measuring their performance.
Diversification Strategies (Step 2)
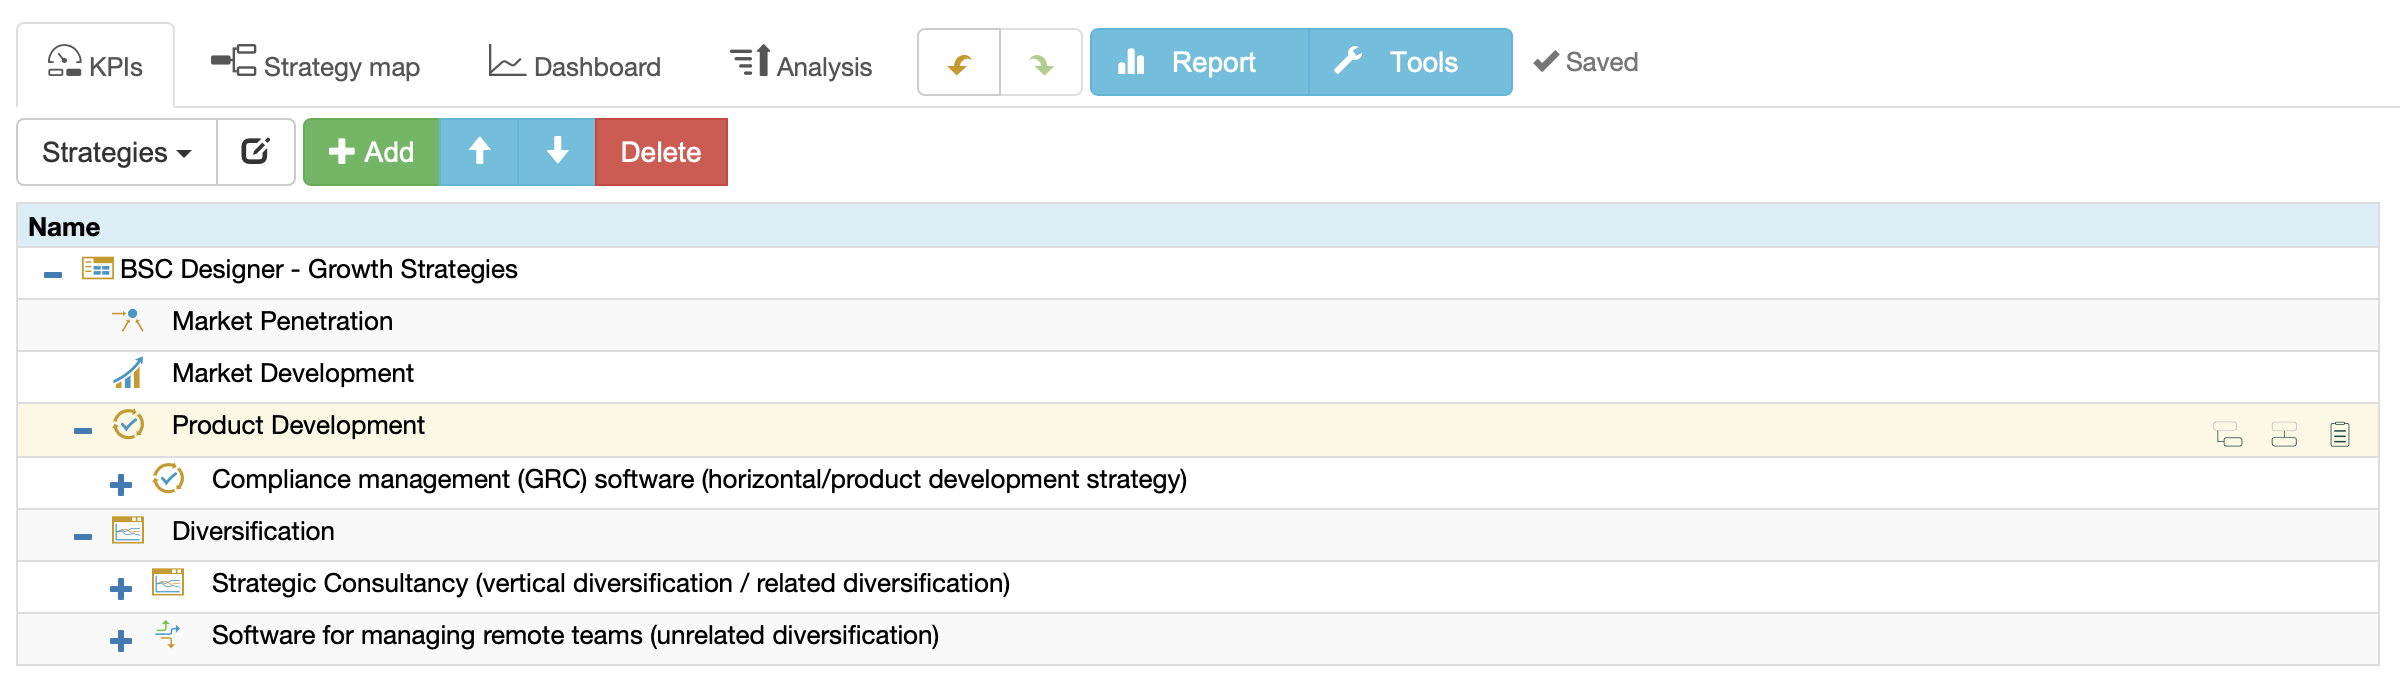
We formulated three possible growth/diversification strategies:
- Strategic consultancy as an example of vertical diversification (related diversification)
- Compliance management (GRC) software as an example of horizontal diversification strategy (product development strategy)
- Software for managing remote teams as an example of lateral diversification strategy (unrelated diversification)
Alternative Growth Strategies (Step 3)
In Step 3, we do a formal description of the growth strategies.
Vertical diversification – Strategic Consultancy
Rationale: with all our free training on strategic planning, we have some good contact points with prospective clients of consultancy.
Risk: selling consultancy online.
Initiative: to estimate the risks of this strategy, we need to understand the degree of interest of our existing customers in the new service when provided in online format.
Horizontal Diversification – GRC software
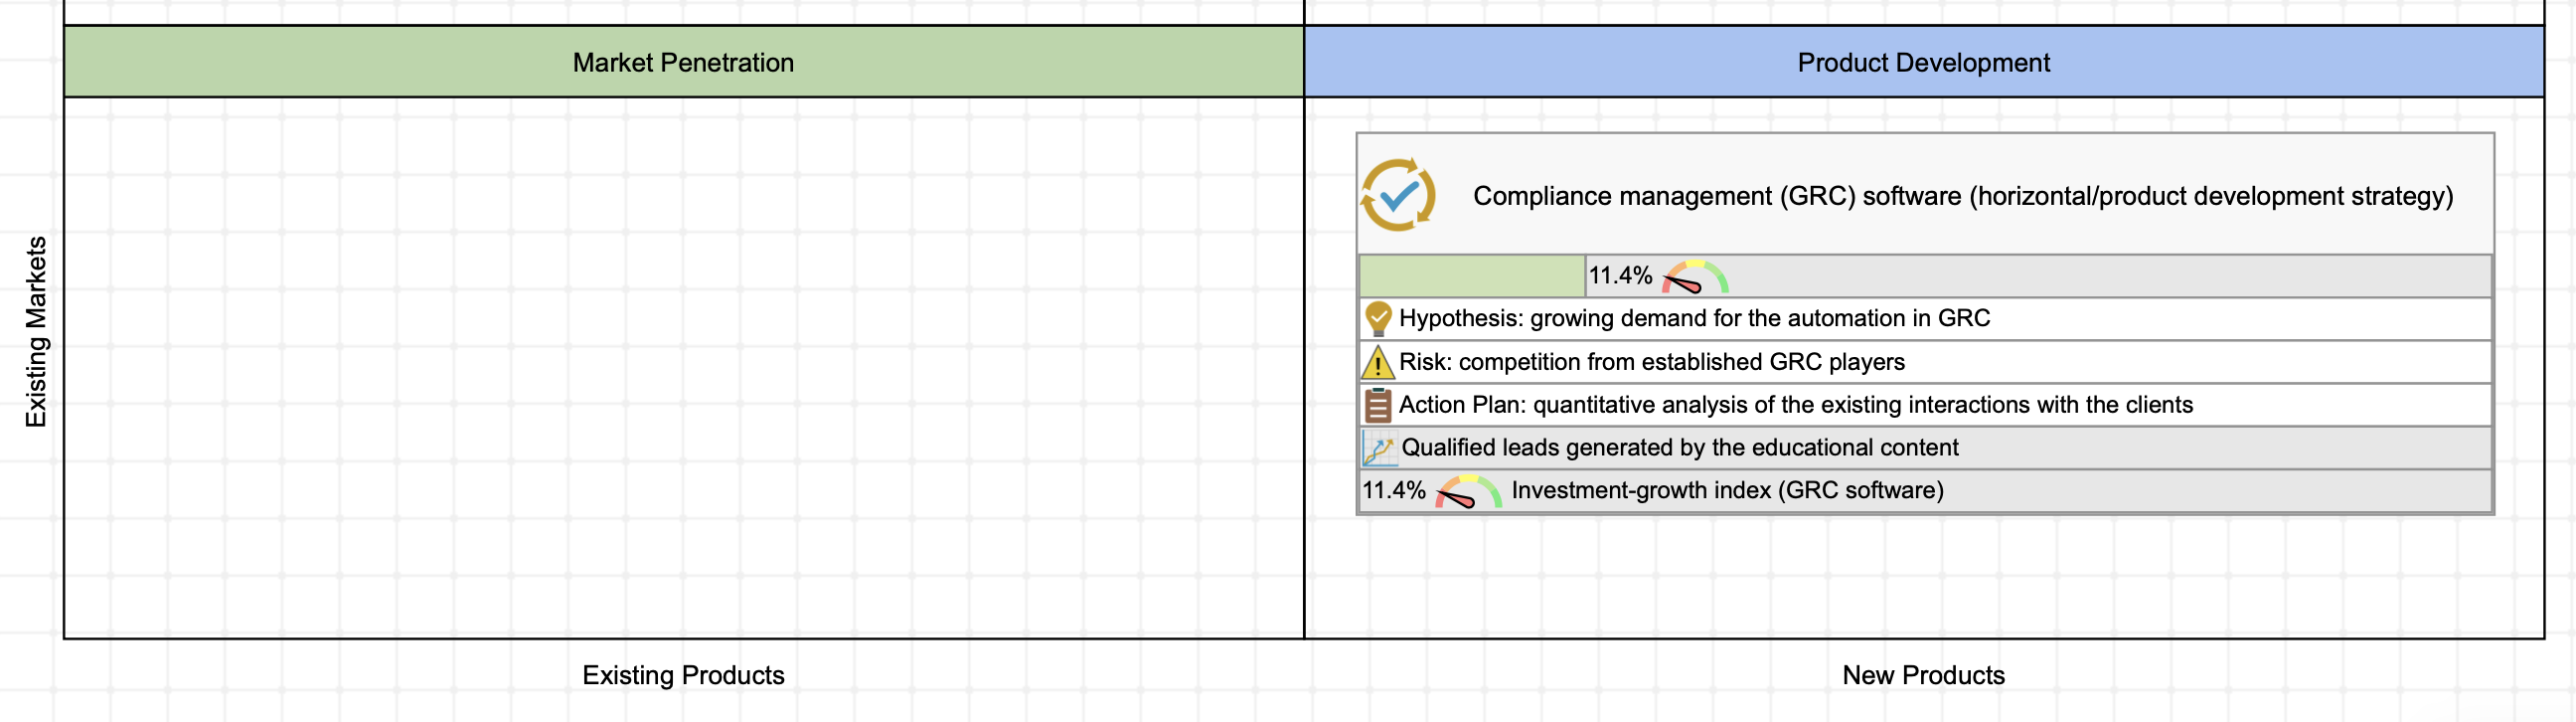
Rationale: some studies7 confirm the growing demand for the automation in GRC (Governance Risk Compliance) domain; we have experience helping our users to quantify governance, comply with the quantification requirements of ISO quality standard and new European Sustainability Reporting.
Risk: competition from established GRC players.
Initiative: quantitative analysis of the existing interactions with the clients will help estimating the risk associated with this horizontal diversification.
Lateral Diversification – Software for Remote Teams
Rationale: with our experience in managing remote teams and our experience in software development, we can develop a product for a completely new market – a software for managing remote teams.
Risk: while remote work is here to stay, there are certain doubts about the financial viability of this diversification strategy.
Initiative: test is if we can find a way to get leads at reasonable cost.
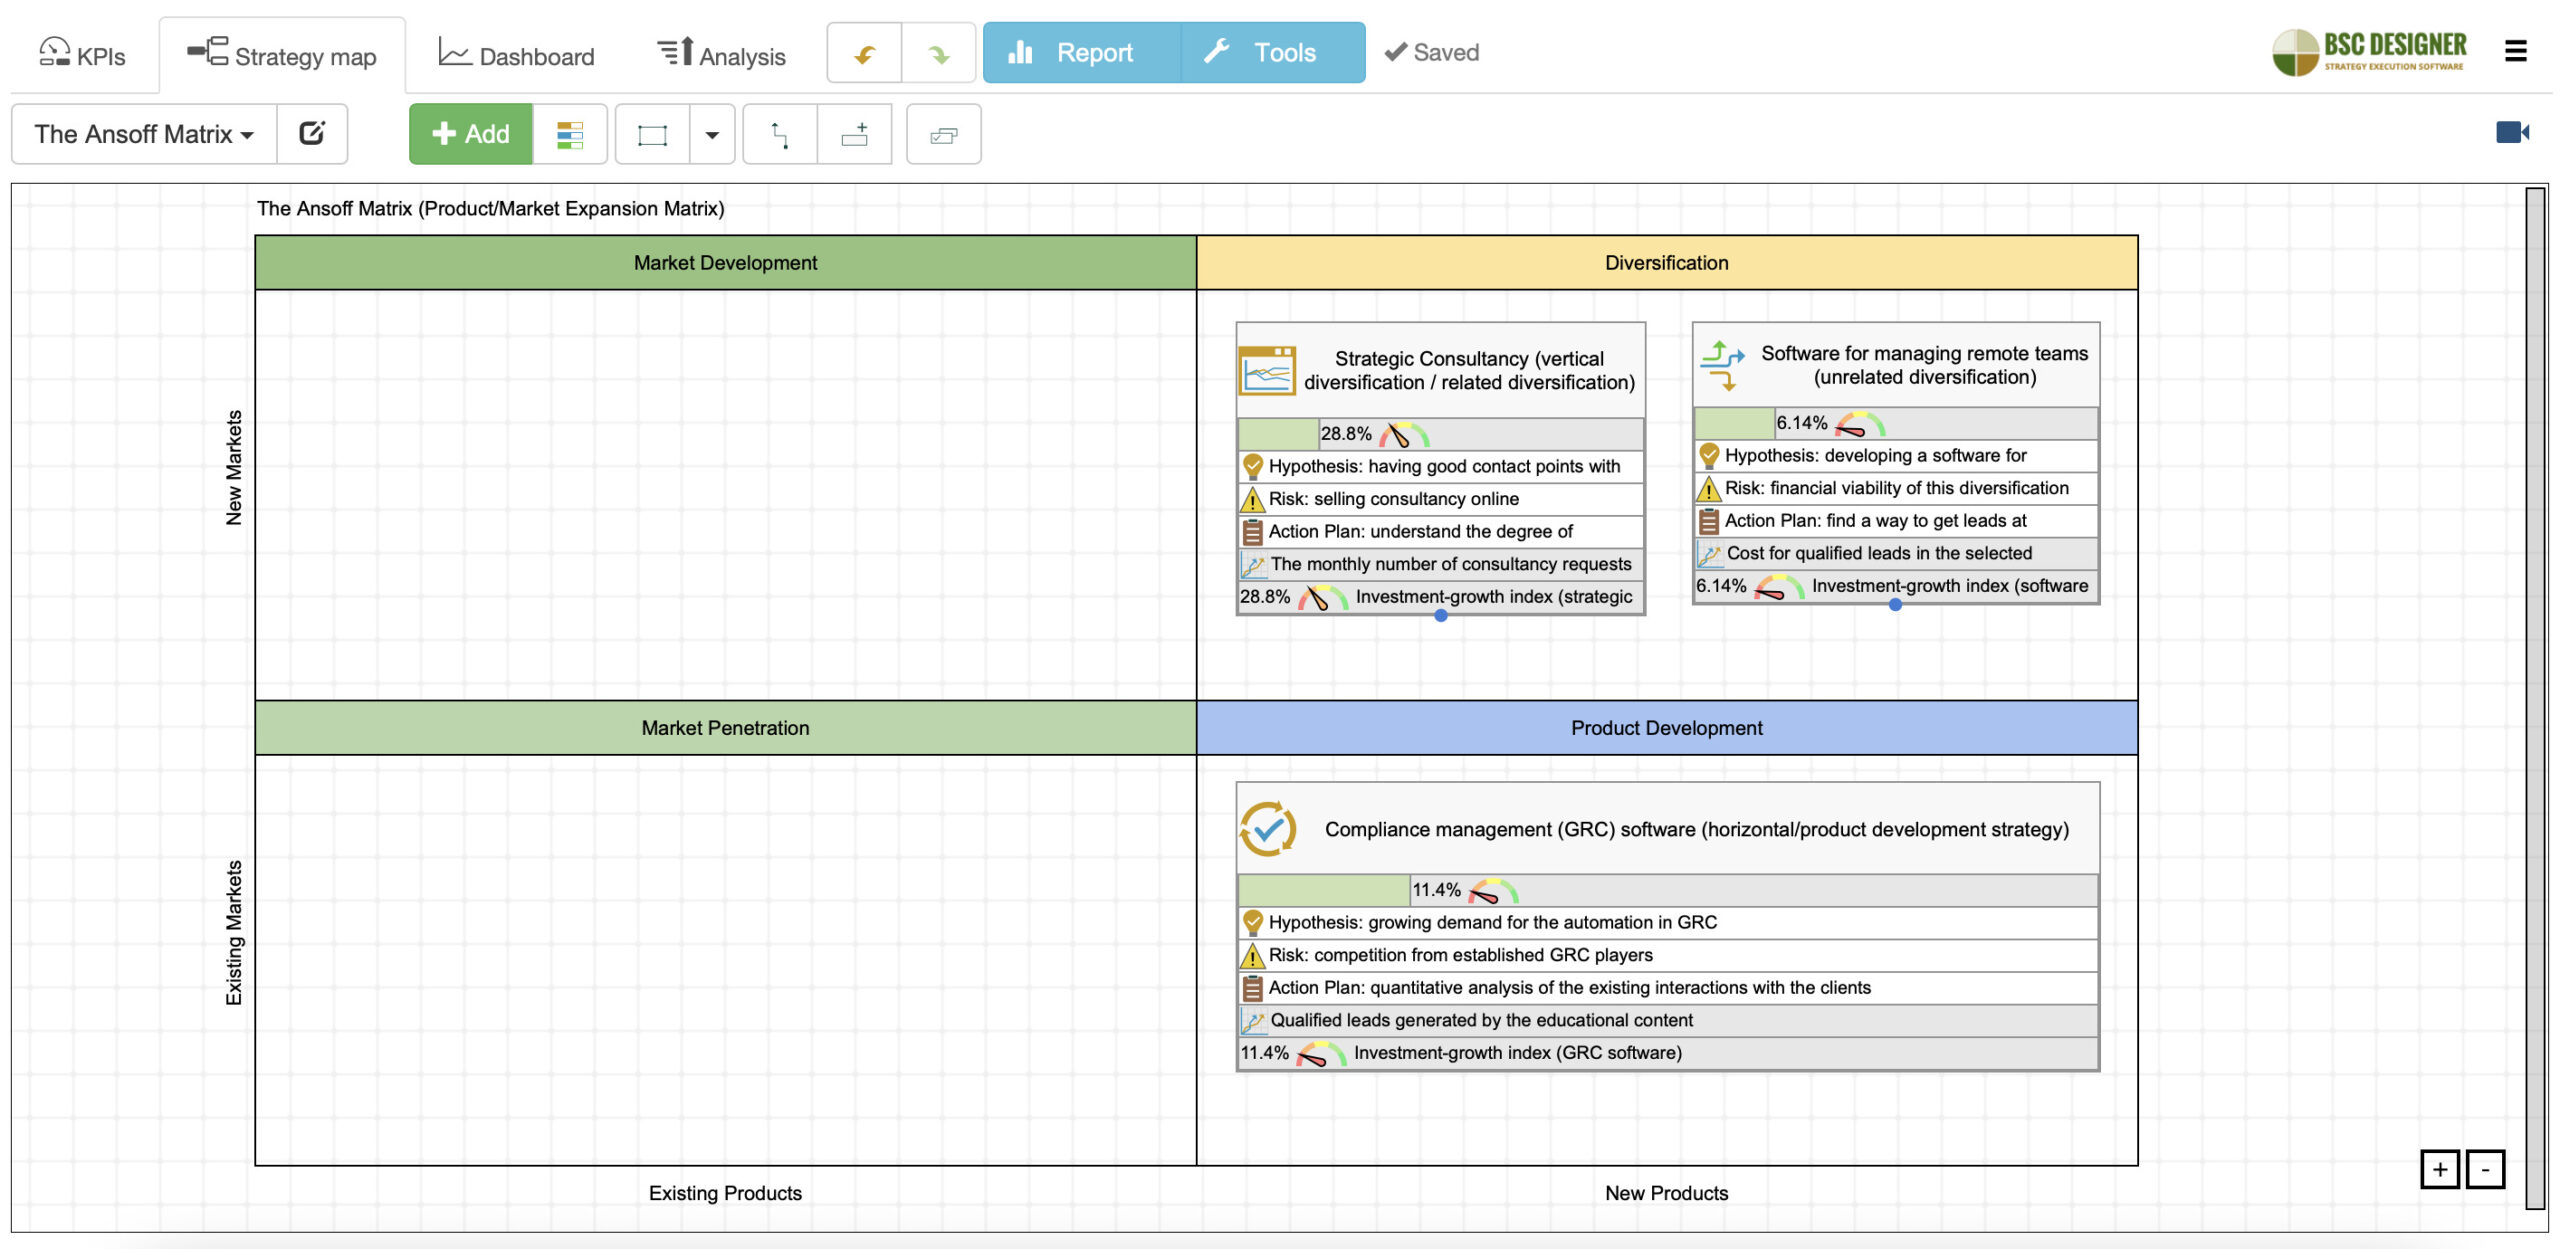
Quantifying the Growth Strategies
Finally, we quantity the growth strategies to validate the initial hypotheses and compare alternative strategies. Our quantification will be focused on a possibility of cost-effective lead generation and expected return on investments.
Here are some examples of the KPIs:
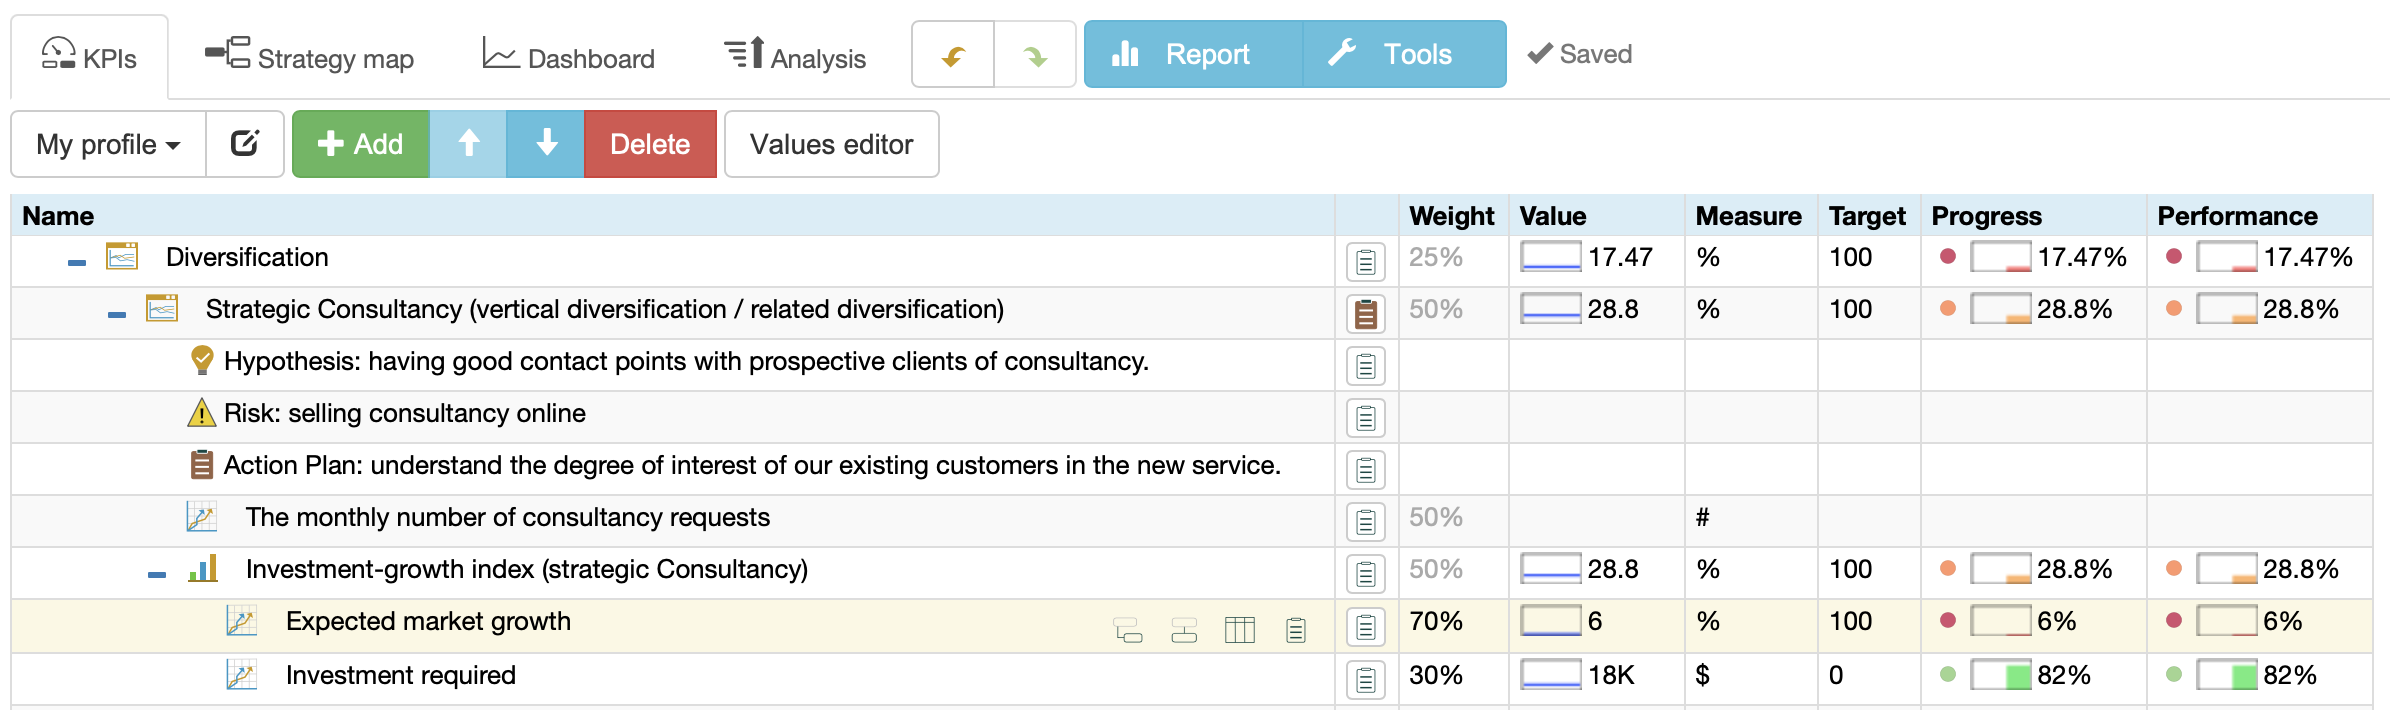
- The monthly number of consultancy requests (vertical diversification)
- Qualified leads generated by the educational content (horizontal diversification)
- Cost for qualified leads in the selected business domain (lateral diversification)
We quantified all growth strategies using weighted Investment-growth index that includes two metrics:
- Investment required, weight 30%. Optimization (see the Performance tab) = minimization.
- Expected market growth, weight 70%. Optimization = maximization.
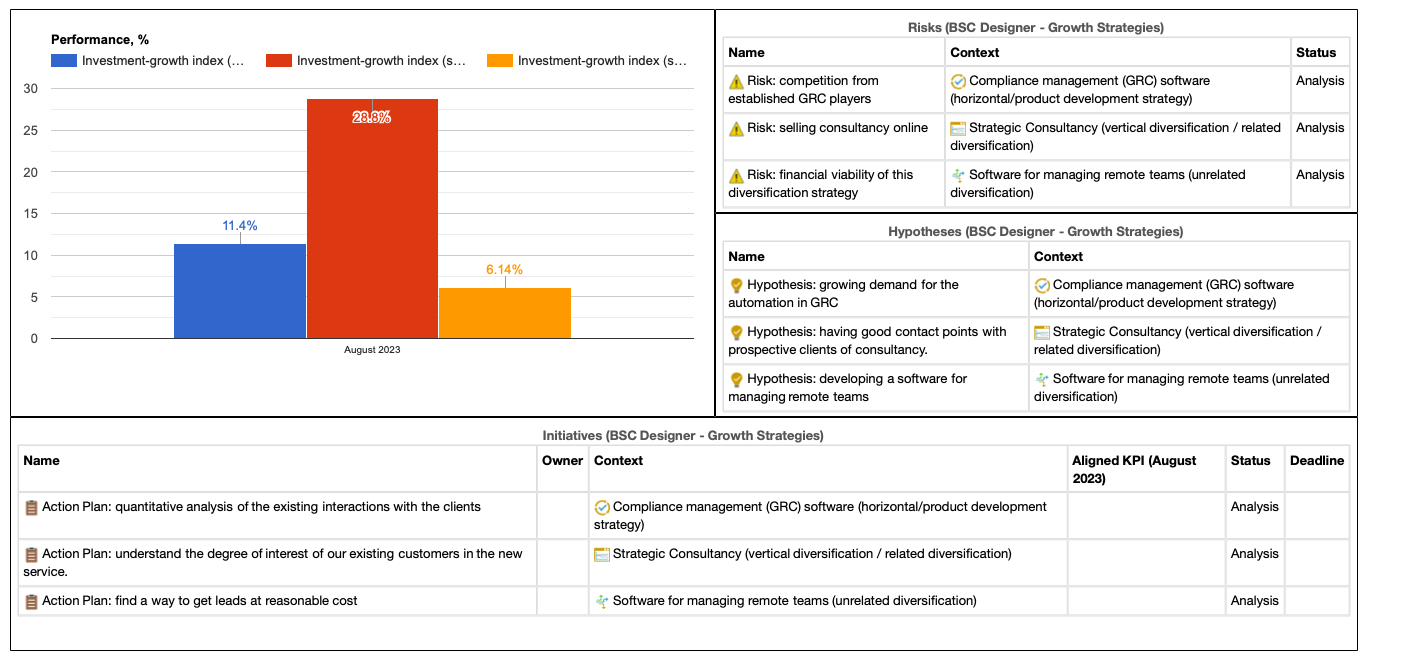
The results of quantitative estimation of the growth strategies, as well as hypotheses, risks, and initiative were visualized on the performance dashboard.
Conclusions
The value of the Ansoff Matrix is not in clarifying the strategies in the right quadrants but in the logic supporting the matrix that we discussed in the Three Steps to Plan Growth Strategies:
- Step 1. Understand the trends that are moving your industry.
- Step 2. Define several strategies to address those trends (that’s where the matrix helps to frame the ideas).
- Step 3. Make the strategy alternatives comparable by quantifying their impact on stability and growth.
- Strategies for Diversification, Igor Ansoff, Harvard Business Review, 1957 ↩
- “Comparison of Strategic Planning Tools and Frameworks,” Aleksey Savkin, BSC Designer, January 26, 2020, https://bscdesigner.com/strategic-frameworks-comparison.htm ↩
- Big Enterprise in a Competitive System, A. D. H. Kaplan, The Brookings Institution, 1954 ↩
- Was “Built To Last” Built To Last?, 2004, J. Reingold, R. Underwood, FastCompany ↩
- Why “Built to Last” Companies Didn’t, David K. Hurst, 2010, Strategy + Business, PWC Publication ↩
- To Diversify or Not To Diversify, Constantinos C. Markides, 1997, HBR ↩
- Governance, Risk and Compliance (GRC) software Business needs and market trends, David Cau, Deloitte, 2014 ↩
![]() CEO | Author | Speaker
CEO | Author | Speaker
BSC Designer is strategy execution software that enhances strategy formulation and execution through tangible KPIs. Our proprietary strategy implementation system reflects our practical experience in the strategy domain.