Performance Reports for KPIs, Goals, and Initiatives
Generate reports with various views on scorecard performance: overview, action plans, costs of strategy.
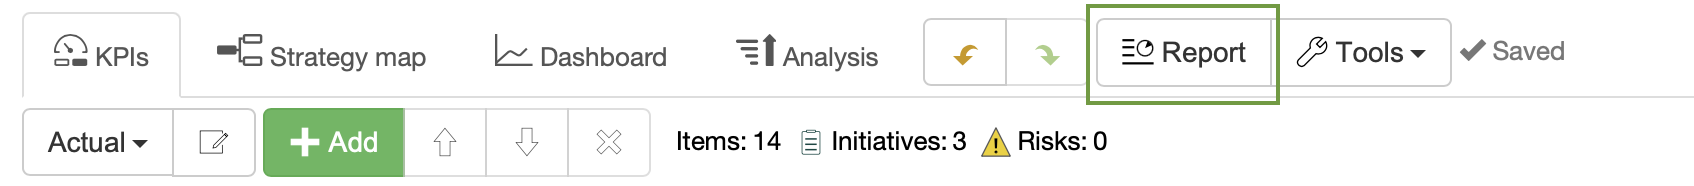
Access Reports
To access Reports dialog:
- Open a scorecard
- Click Report
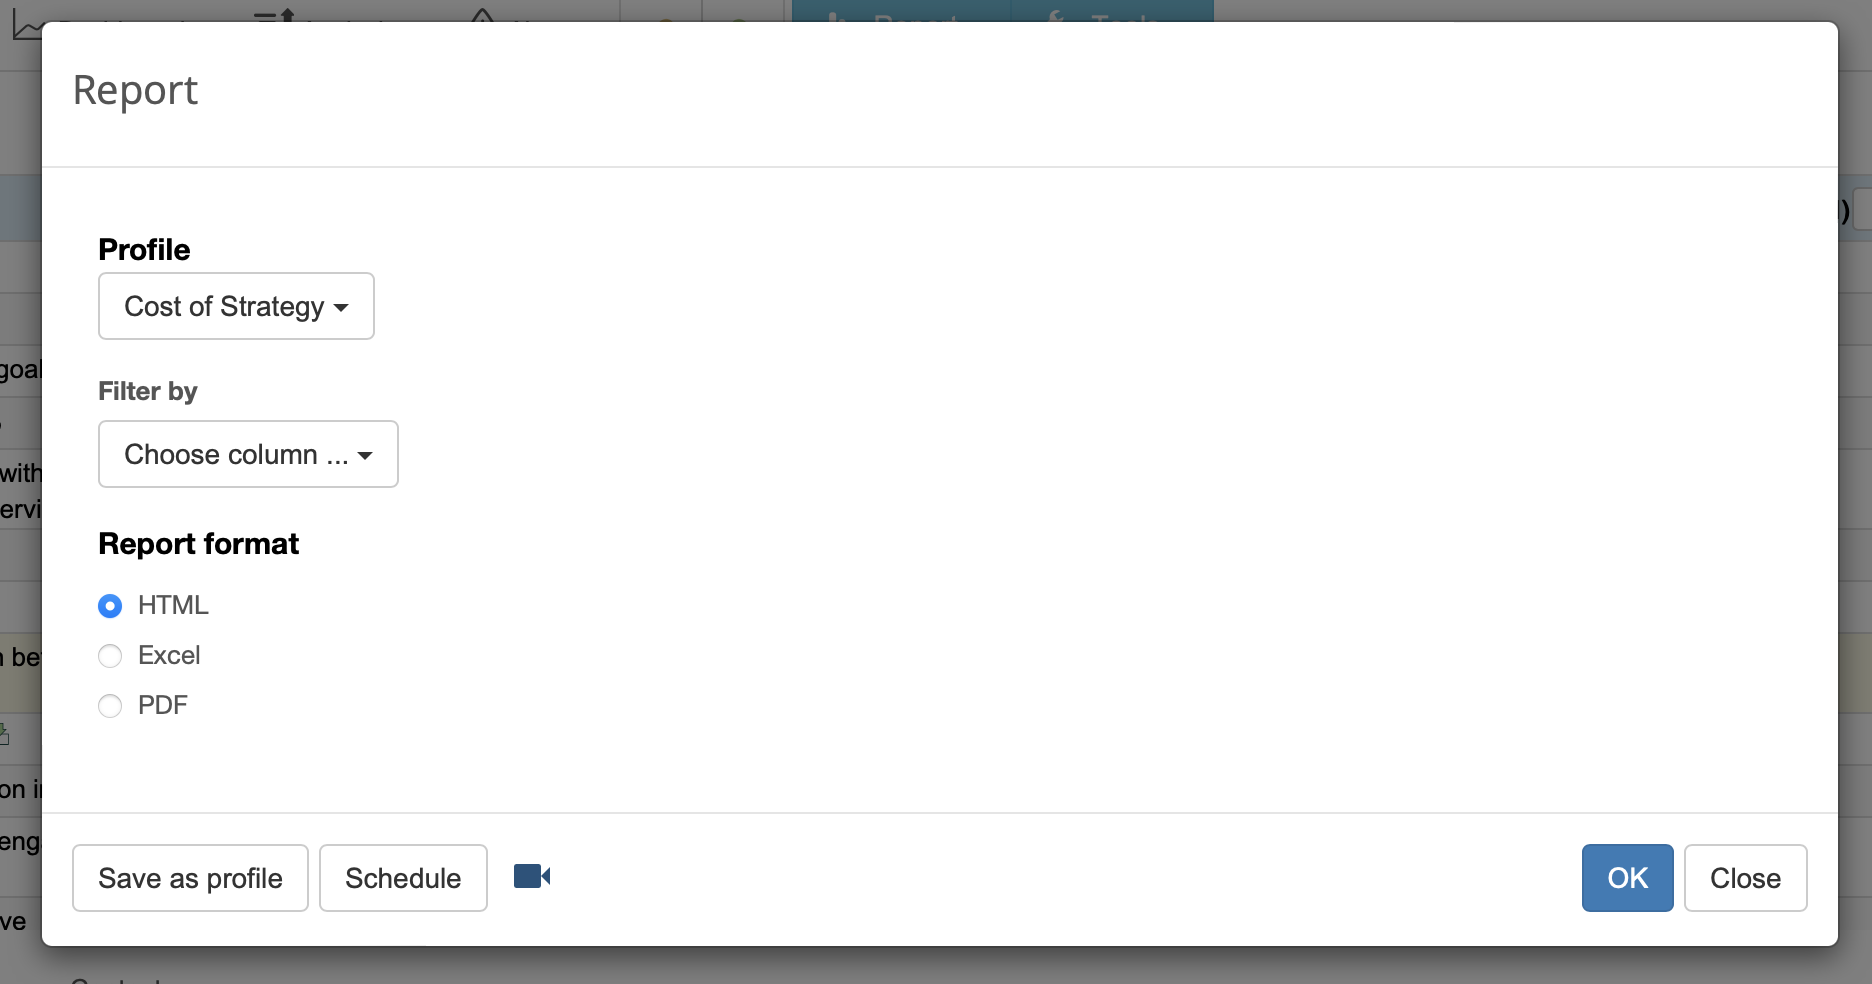
Generate a Report for the Scorecard
To generate a report:
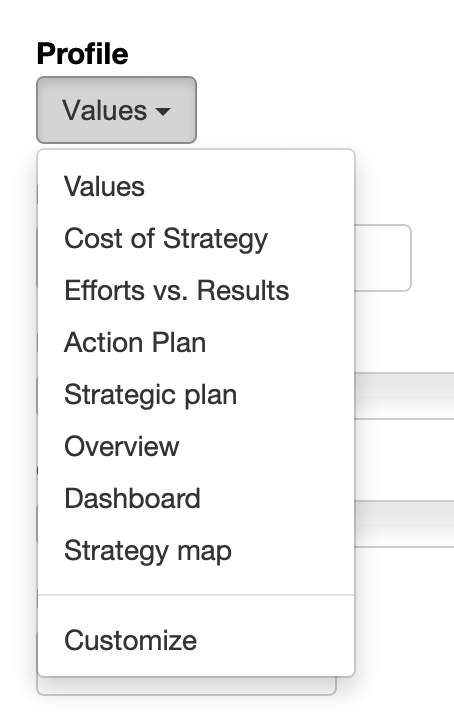
- Select one of the options:
- Values - a report with the values of all indicators from the scorecard
- Cost of Strategy - a summary of all initiatives with budget and duration data
- Efforts vs. Results - a report with data of the leading and lagging indicators
- Action Plan - a report with goals, initiatives, and persons responsible
- Strategic plan - a report with mission, vision, core values, strategic themes
- Overview - a report with all the details about your KPIs and their performance
- Dashboard - a report with all dashboards of the scorecard
- Strategy map - a report with all strategy maps of the scorecard
- Customize - use this option to create your own reports.
- Follow the link to open a generated report.
Create a New Report Profile
To create a new report profile:
- In the Profile droplist select any existing report to use it as a starting point
- Apply necessary filters
- Add/remove necessary columns or rows:
- Select a report field and click
 button to add it to the profile columns
 - Select a report field from the Data group and use
 button to add it to the report rows
 - Click OK button to save profile
Modify Existing Profiles
To modify custom profiles:
- Select Customize in the Profile droplist
- Use arrows to change the position of profile
- Use Edit button to modify the settings of the profile
Schedule Regular Reports
Receive reports regularly by email:
- Select any report profile from Profile droplets
- Click Schedule button
- Specify sending frequency
- Specify the recipient of the report
- Click OK to save
Charts in BSC Designer
To access charts and diagrams in BSC Designer open a scorecard, go to the KPIs tab and select any container or indicator. The chart element is displayed on the right.
Besides having a chart you have several drop lists.
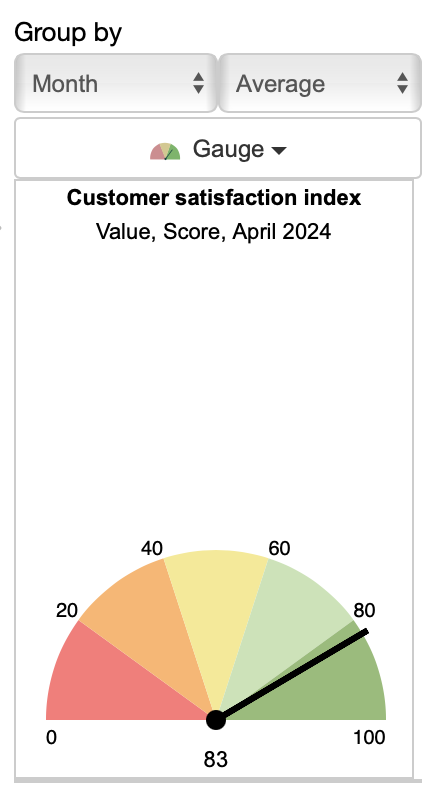
- Group by has two drop lists that define information reporting interval (by day, by month, etc.) and summary type (average, sum, etc.)
- Chart type - select the chart that you want to display right now
- Leading/lagging - select to display leading or lagging part of the data (available for containers only)
Details about Charts and Diagrams
BSC Designer supports several types of chart.
- Time chart. The chart shows how the value of the KPI changes over time. On the chart, the baseline and target values are displayed as well.
- Performance and Progress. These charts show how the performance and progress value for the selected KPI are changing over a period of time.
- Gauge diagram. Displays the values of the KPI for the date selected in the calendar. The baseline and target values are displayed as well.
- Pie. A Pie diagram is useful when you need to compare the performance of several KPIs in one container or in several top container.
- Table. Values table shows a date and respective KPI value for these dates.
- Weight. This chart shows the weights of all KPIs within a selected container.
- Risk. The chart visualizes the impact (weight) and probability (value).
- Radar. The chart for the containers that visualises performance, baseline and target of the child indicators.