KPIs for innovation that go beyond simple R&D budgeting. Use an example of a strategy map for innovation to describe your own strategy for innovations.
- Measuring innovations is a challenge
- Explanatory video
- Innovation funnel and metrics for it
- Strategy map: putting it all together
Measuring Innovations is a Challenge
The Meriam Webster dictionary defines innovation as “the introduction of something new.” In the business context, I like the way Amazon’s CEO Jeff Bezos framed the business vision of innovation:
“Our job is to invent new options that nobody’s ever thought of before and see if customers like them.”
Amazon founder, Jeff Bezos
Before we go ahead, let’s agree that we don’t pretend to measure the creative part of innovation, e.g., we won’t predict here if a certain innovation will be a success or not. What we can do is to make sure that an appropriate innovative environment is created and that the most promising “aha-s” find their way to the commercially successful products.
Why Measure an Innovation?
According to McKinsey1 innovation is recognized as one of the top three business priorities by 84% of executives.
You might be surprised that the main challenge of innovation is not about generating ideas. The survey data tells the opposite: more than 50% of respondents said that they had some good ideas, but the problem is how to scale and commercialize them – a “robust pipeline” for the innovation ideas is what many organizations want to have.
- The innovation is a priority for many organizations, but it’s not clear how to measure and manage it in an effective way.
Why Old Innovation Metrics Don’t Work
The traditional budgeting approach to measuring innovations doesn’t work. A typical innovation is not a production line that converts ideas into commercial products; it involves many stakeholders, and the measurement efforts should take them into account.
Here are some typical KPIs used for innovation.
- R&D budget or similar budgeting metrics. We cannot expect innovations to happen unless there is a budget for it, or can we? Let’s take any garage-based startup. It would certainly be easier with good funding, but things often happen without any significant investments.
- Metrics like Income from new products or Patents filed might be good to validate certain achievements, but due to their lagging nature, it’s hard to use them in a short-term management loop.
- Metrics that try to quantify the leading part of innovation like Innovative ideas or Number of active projects suggest moving into the right direction (“more ideas -> “more active projects” -> “more income from innovations”), but they don’t suggest a clue to how to get there. The result might be a portfolio of the “innovative projects” that satisfy the annual indicators for innovation, but it doesn’t help an organization to achieve its goals.
Explanatory Video
Innovation Funnel and Metrics for it
Now, let’s talk about building a measurement and management system for innovations that can address the challenges mentioned above.
A Quick Estimation: Where Are You in the Innovation Landscape?
In the 10 Step KPIs System2 book, I wrote about the importance of quick estimations. Before building a complex measurement system, let’s find out where we are now and what measurement tool is the most appropriate.
Suggest your team list the hypotheses (innovative ones) that they have tested recently. What situation do you face?
| Situation | Response |
|---|---|
| There were only “boring” ideas. | Probably, you need to look at the list of stakeholders and get more ideas from them. |
| There were some hypotheses, but there was no budget to test/implement them. | Start from basic budgeting metrics. |
| There were some ideas, but they have never been converted into hypotheses and respectively, were never tested. | Look at the innovative process (see more details below). Look at the capabilities of the team. They probably need to pass innovation training first. |
| There were some hypotheses, but they were implemented on a small scale only. | The problem is probably with the sponsorship of the ideas by top managers. We will talk about this below. |
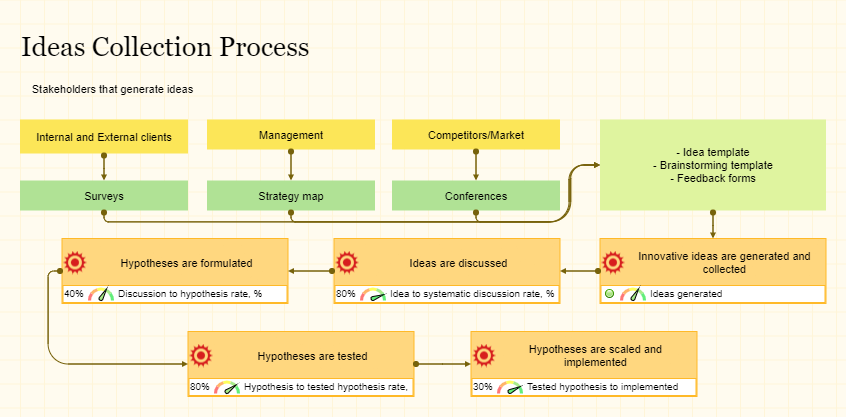
Stakeholders: Who Can Generate Ideas?
Who is involved in the innovations? It’s not just your R&D and Management. Let’s list some of the typical stakeholders and talk about their role in the innovations.
| Stakeholders | Role in the innovations |
|---|---|
| Employees | Generate ideas; make innovations happen |
| Management | Generate ideas; set big goals; allocate resources; lead teams |
| Finance | Budget allocation |
| Clients (end-users and internal) | Generate ideas; use the results |
| Business systems | Provide a pipeline for hypothesis testing |
| Culture | Determine the behavior patterns (from ways to grow the idea to document the results) |
| Competitors and Market | The source of competitive and market intelligence ideas |
| Events, networking, books, etc. | Other sources of ideas |
Innovation is Not Just About Listening to the clients
One of the trends in the context of innovation is fanatically focusing on the needs/problems of the clients and building innovation around those needs.
My position on this topic is the following:
- Clients are the stakeholders that help to generate innovative ideas (see the example with Mercadona Co-innovation Centers)
- Clients will finally use and pay for the innovation
- Clients are normally not qualified enough to formulate the innovation hypothesis, but your team is
In this context, it´s appropriate to quote what Henry Ford supposedly said:
“If I had asked my customers what they wanted, they would have said a faster horse.”
Measuring Innovation – the Easy Part
An innovation process exists in any organization. Managers can relatively easily measure the results (lagging part) of the innovations. We can measure:
- Funds spent on innovation
- The number of innovative initiatives that became successful in a certain amount of time
- Revenue generated by innovations
But what about the leading part?
Measuring Innovation – the Hard Part
How can the leading metrics be formulated for the domain of innovations?
- How can we predict that the company will create these innovations?
Let’s formulate the opposite question:
- What is a profile of a company that most likely won’t be able to innovate?
These are the companies where:
- All new ideas are rejected
- The barrier for approving new ideas is too high
- The bureaucracy dominates over common sense
- Where short-term profits are more important than long-term value for the customers
- Where employees are always busy with firefighting and simply don’t have free time to think about something new, and
- Where informational silos limit the exchange of information between the departments
We can go ahead and list more behavior patterns that have negative influence on the innovative potential. My point is that the innovative companies will do exactly the opposite things. Do you need to measure how innovative your company is? Quantify and measure those behavior patterns.
Don’t forget about the stakeholders discussed above:
- Who might suggest an innovation? Employees, partners, clients?
- Are the members of your team using your product or service as end-users?
- How actively can your team experiment?
How Innovative is Your Environment?
The basic metrics might be:
- The number of ideas suggested by the team over a period of time
- The percentage of the ideas turned into experiments
- Dedicated time for the experiments
Where do those ideas come from? What might be the inputs for the innovation?
- Do the members of your team read the books in their domain, visit conferences?
- Can we expect that someone who visited a conference can write down a list of 5 ideas that your team can try later?
That’s easy if someone watched the presentations and networked with colleagues!
Co-Innovation Centers
Spanish Mercadona is an excellent example of how an effective innovative environment can be organized.
They invest in co-innovation centers, where their “jefes” (the clients) have the opportunity to experience new products. According to the study by Institut Cerdà3, the success rate of the products that passed the co-innovation is 82% compared to the industry average 24%.
The success measure, in this case, is defined as:
- Products that stay in the product line after the 1st year, %
This initiative is not a random success, actually, the supermarket chain has a strong innovation strategy that is supported by investment in training of new hires (four weeks of training) and annual training (20 additional hours each year).
See the “Learning and growth” perspective below for the example of how the training initiatives can be aligned with innovation strategy.
Innovation Funnel
Having discussed how the companies innovate (and don’t innovate) we can build an innovation funnel. It will be something like:
- Insight > Idea > Discussion > Experiments > Prototype > Product > Commercial success of failure.
If you ask any entrepreneur about the number of his or her successful projects, you would hear something like 3 of 10 projects fail, 6 of 10 are poor performers, 1 of 10 is where we can achieve excellence. What do these numbers tell us in terms of innovation?
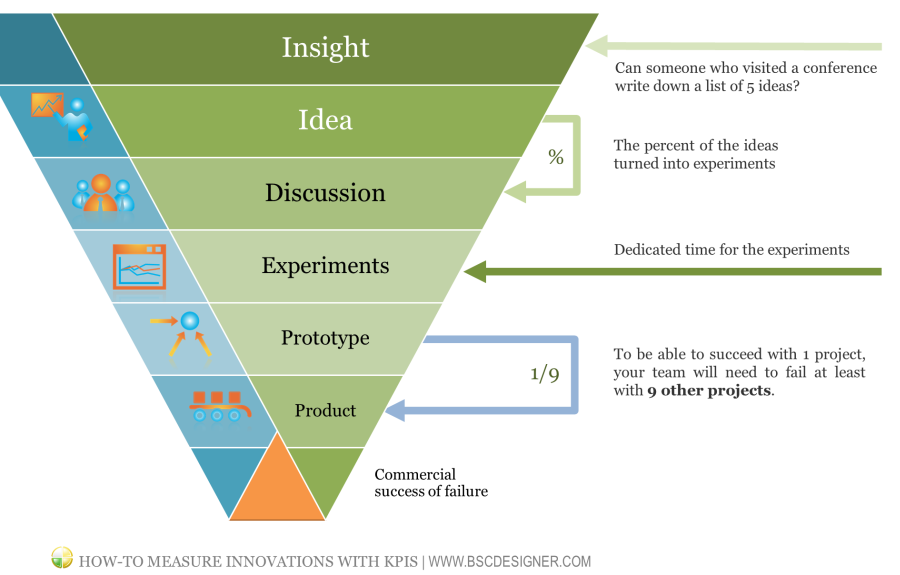
To be able to succeed with 1 project, your team will need to have as many as 9 other projects fail.
And make sure your teams are really trying and not giving away some random projects as failures.
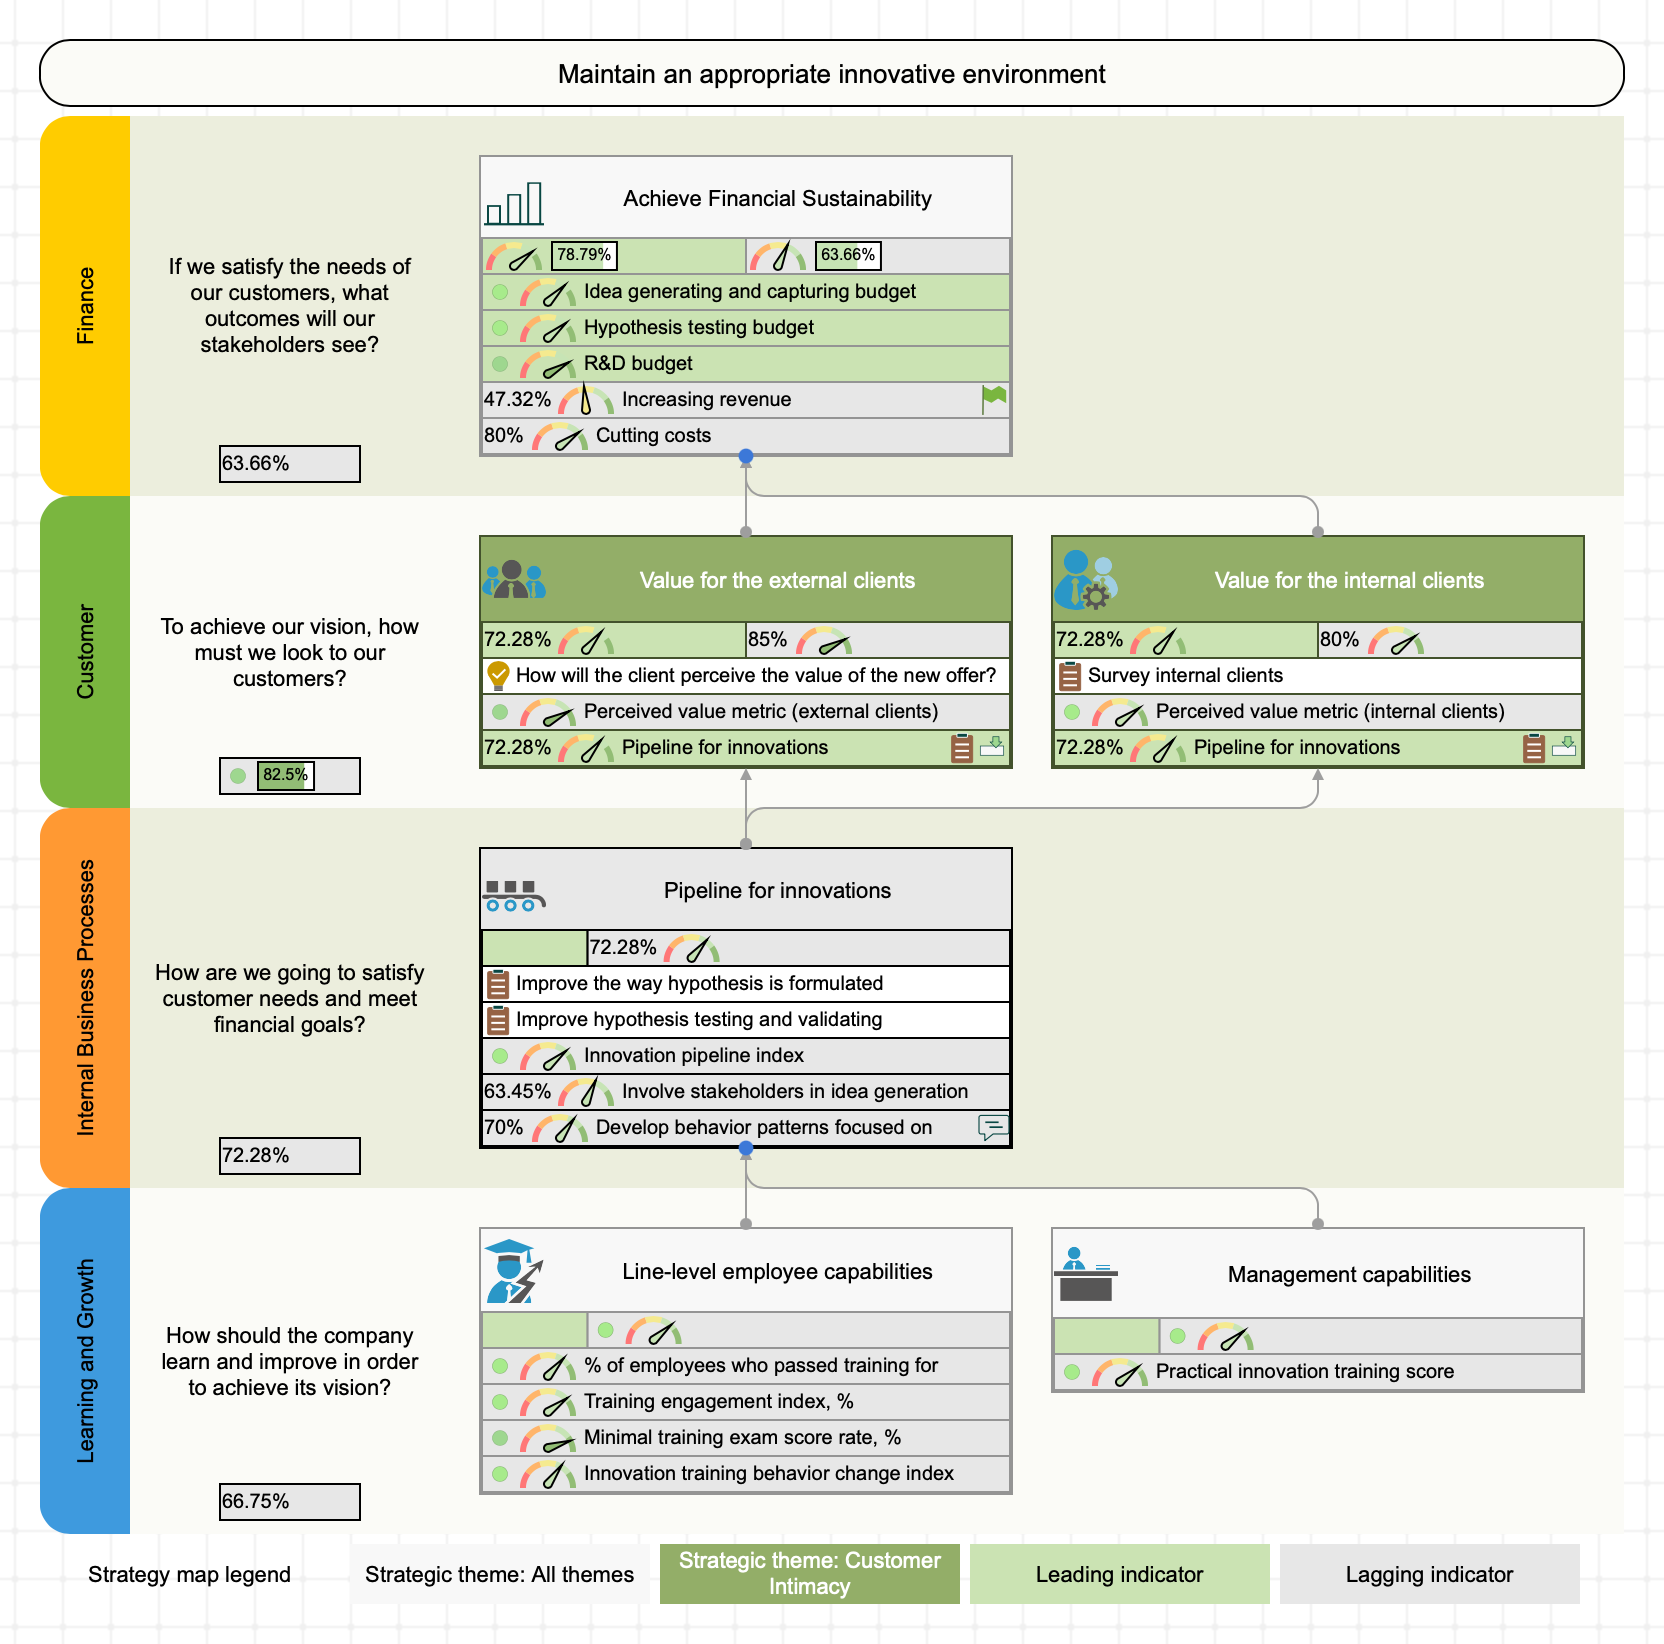
Strategy Map: Putting it All Together
Now, let’s put together all the discussed ideas and create an example/template of a strategy map for innovation.
Financial Perspective
To achieve financial sustainability (increase market share, increase revenue, cutting costs, developing different revenue sources), an organization needs to innovate for internal clients (business units) and external clients (end users).
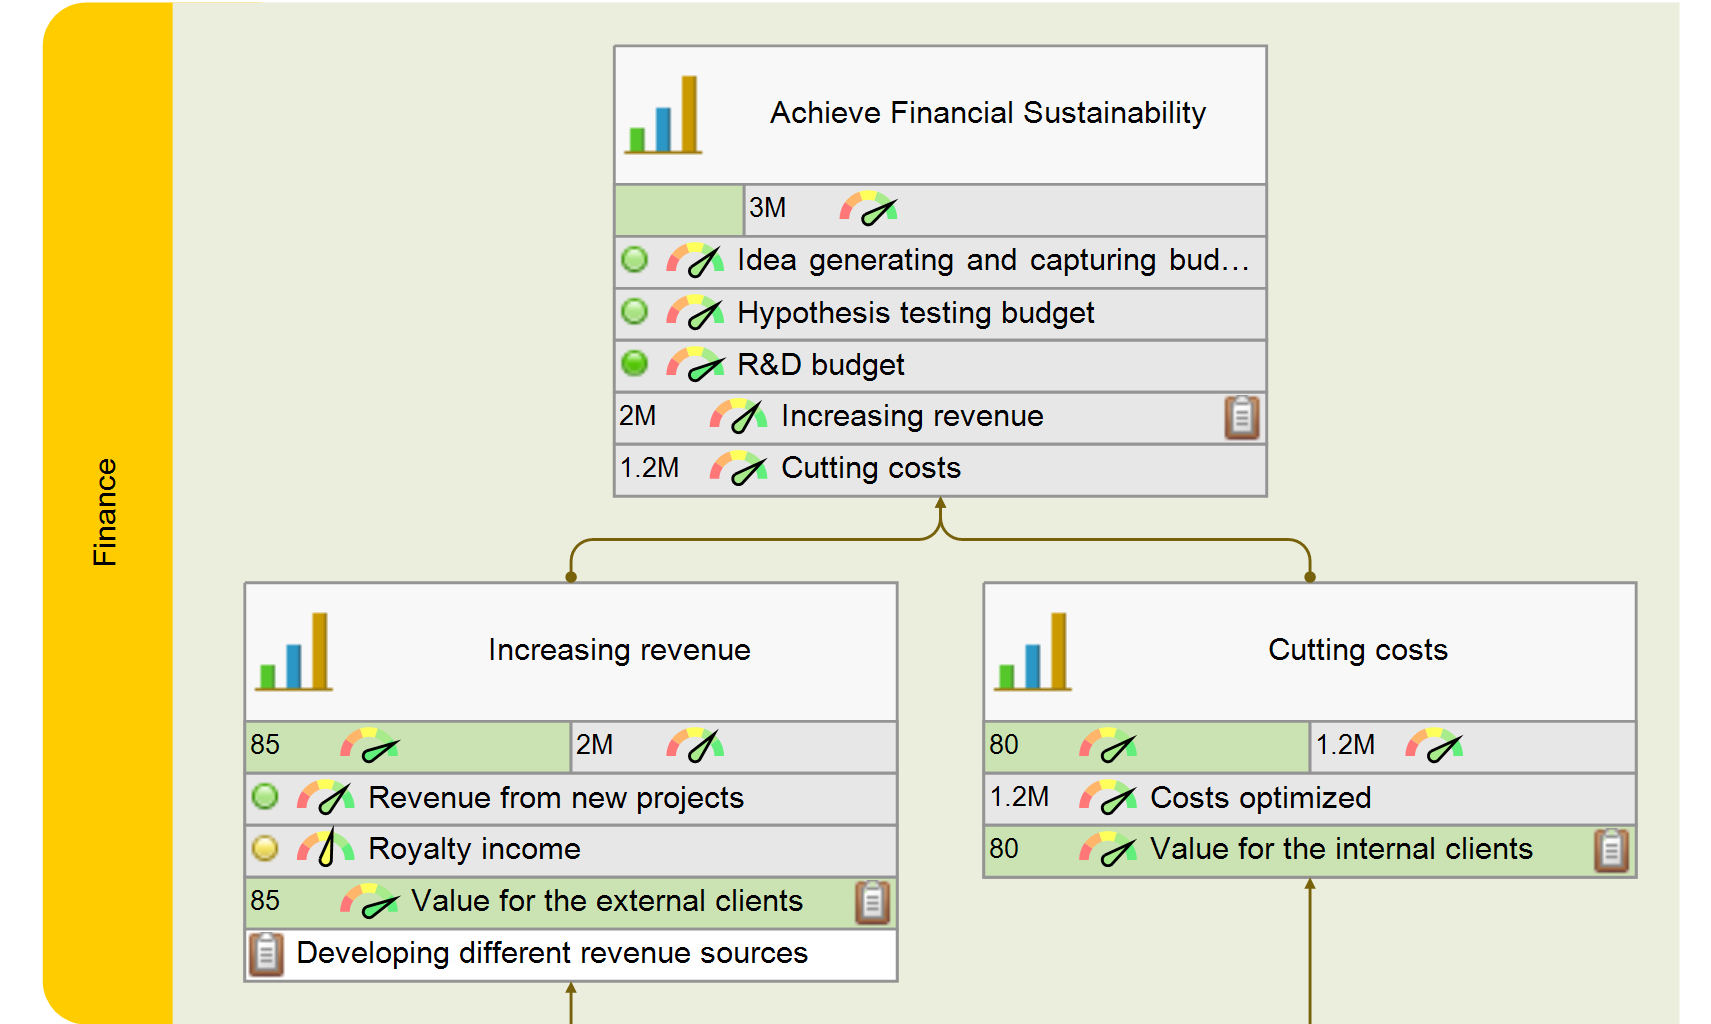
What resources do we need to allocate to generate, capture, and test a hypothesis? Here are some possible metrics:
- R&D budget
- Hypothesis testing budget
- Idea generating budget
- Idea testing budget
What return do we expect to get? Here are some possible metrics:
- Royalty income
- Revenue from new projects
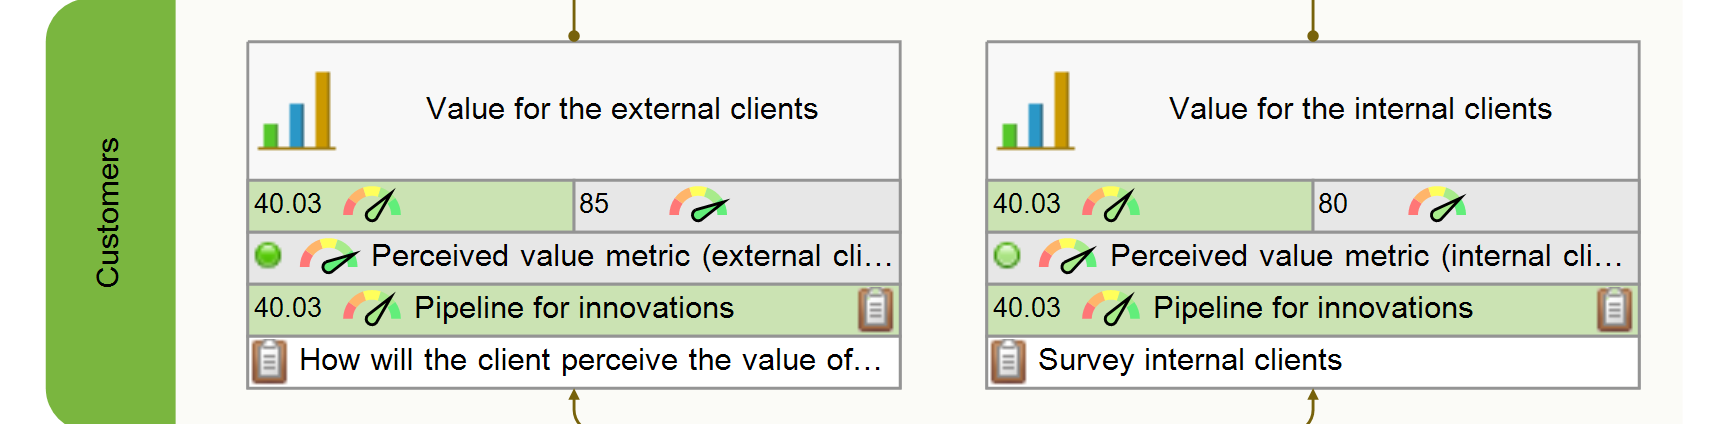
Client Perspective
Innovation needs to be recognized by the clients (see the Bezos quote in the beginning of the article). We need to create:
- Value for the external clients. What problem of the external clients (end-users) could the innovation solve?
- Value for the internal clients. What problem of the internal clients (business units, partners) could the innovation solve?
How to Measure the Value?
In terms of the measurement, a good question to ask is:
How will the client perceive the value of the new offer?
Is something working faster; or is higher quality provided at a lower cost?
Sometimes, it’s hard to quantify the specific value delivered.
For example, what value does Facebook provide? We can certainly compare the speed of photo publishing to a real-world photo book, but it’s obviously not the major value driver. A great way to socialize or easily contact with your connections might be. If you are interested in this particular example, just search Google for “What problem does Facebook solve?” And I’m sure you’ll find many interesting ideas for the value metrics.
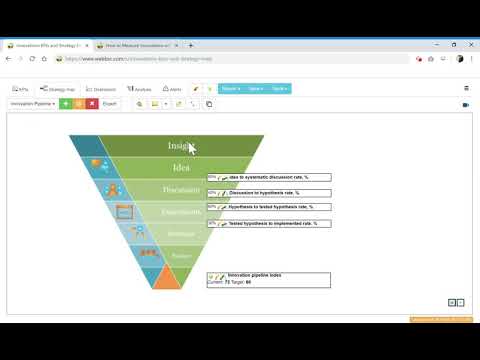
Internal Processes Perspective
To innovate, we need to have certain business processes, such as a pipeline for innovative ideas and resource allocation program:
- How the innovative ideas are generated and collected
- How the ideas are discussed
- How the hypotheses are formulated
- How the hypotheses are tested
- How the successfully tested hypotheses are scaled and implemented
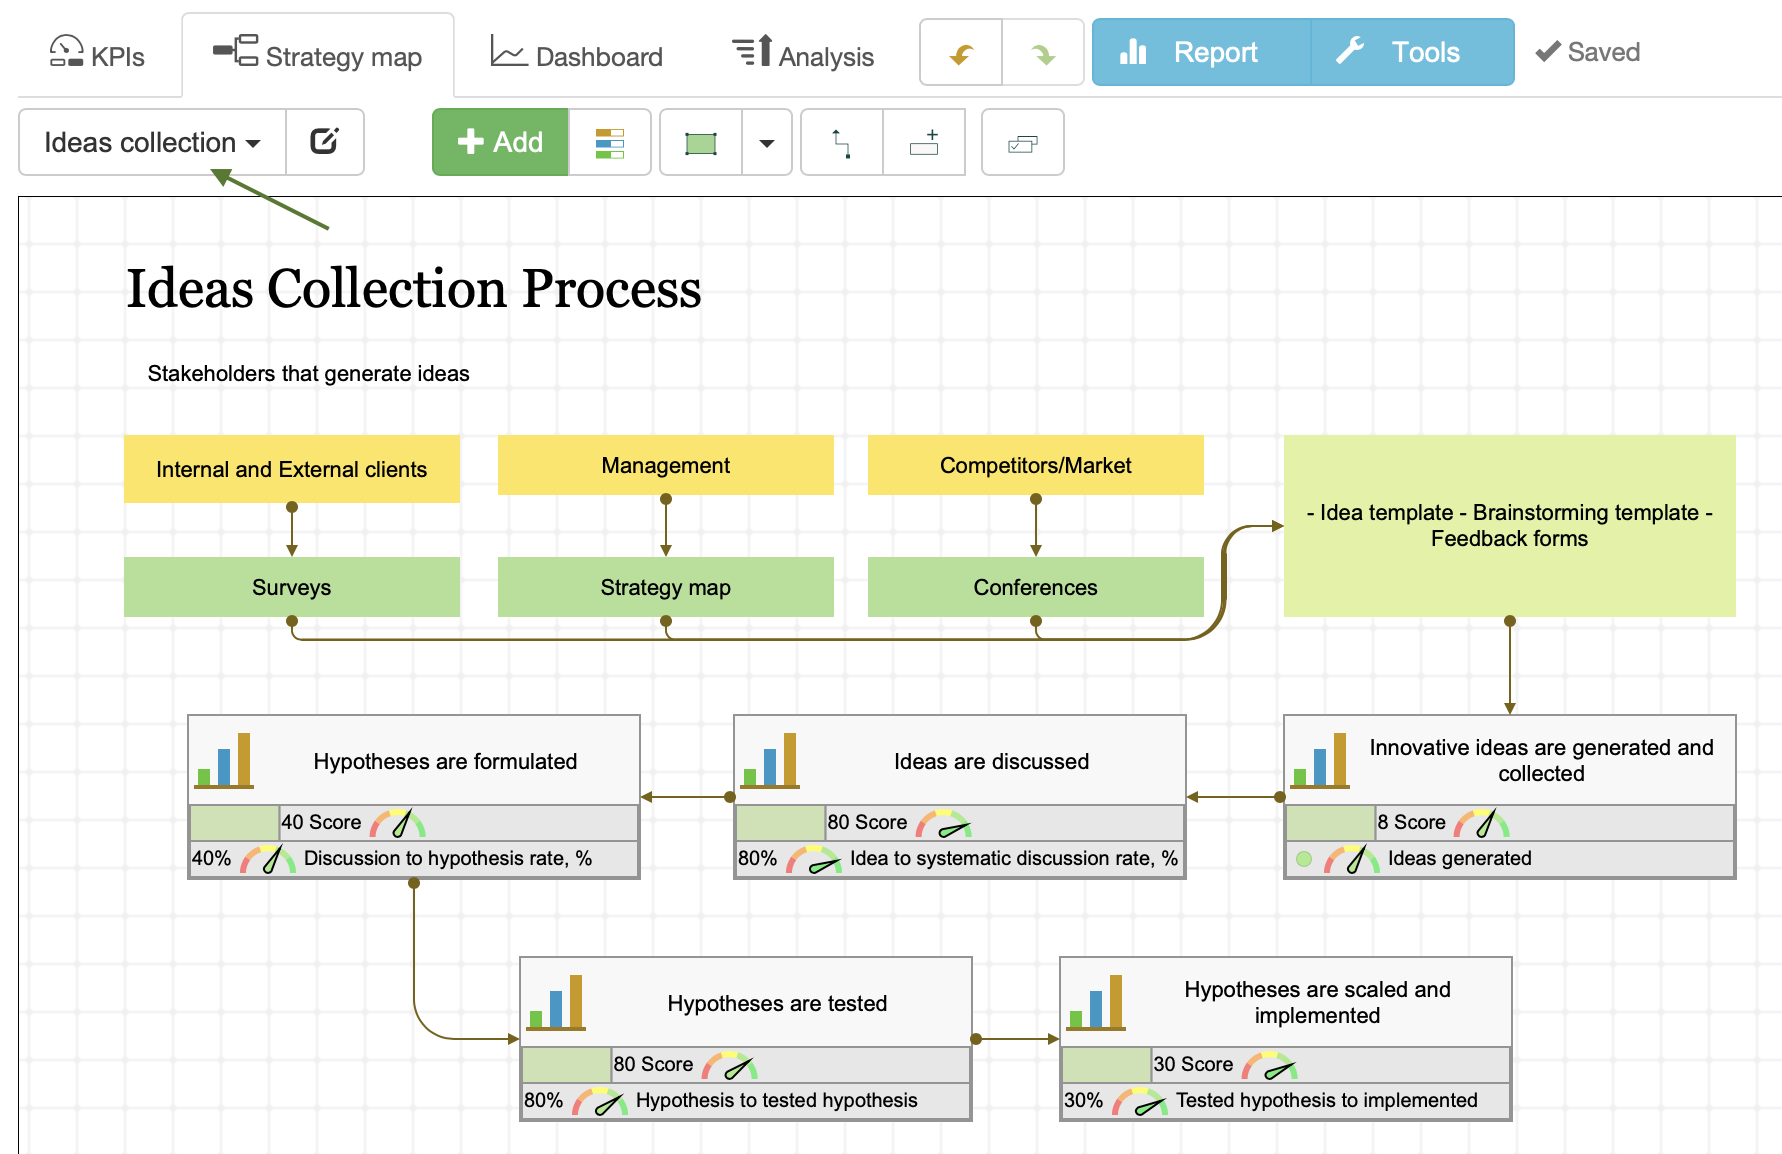
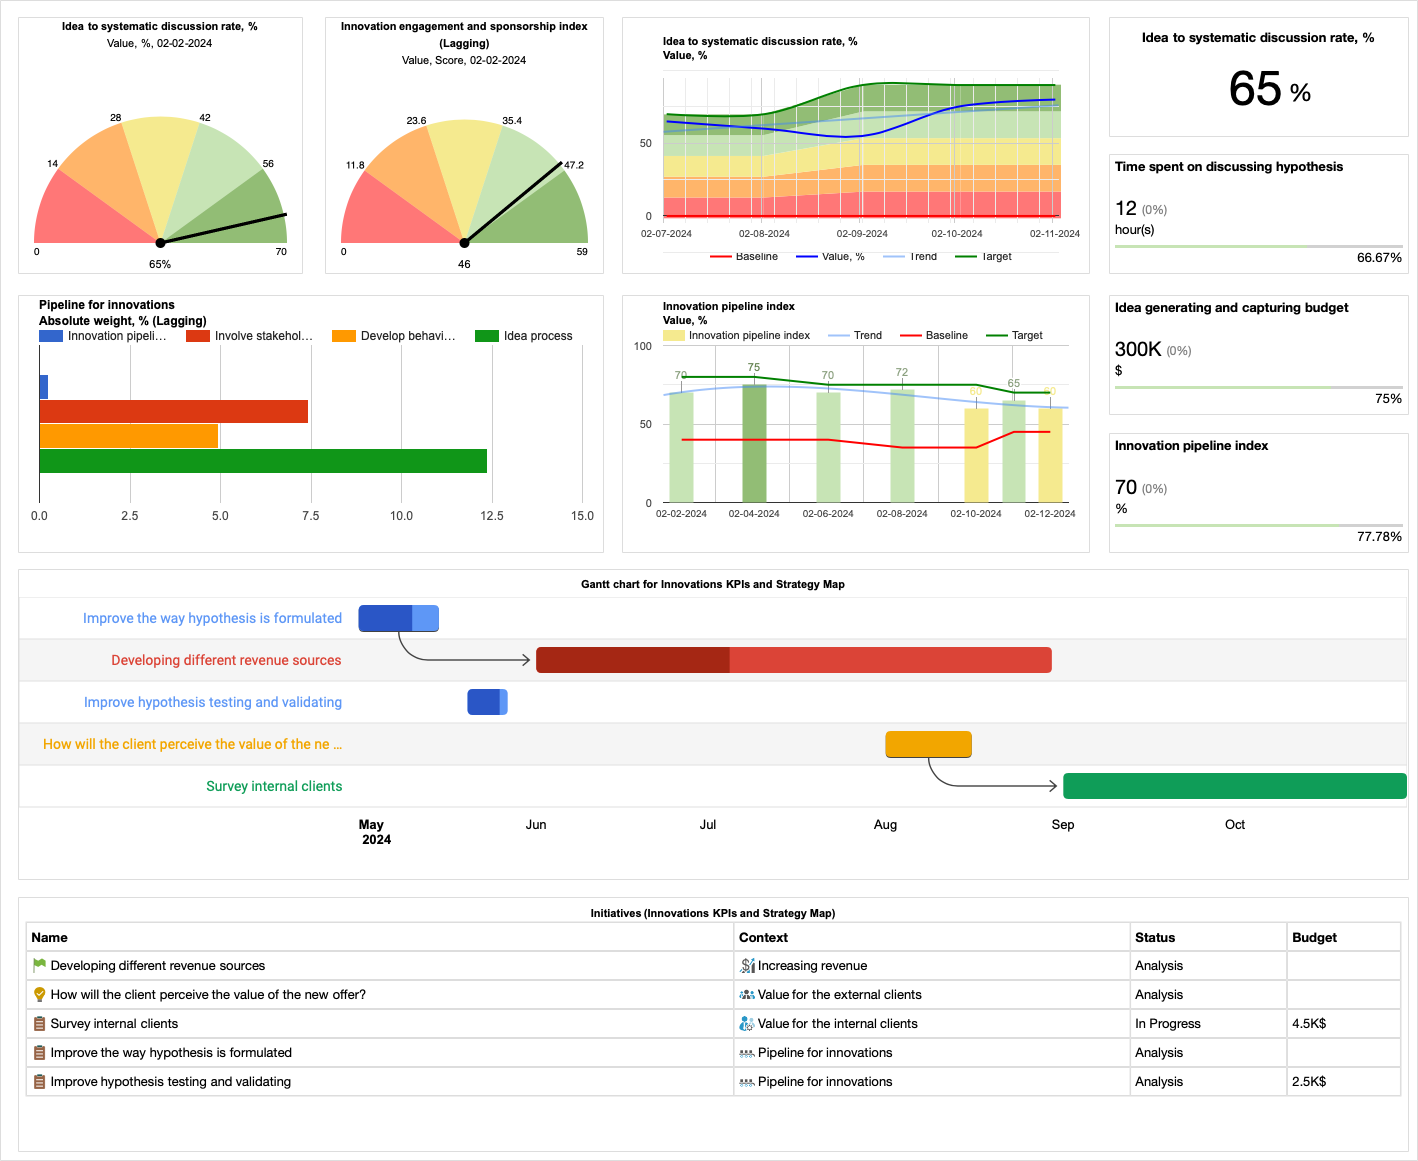
Having this innovation funnel in mind, we can start with conversion rate metrics, e.g., measure the percentage of ideas that move from one level to another:
- Idea to systematic discussion rate, %
- Discussion to hypothesis rate, %
- Hypothesis to tested hypothesis rate, %
- Tested hypothesis to implemented rate, %
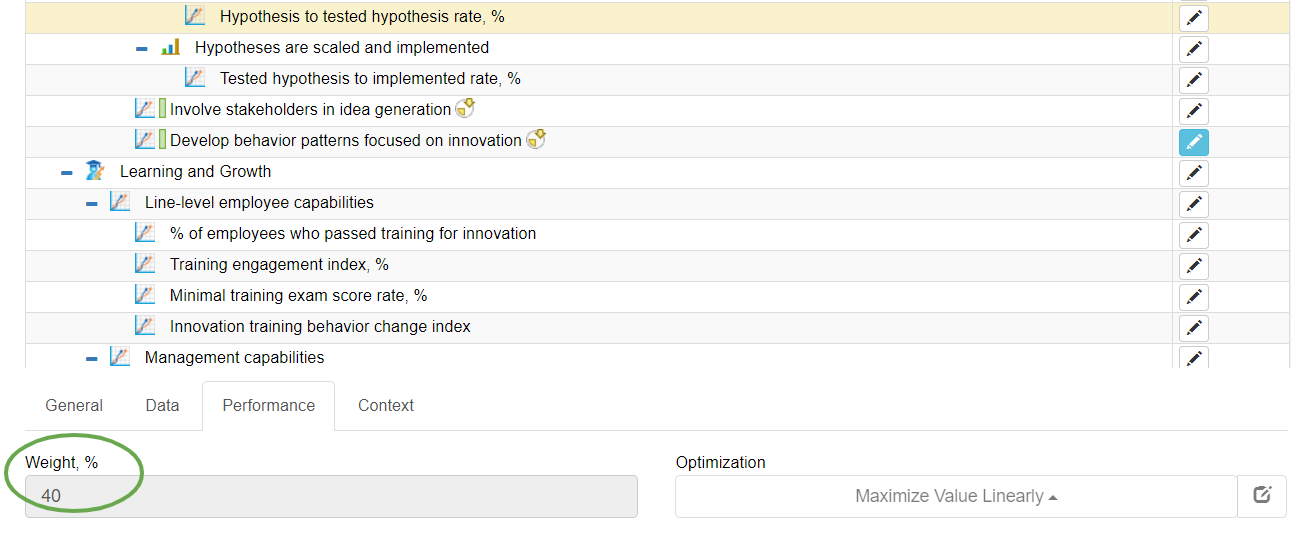
Quantifying the process in this way helps to see where the performance bottlenecks are and think about a prevention plan.
Additionally, we can pack these metrics into an “Innovation pipeline index” indicator. The metrics responsible for performance bottlenecks should be counted with a higher weight than those ones responsible for the processes that are running without any issues.
Why Having Metrics for the Process is Not Enough
The metrics for the innovation process are generally well-accepted by the team, but in many cases, this doesn’t give any impulse towards coming up with new interesting ideas. There are two reasons for that:
- The idea pool is still limited to the ideas generated by the team.
- The team follows the innovation process formally but does not adopt the new behavior patterns (or if you prefer “culture”) needed for effective innovation.
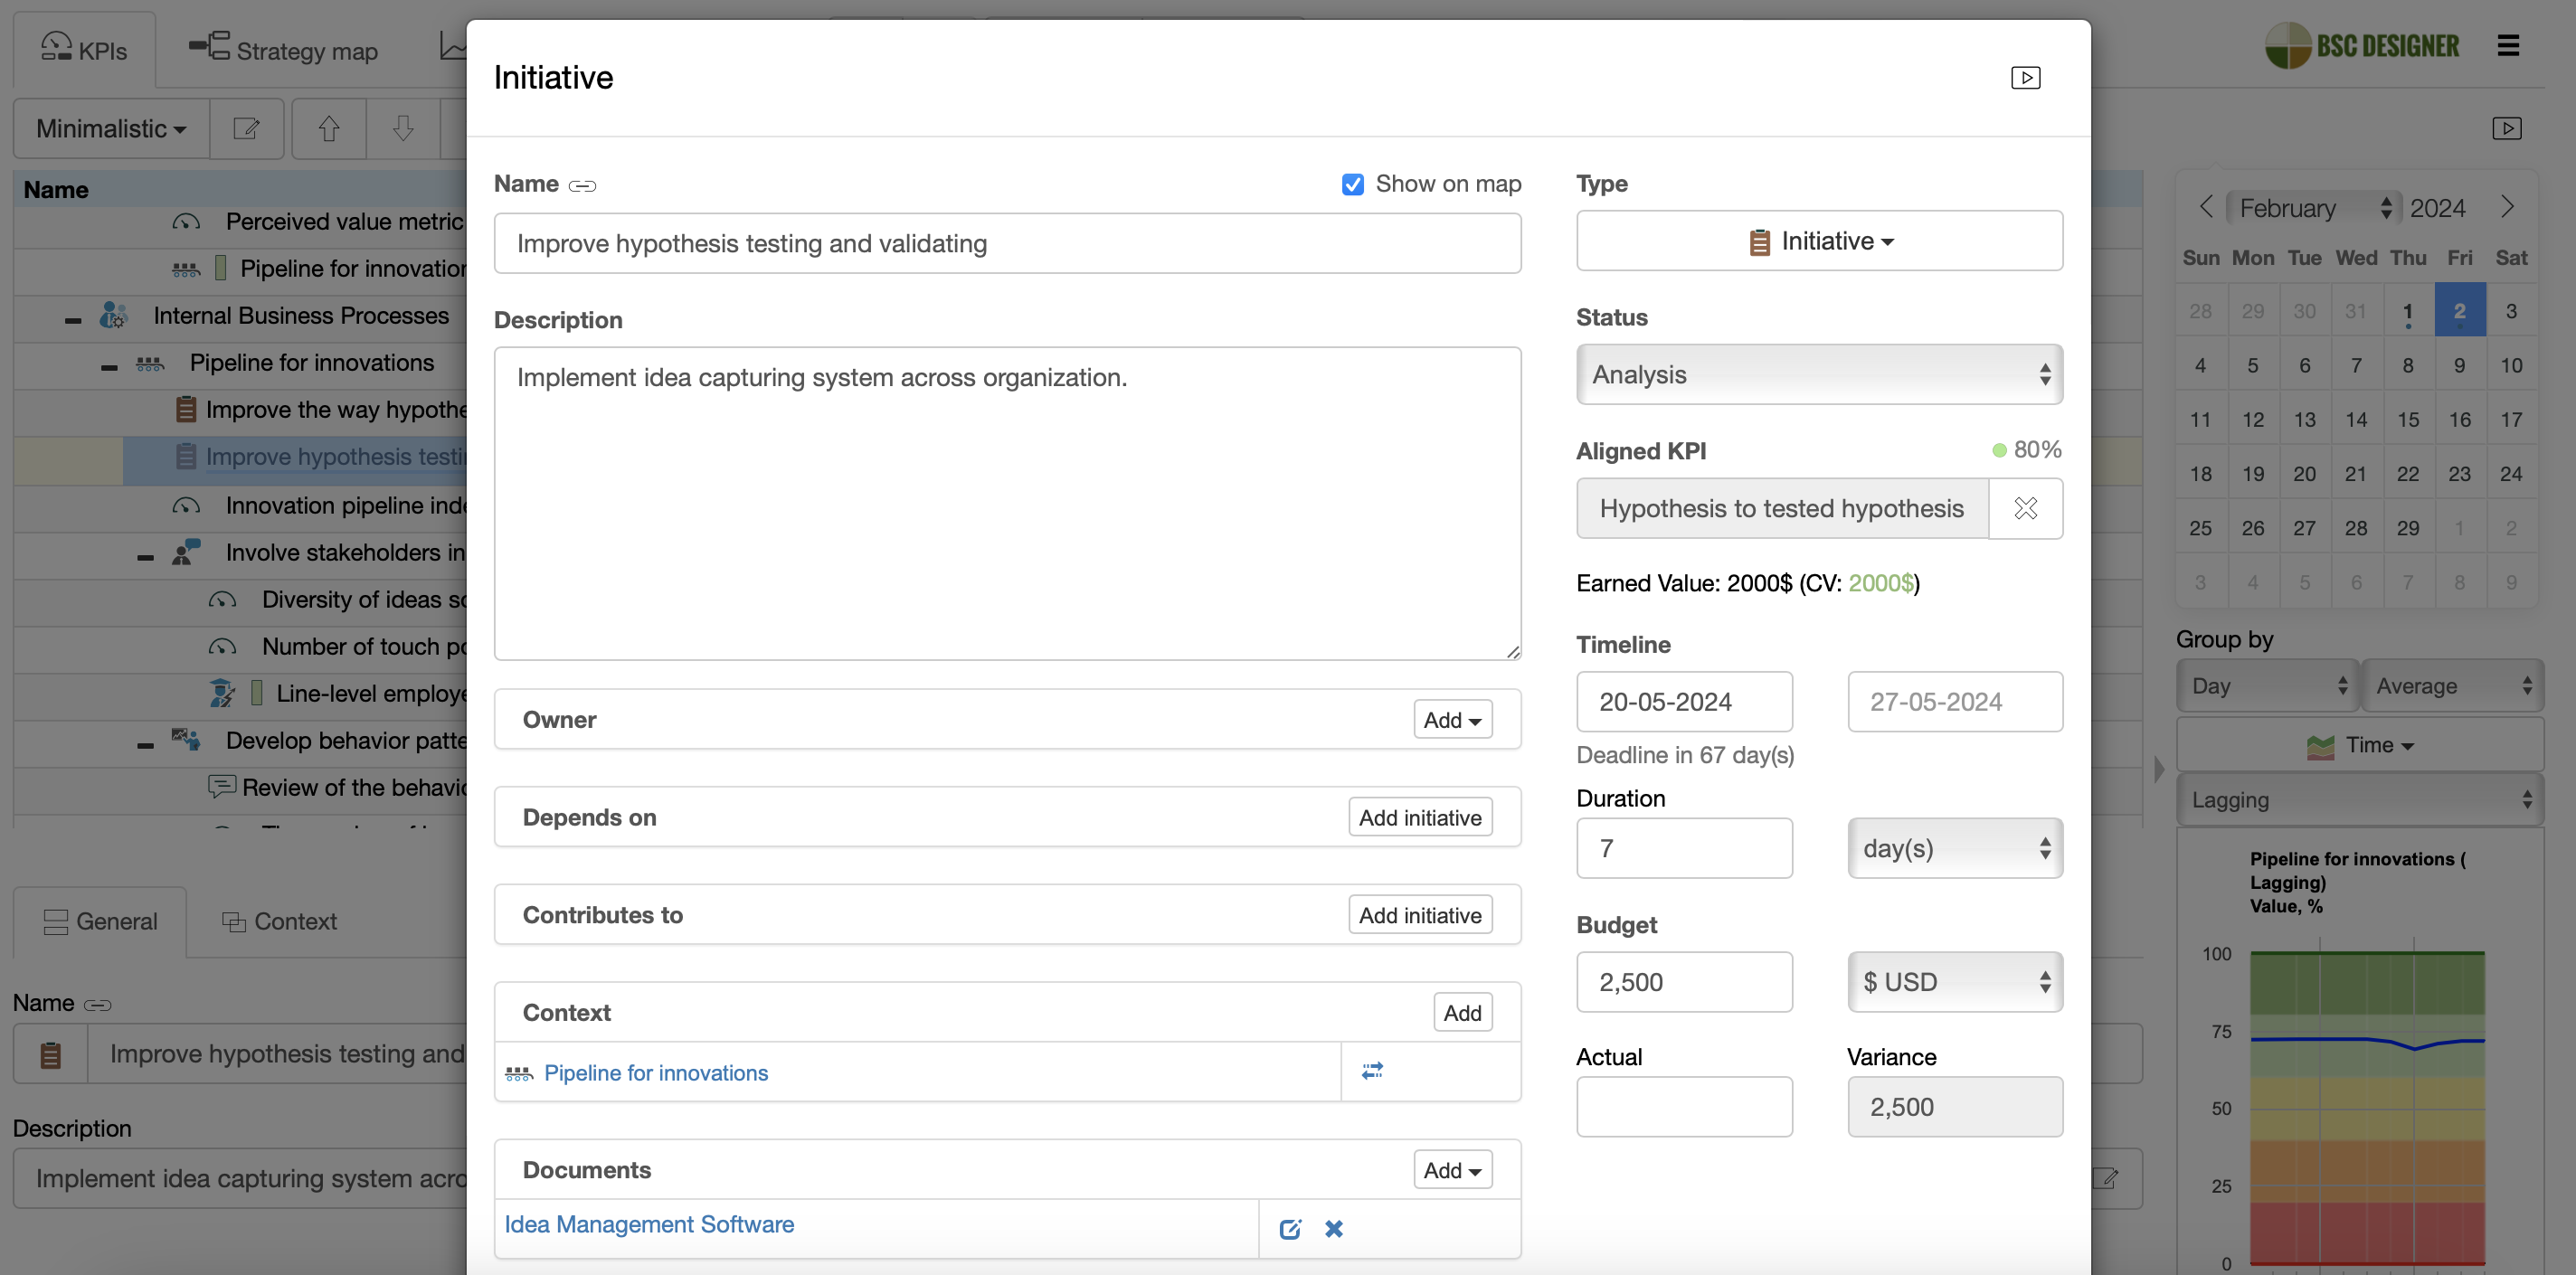
Try expressing these two goals explicitly on the strategy map.
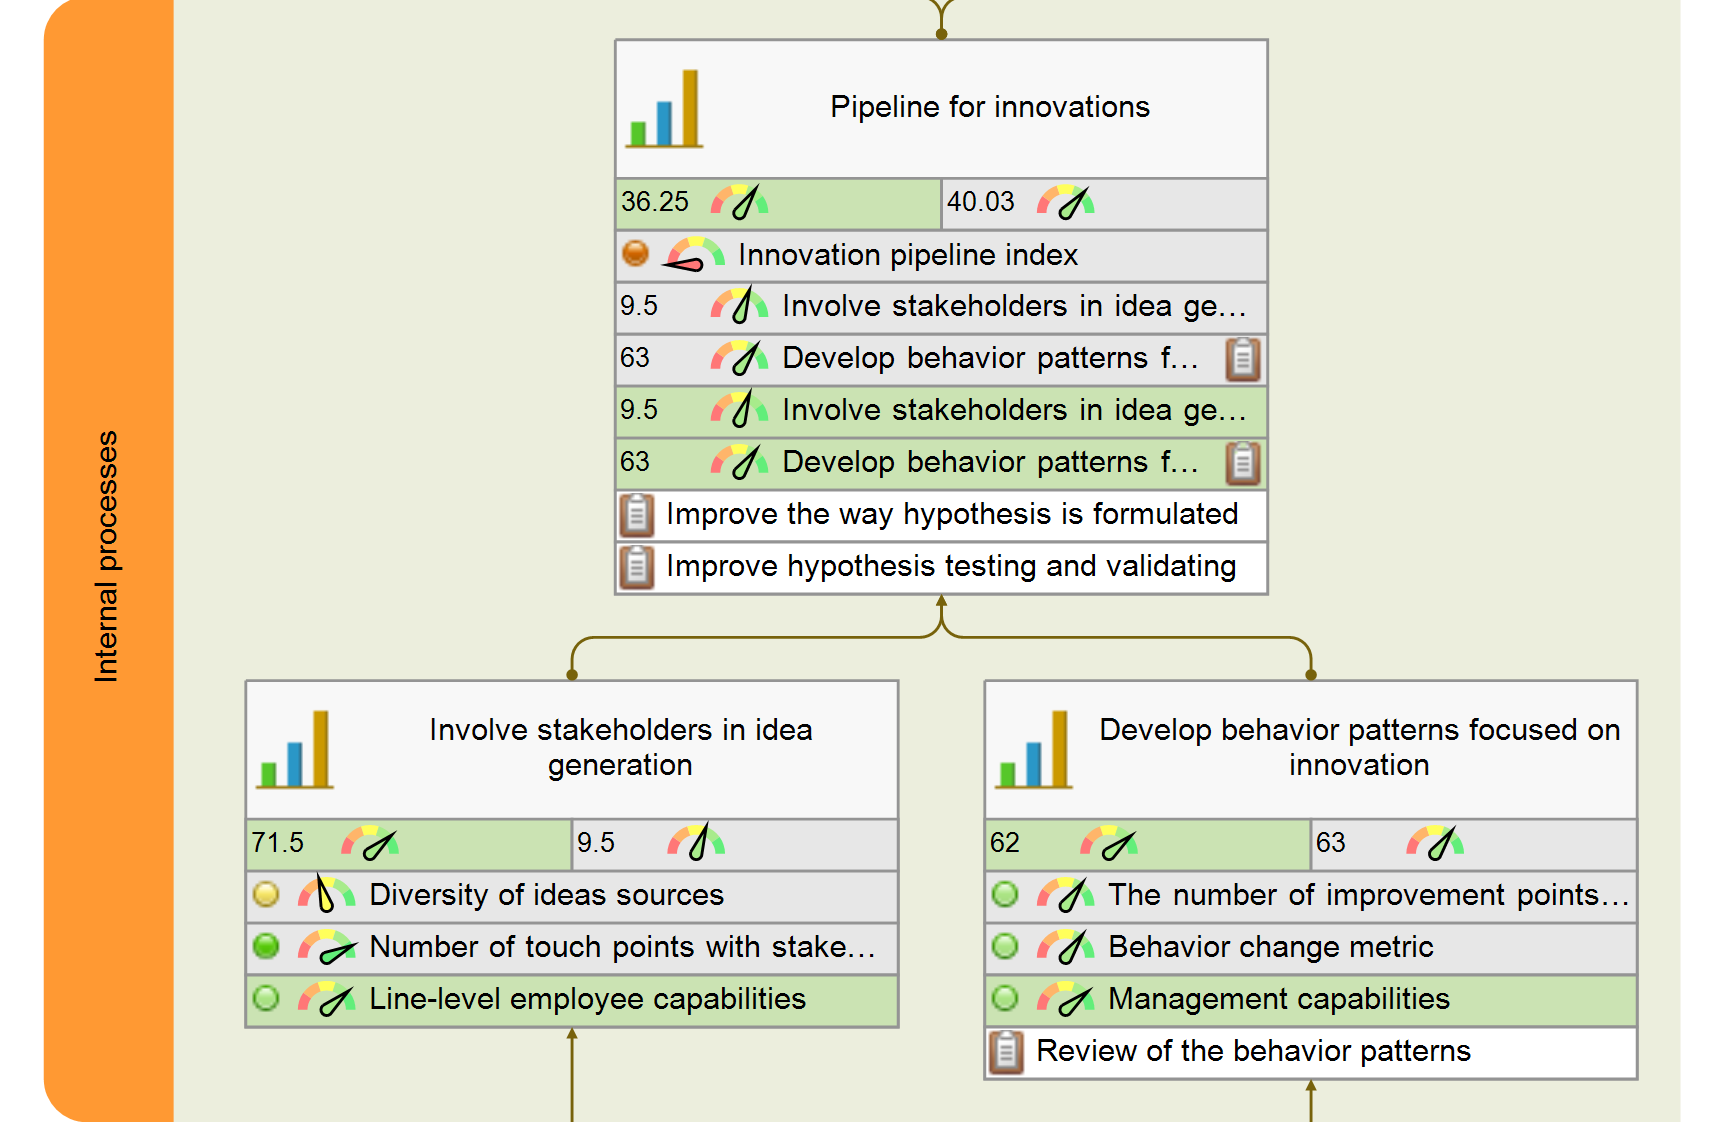
Goal: Involve stakeholders in idea generation.
- Possible metrics: The number of touch points where the idea can be obtained from the stakeholder.
For example, clients are more likely to share their ideas in a brief survey or during a personal phone call.
The lagging metric might be related to the diversity of ideas sources in general, or you might want to set a specific target to get at least 10 qualified ideas from the clients each month. Learn more about diversity and inclusion as a factor of innovations.
Goal: Develop behavior patterns focused on innovation
A regular review of the behavior patterns is a must:
- Instead of describing how you think you innovate, ask some third party to review your innovation process and describe how it is working in practice.
Such reviews will help to find improvement points. From the viewpoint of metrics, we can quantify:
- The number of improvement points found during the review (leading part) and
- Some behavior change metric (faster idea turnaround, less bureaucracy, information silos broken).
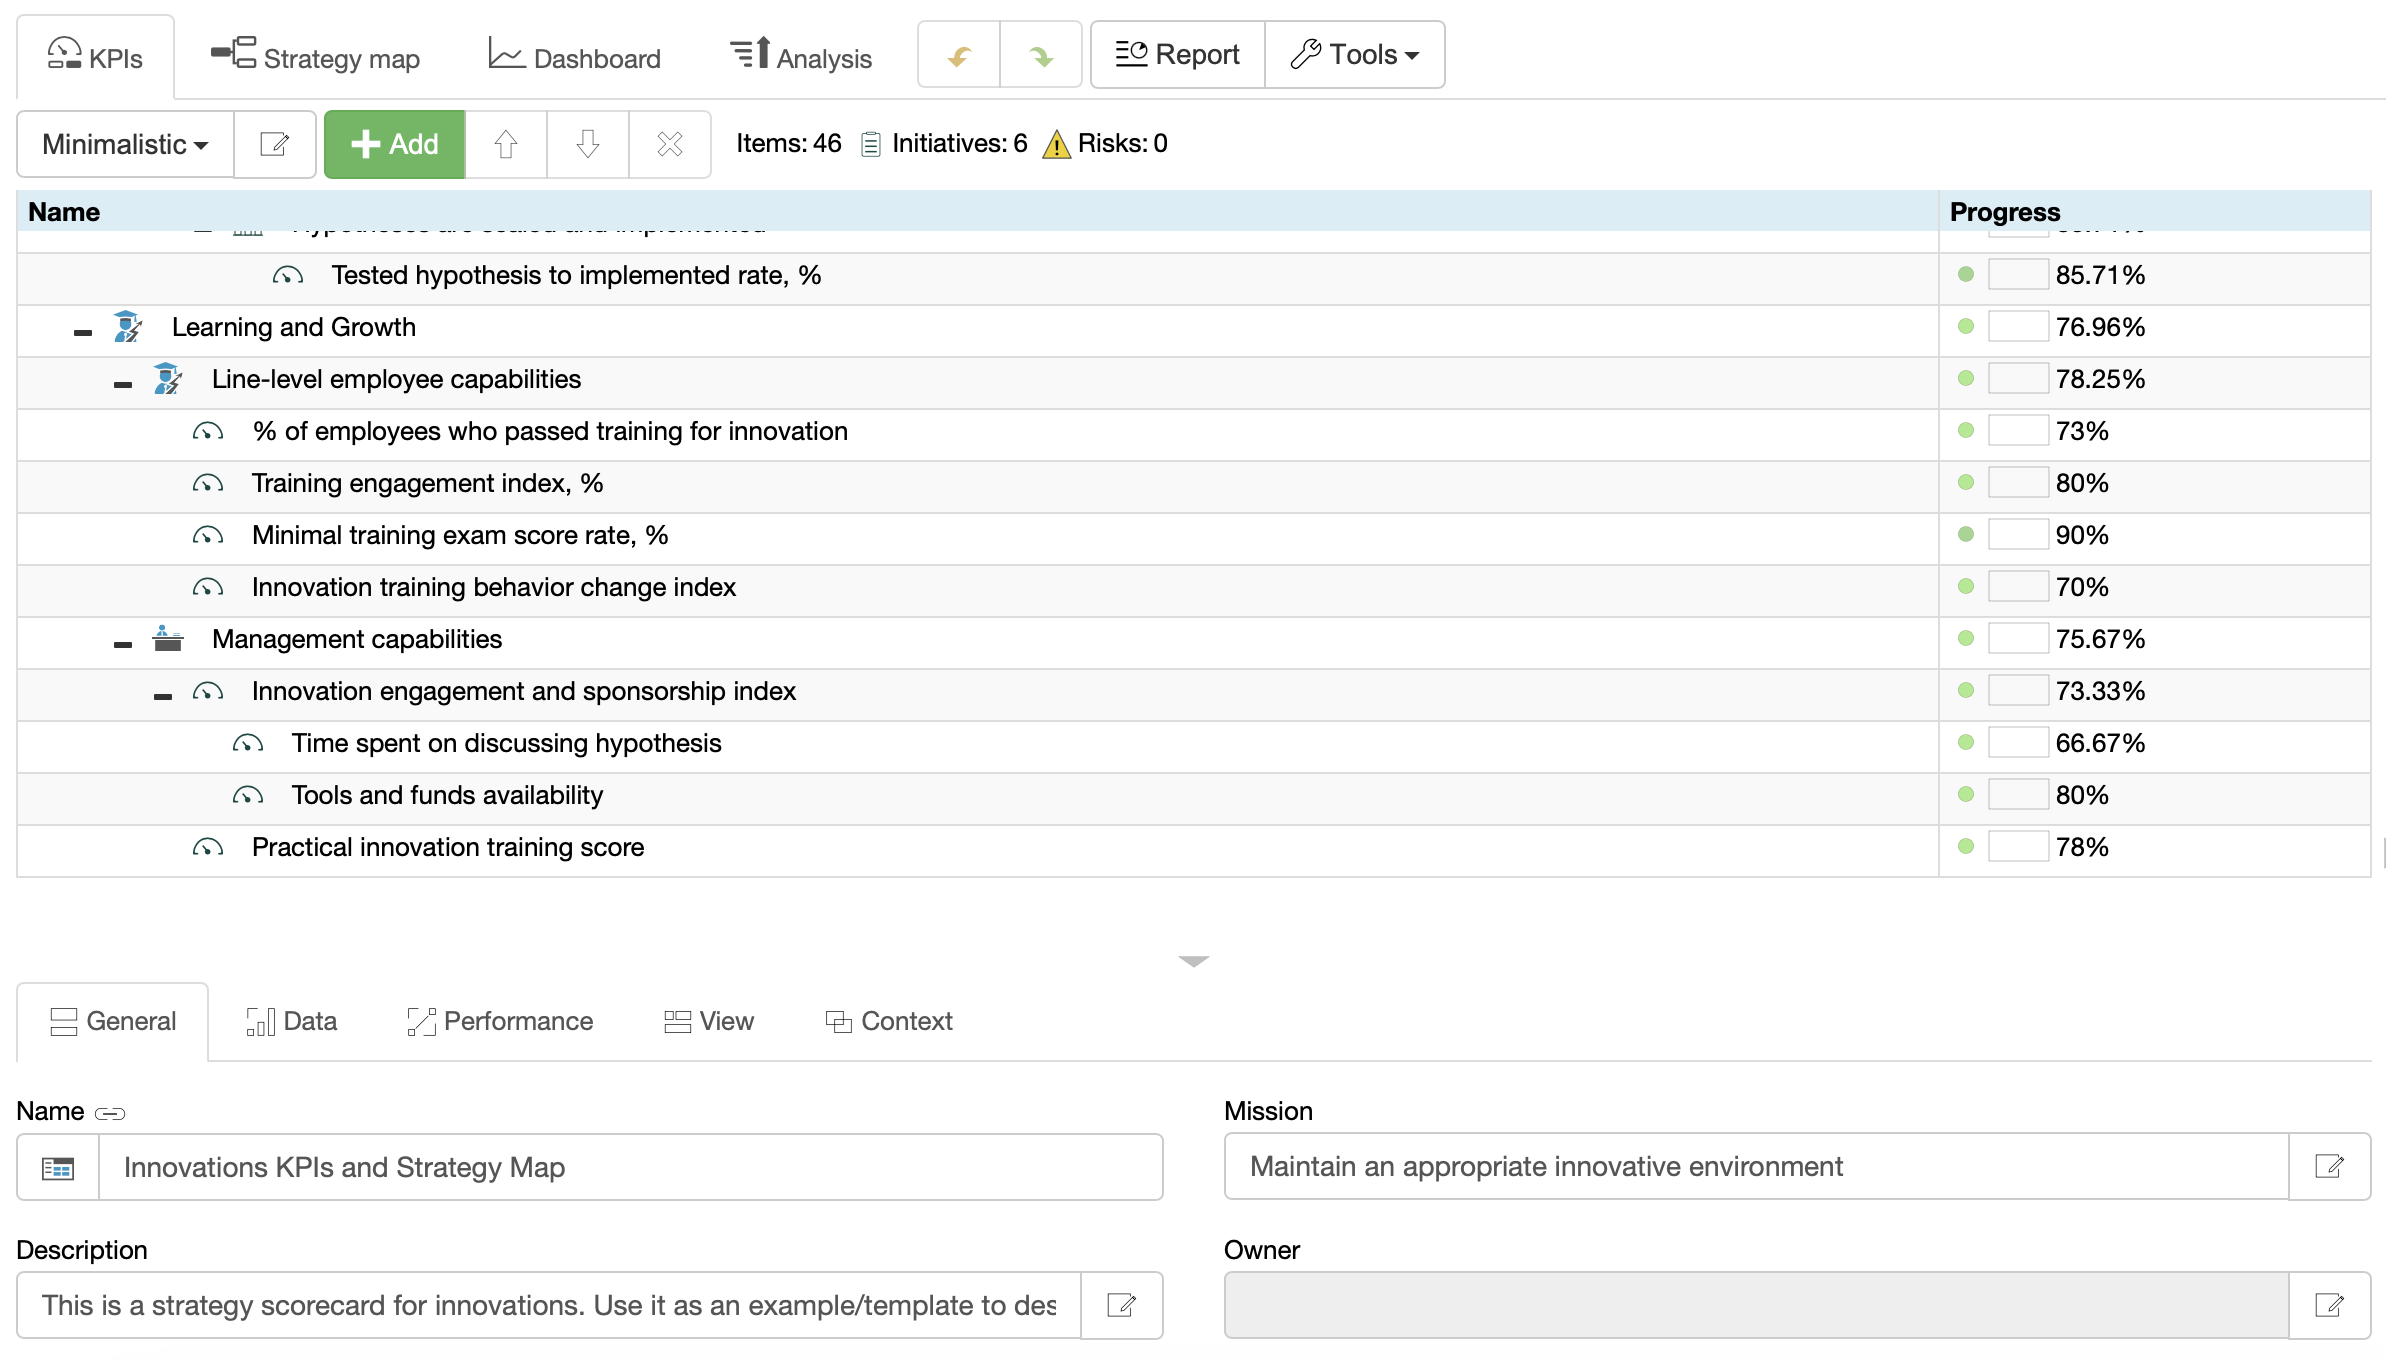
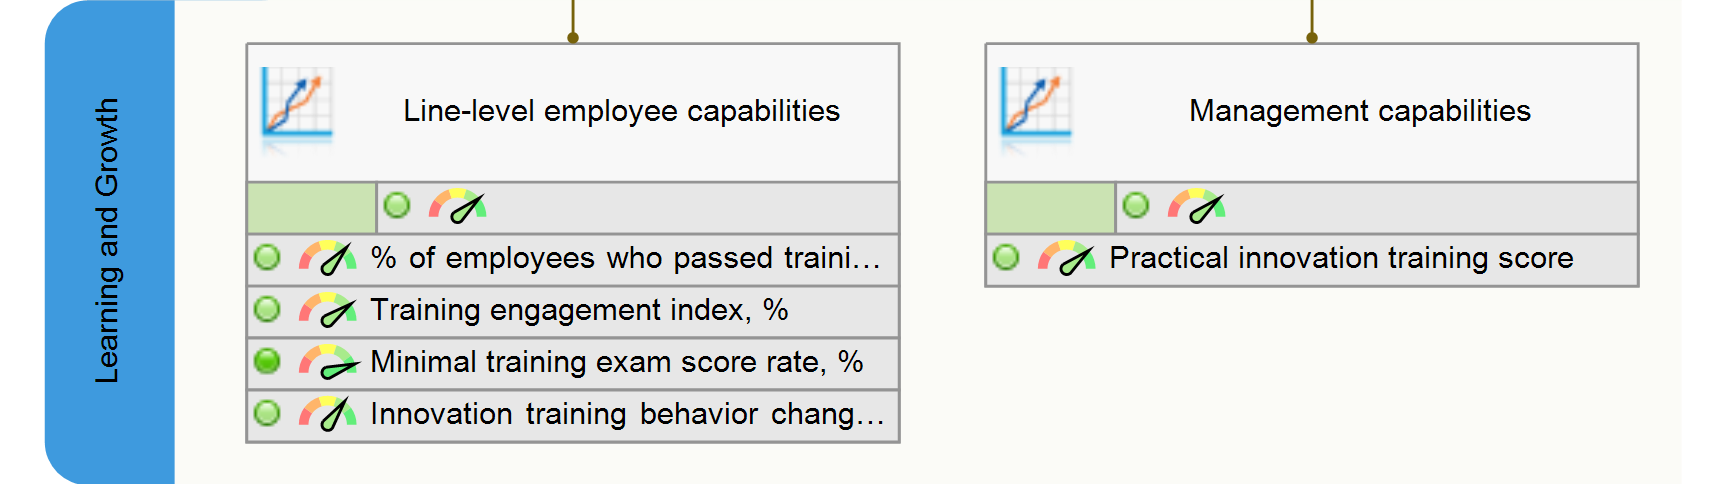
Learning and Growth Perspective
Finally, we need to understand the gap between the current capabilities of the team and the capabilities needed to innovate effectively.
- On the management side, the goal might be to spread innovation culture (allow and support experiments).
- On the line-level, the capabilities gap might be addressed by training innovations as a separate discipline.
Possible metrics:
We have discussed before the ways to track training effectiveness 4. The metrics could be:
- % of employees who passed training for innovation
- Training engagement index, %
- Minimal training exam score rate, %
- Innovation training behavior change index
From the leadership perspective:
- Training metrics (similar to ones above)
- Innovation engagement and sponsorship index (basic metrics are: time spent on discussing-promoting hypothesis; tools and funds availability)
Building a Strategy Map
Now, we can build a strategy map that would describe an approach of the organization to the innovations.
It’s a good idea to look at the list of the stakeholders and ask a question:
“What business system (and later capabilities) do we need to have to work with this stakeholder effectively?”
For example, “clients” were mentioned as a stakeholder that helps to generate and validate the ideas. What does it mean for the strategy of your organization:
- Is there a good way to get an idea from the customers? Like, for example, properly implemented surveys?
- Is there a quick way to validate new ideas with customers?
- Does your team have enough capabilities to read “between-line” the needs of the client?
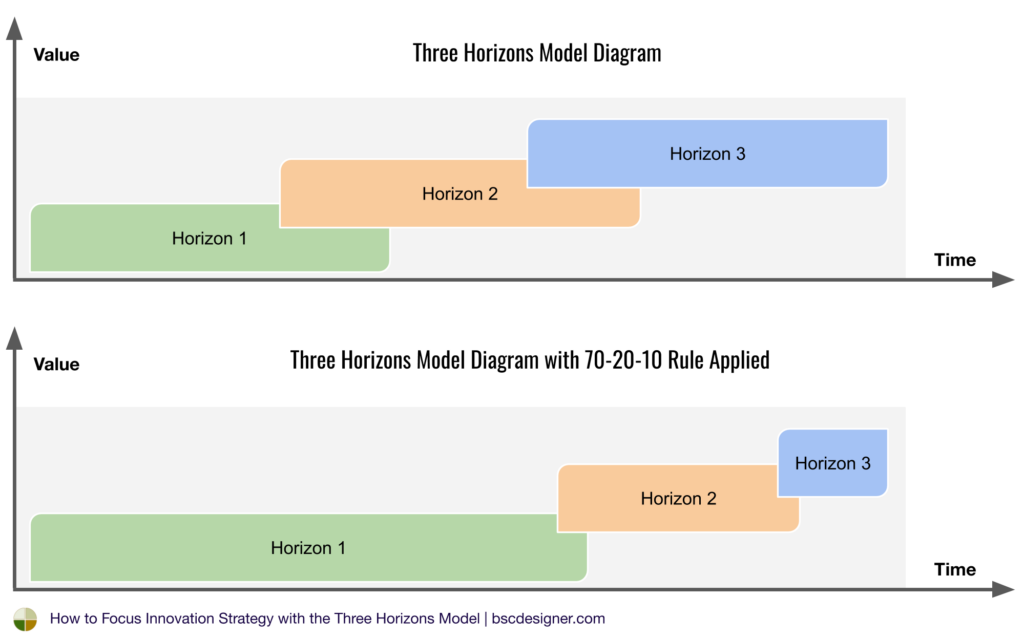
High-Level Business Growth and Innovations Framework
Above, we have discussed examples of some specific metrics to track innovation efforts. If you are looking for a more general framework that would help you to organize thoughts about business growth on the high level, then check out the ideas of the McKinsey’s Three Horizons Framework.
A Road Map to Measure Innovations
Here are some thoughts about a road map for innovation measurement.
- Diagnose the current situation in your organization (see the “quick estimation” section).
- Build an innovation pipeline, visualize the way that an innovation passes from the level of idea to the level of commercial product.
- Build a strategy map for innovations in your organization. The one discussed in this article might be a good starting point, but make sure you customize it according to your needs.
- Make sure that the innovation strategy is not a standalone product but is part of a company’s strategy.
How Such Approach Helps
What can we expect from following this disciplined approach to the innovations?
- Understanding readiness for the innovations on the level of business systems and team capabilities.
- The ability to better justify certain activities
- Switching a focus from lagging financial metrics to the leading capabilities and business system metrics.
- Finding performance problems and fixing them at an early stage.
- Filtering innovations that don´t fit the overall strategy.
- Formalizing innovations in the form of change management initiatives
- Follow our
 Strategy Implementation System to align stakeholders, strategic ambitions, and business frameworks into a comprehensive strategy.
 - Automate strategic planning with BSC Designer by organizing goals, initiatives, risks, and KPIs into scorecards.
More About Strategic Planning


Do you know an interesting case about measuring and managing innovations? Feel free to share in the comments!
- Innovation and commercialization, 2010: McKinsey Global Survey results ↩
- 10 Step KPI System, Aleksey Savkin, Lulu.com, 2017 ↩
- The value of co-innovation, Institut Cerdà ↩
- Training Scorecard: From Exam Scores to KPI Effectiveness, Aleksey Savkin, bscdesigner.com, 2016 ↩
![]() CEO | Author | Speaker
CEO | Author | Speaker
BSC Designer is strategy execution software that enhances strategy formulation and execution through tangible KPIs. Our proprietary strategy implementation system reflects our practical experience in the strategy domain.