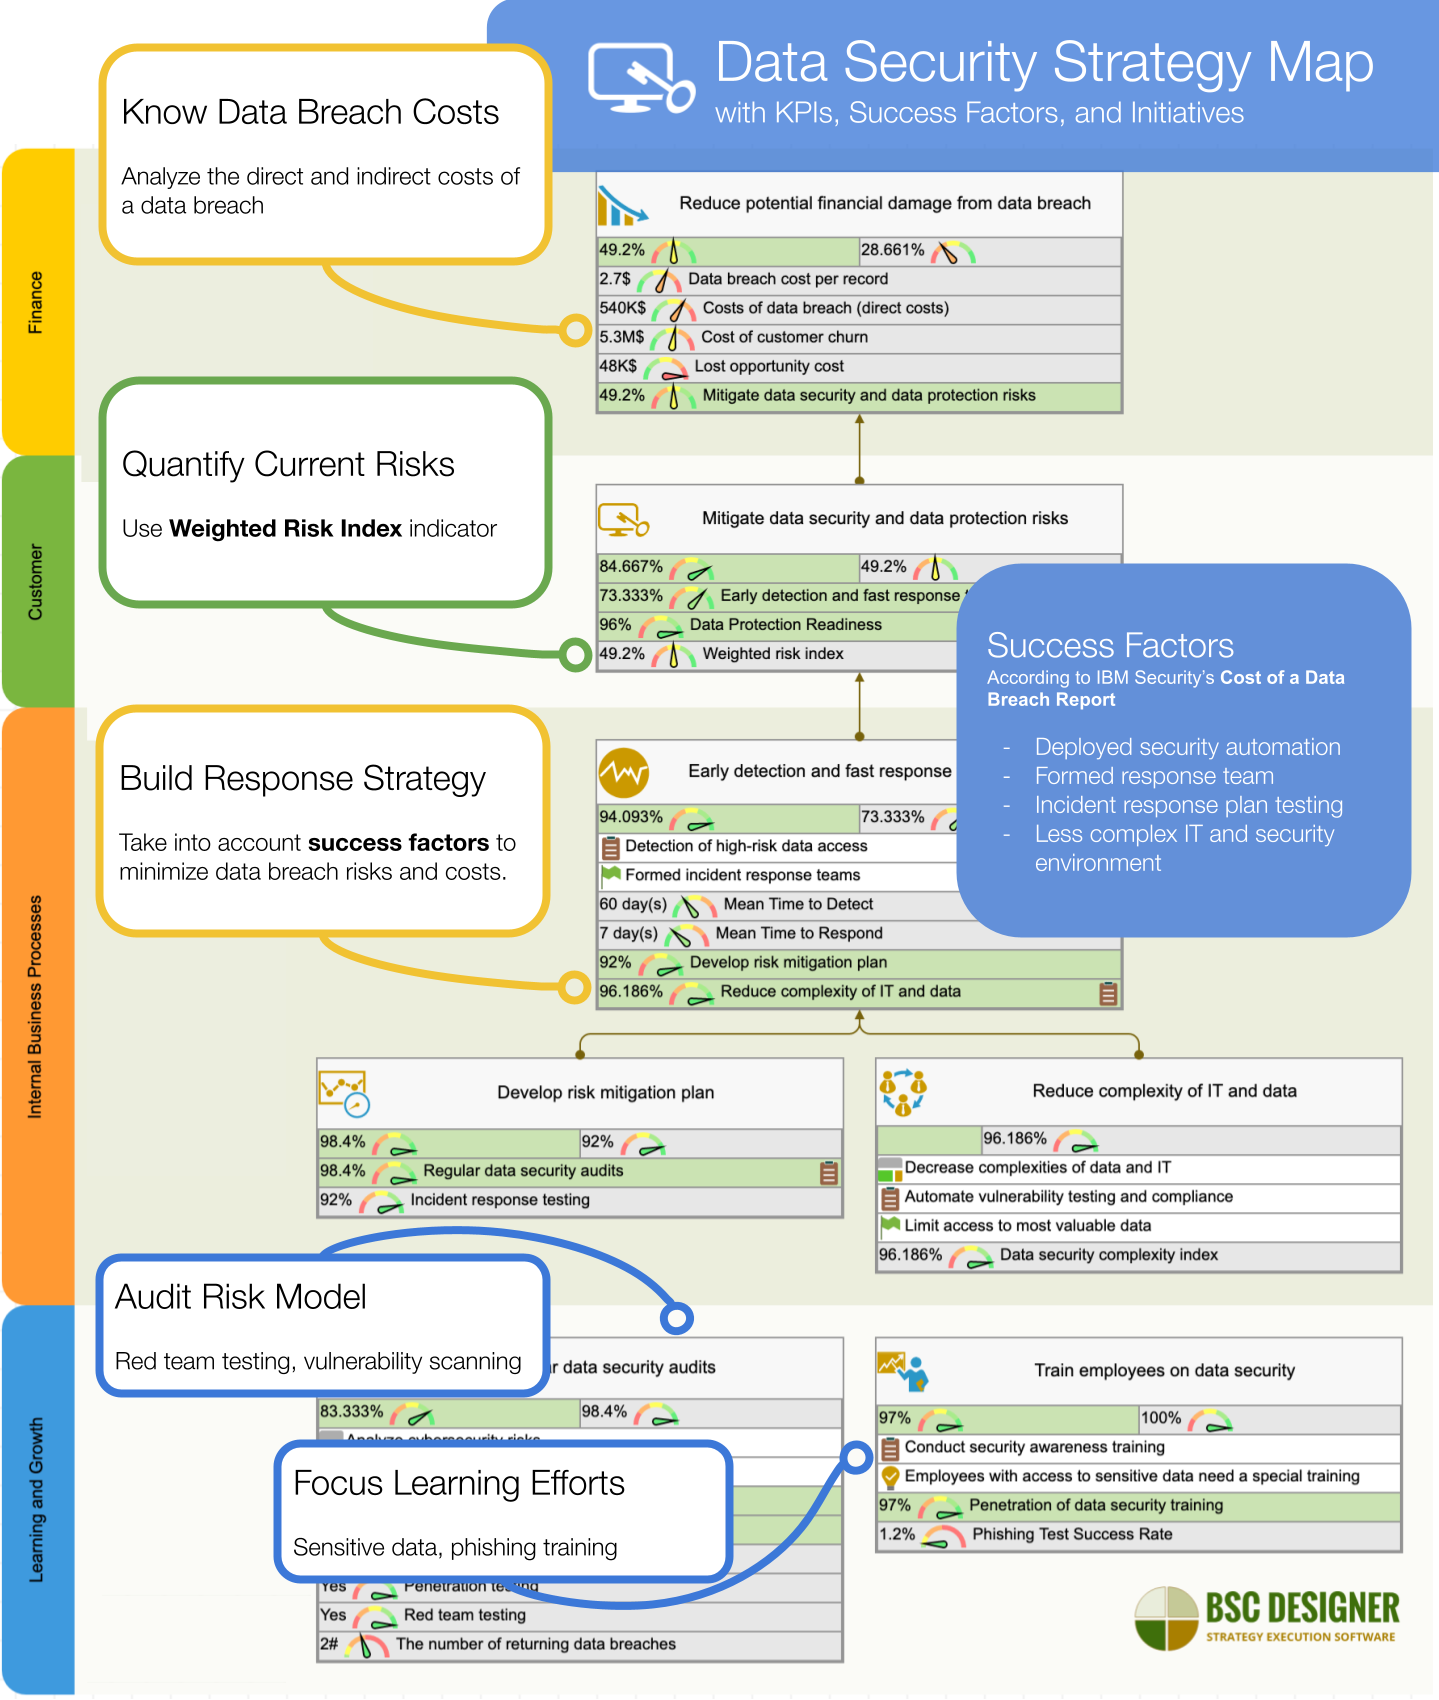
An example of a strategy scorecard with performance indicators that addresses the emerging trends of cybersecurity.
Key topics of the article:
Starting Point: Data Security Studies
Regular studies on data security and data protection give us a good idea about the root cause of data breaches and the ways to prevent them. In this article, we’ll discuss an example of how those findings can be combined into a comprehensive cybersecurity strategy measurable by KPIs.
Here are the reports that we are going to use as a reference:
- Cost of Data Breach Report by IBM1 with studies conducted by the Ponemon Institute is one of the benchmarks in the world of IT security.
- Verizon’s Data Breach Investigations Report2 adds a different perspective about the cybersecurity risks and the ways to address them.
- EY Global Information Security Survey3 shares the best practices that organizations implement to address data security risks.
- FireEye M-TRENDS Report4 reports on the data security threats and their evolution over time.
Terminology: Cybersecurity, Data Security, Data Protection, Data Privacy
Let’s start with the discussion of the difference between data/information security and data protection (data privacy) terms.
- Data/information security is about maintaining secure architecture to manage data. Think about regular backups, up-to-date security software, access rights, implementing DLP software, etc.
- Data protection is about the ethical and legal use of data – getting consent and following regulatory obligations.
This difference is important. For example, in the Facebook–Cambridge Analytica case, data was managed securely (was encrypted and stored on a secure server), but it was not managed responsibly according to the data protection regulations.
The Data protection term is mostly used in Europe and Asia, while in the U.S., the same concept is called data privacy. Françoise Gilbert shared a good explanation of the differences in her blog.
Finally, a cybersecurity term is supposed to cover a wider range of ideas, including not only data security but other security systems. In practice, it is often used interchangeably with the data security term.
Why Do We Need Cybersecurity KPIs and Strategy?
Beyond the obvious ideas, like knowing how your organization is doing and understanding the direction to move to, I’d mention these reasons:
- Be able to support arguments with some data when presenting new security solutions to the stakeholders.
- Having a formulated business context helps align cybersecurity initiatives to other parts of the strategy, for example, to the Talent scorecard, IT scorecard, or corporate governance scorecard.
- Converting some vague ideas like “highly-secure business environment that leverages the latest IT technologies” into something more tangible with specific performance indicators.
How to Measure Something that Has Not Happened Yet
It might look that data security is something intangible and hard to quantify and measure, as we never know beforehand what kind of data breach an organization will face. The empirical studies mentioned in the beginning (see, for example, IBM Security report) share a different point of view.
Most of the data breaches are caused by known factors like:
- Compromised credentials (19%)
- Phishing (14%)
- Cloud misconfiguration (19%)
This gives us an idea of where the cybersecurity efforts should be focused on.
While we cannot prevent all data breaches, the data shows that we can minimize their impact on the organization by:
- Implementing security automation,
- Having a response team and response plan ready,
- Educating employees, and
- Testing business environment using approaches like red team testing.
What Business Frameworks are Applicable for Data Security?
Before, we discussed various business frameworks that help organizations to articulate and execute their strategies. What frameworks are applicable for a cybersecurity domain?
For the best results, we need to combine various frameworks:
- We will use PESTEL analysis to detect and analyze the new factors of the external environment (see the goals from Learning and Growth perspective). Those can be changes in legislation, like data protection laws, or disruptive changes that we saw after Covid-19, for example, the remote work trend.
- We will talk a lot about focusing on response efforts. In this context, various prioritization frameworks will help.
- When working on a data security strategy, we need to take into account actions that are required today, in the near future, and some initiatives for the remote future. In this context, the Three Horizons framework will help to do disciplined discussions.
- To convert all those disconnected ideas into a coherent strategy, we’ll use the Balanced Scorecard framework.
Let’s use the mentioned business frameworks and research reports referenced in the beginning to create an example of data security strategy.
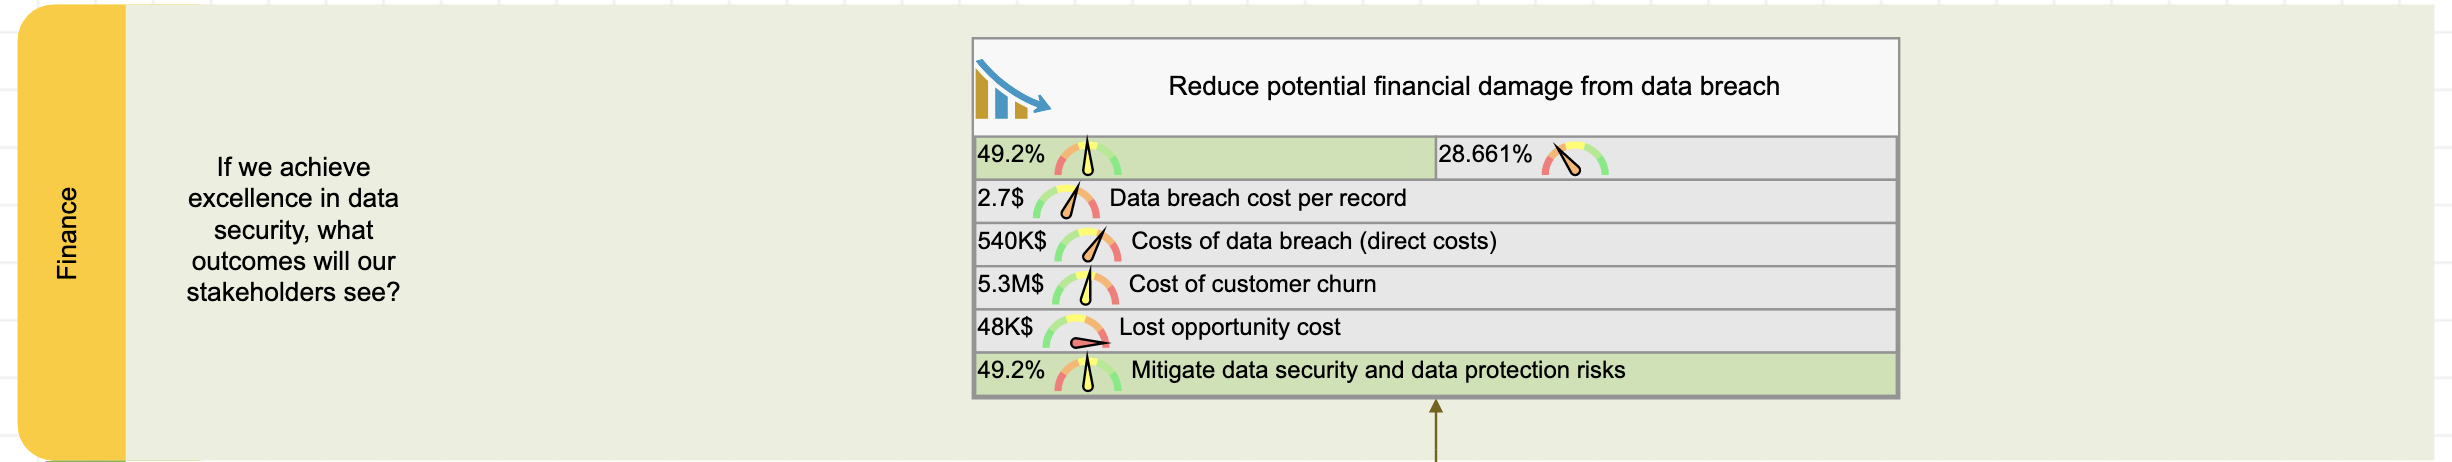
Financial Perspective. Estimating the Financial Impact of Data Security
Financial KPIs for data security are a must when presenting security initiatives to the stakeholders. The presentation looks even more impressive when relevant industry benchmarks can be provided.
Verizon´s report, as well as IBM´s report (conducted by Ponemon Institute), share some insights in this context. Sometimes, data is contradictory. For example, you will find that the costs of a data breach per record vary significantly. IBM´s report gives a range of $150-$175, while according to Verizon’s report (see the Data Breach Investigations Report, 2015), it is around $0.58. Ken Spinner shared some explanations on the topic in TeachBeacon.
How can you estimate the data breach costs in the case of your organization?
It can be based on the direct and indirect costs:
- Direct costs include the cost of forensic analysis, fines, compensations to the customers.
- Indirect costs refer to the loss of existing and potential customers, employees, partners that happened due to a data breach.
On the data security scorecard, we can take some benchmarks from the Ponemon or Verizon studies for the Data breach cost per record metric and multiply it by the number of records at risk.
To do the calculations, we will need to have some basic business data:
- LTV (customer lifetime value)
- Estimation of customer churn due to data breach
- Number of customers
- Number of records at risk
- Potential customers lost
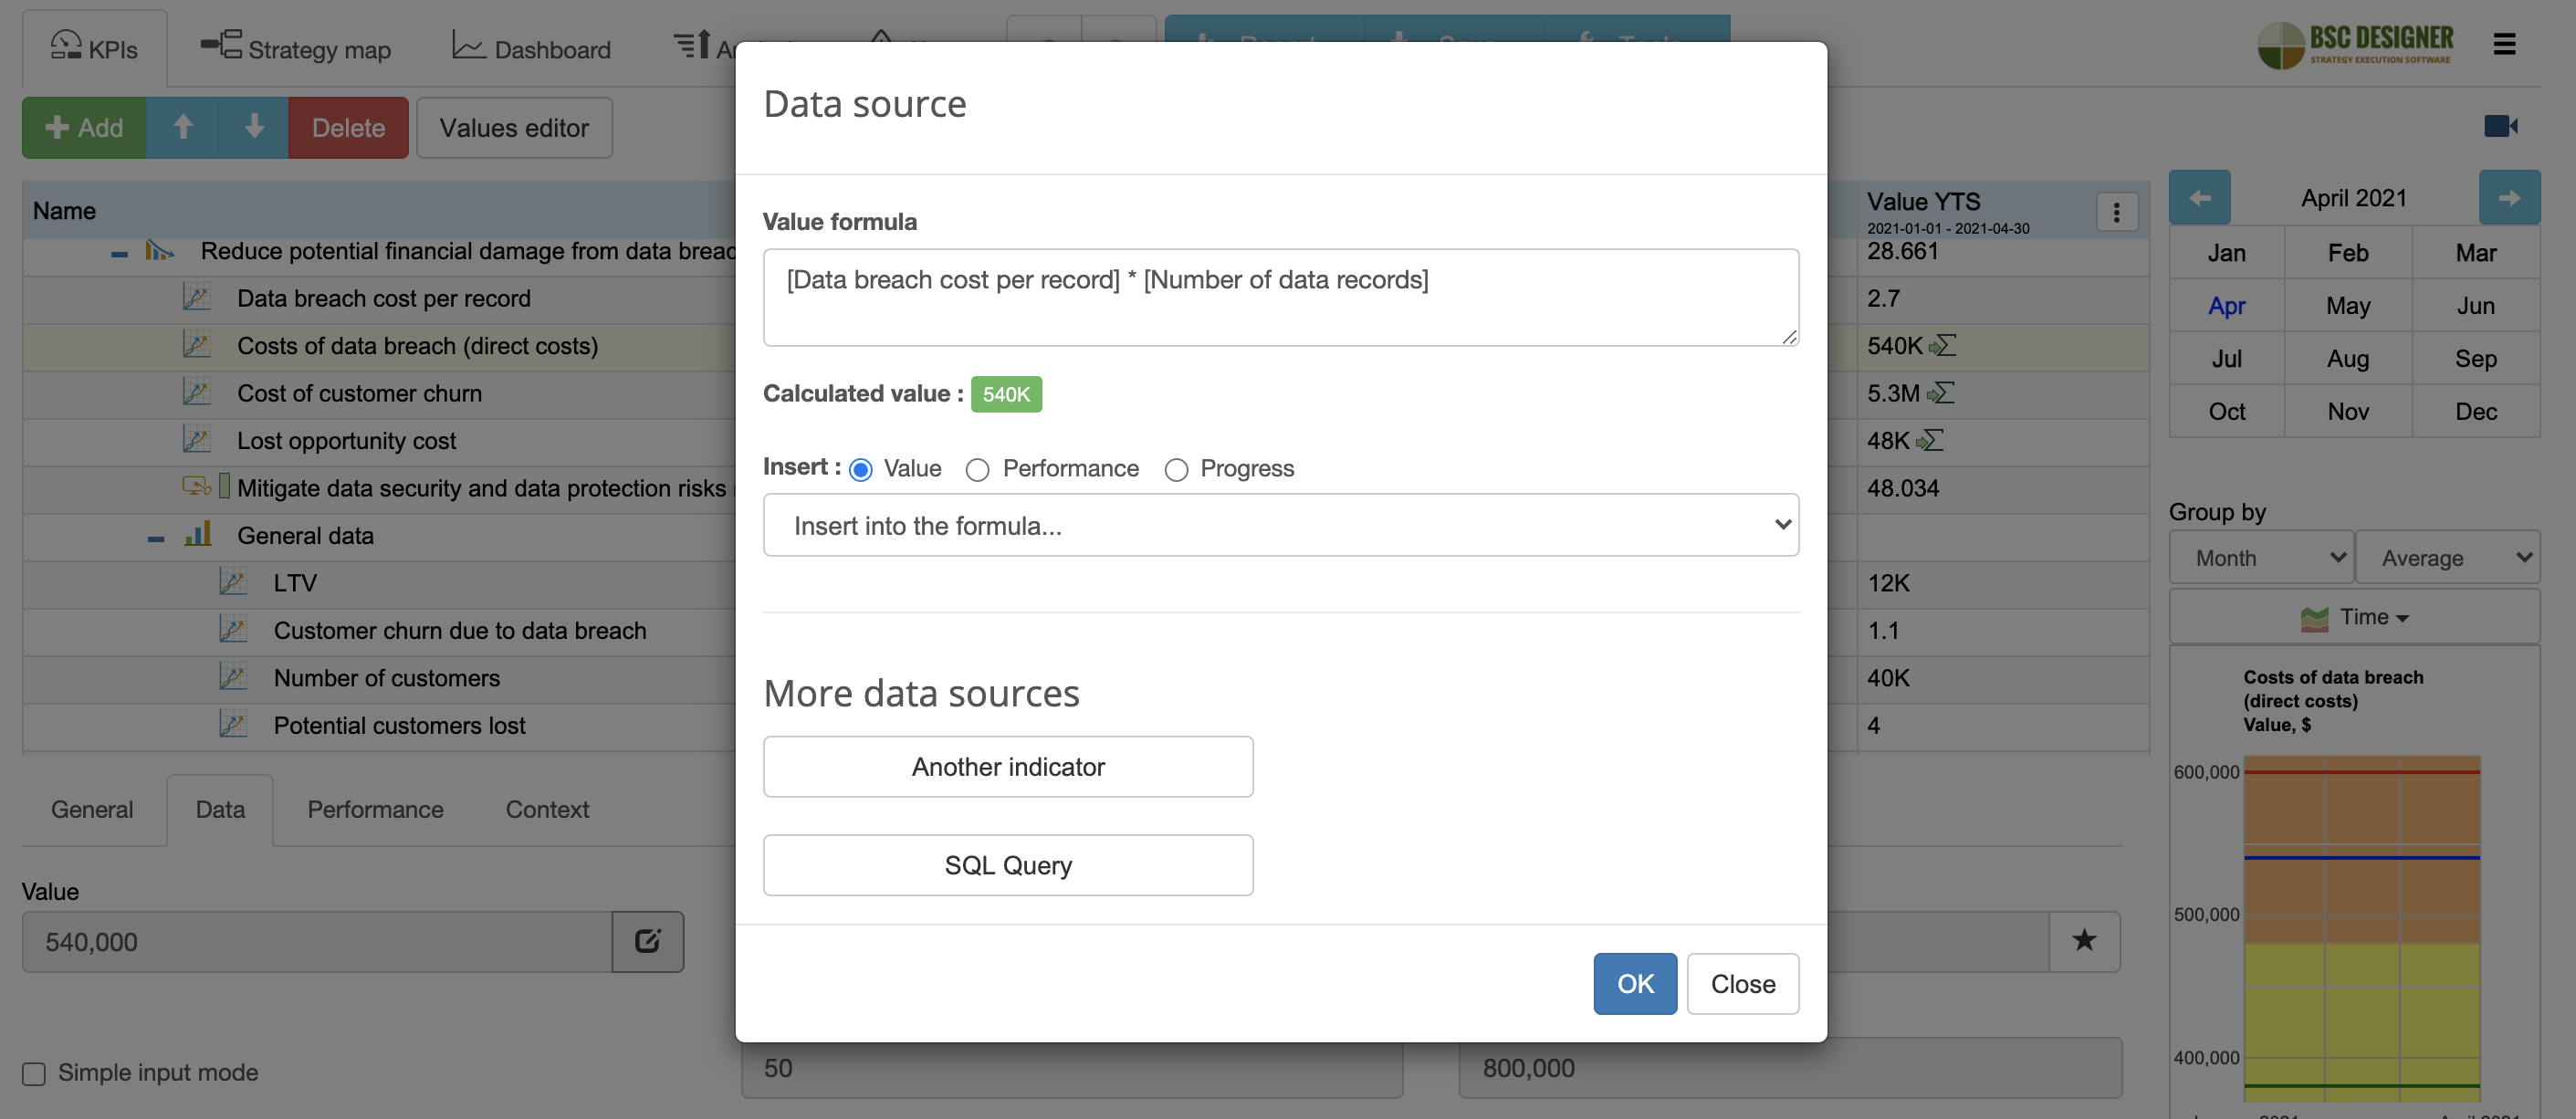
Respectively, the direct impact of a data breach can be calculated as:
- Costs of data breach (direct costs) = Data breach cost per record * The number of records at risk
As for indirect costs, one way to quantify them is using customer churn rate due to the data breach and LTV:
- Cost of customer churn = [Number of customers]*[LTV]*[Customer churn due to data breach]/100
Additionally, you can estimate the number of potential customers that did not sign the contract.
- Lost opportunity cost = [Potential customers lost] * [LTV]
Customer Perspective. Quantifying Security Risks.
For the customer perspective, the key goal is formulated as:
- Mitigate data security and data protection risks
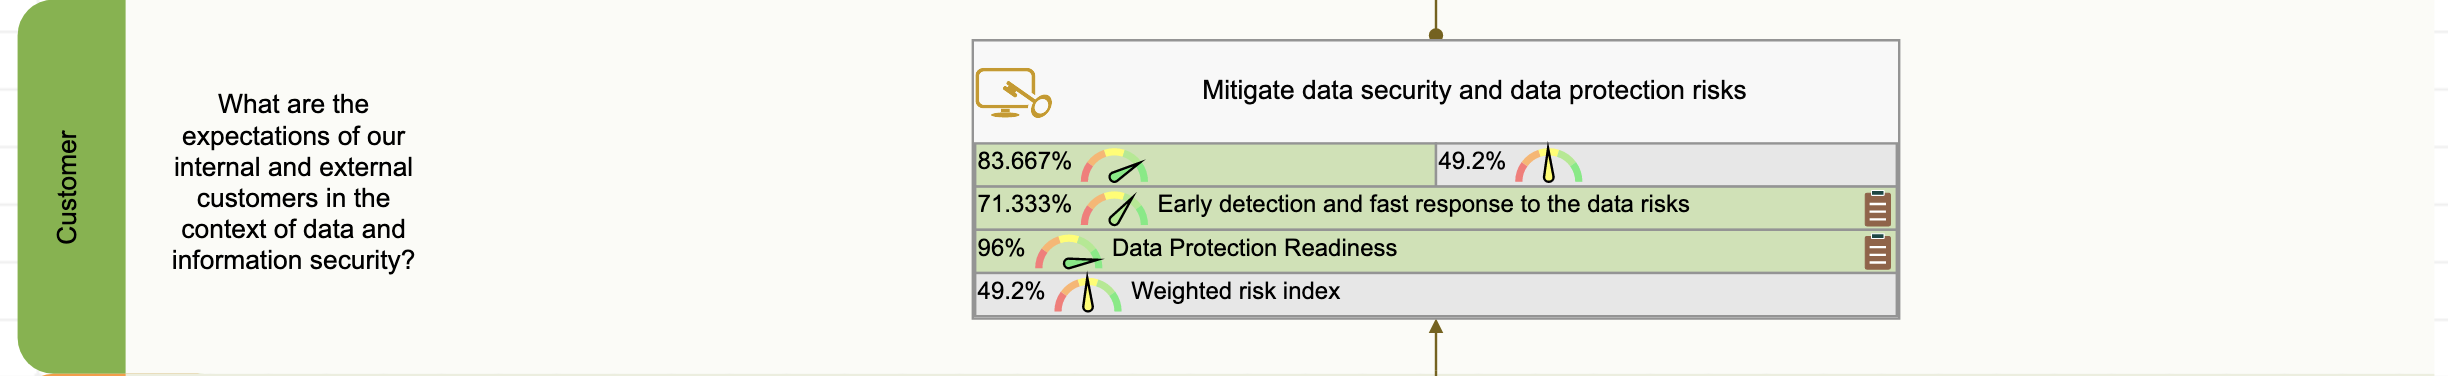
This is qualified by these indicators:
- Leading indicator Early detection and fast response to the data risks that is the output of the goals from the Internal Perspective
- Leading indicator Data Protection Readiness
- Lagging indicator Weighted risk index
The logic here is that the organization works on the internal security systems (quantified by early detection and fast response to the data risks) and introduces necessary data protection measures (quantified by Data Protection Readiness) to better mitigate data security risks as quantified by the Weighted risk index.
- When building a data security strategy, make sure your team understands the difference between metrics for the success factors (leading metrics) and the metrics for the expected outcomes (lagging metrics).
Let’s discuss indicators from the Customer perspective in detail.
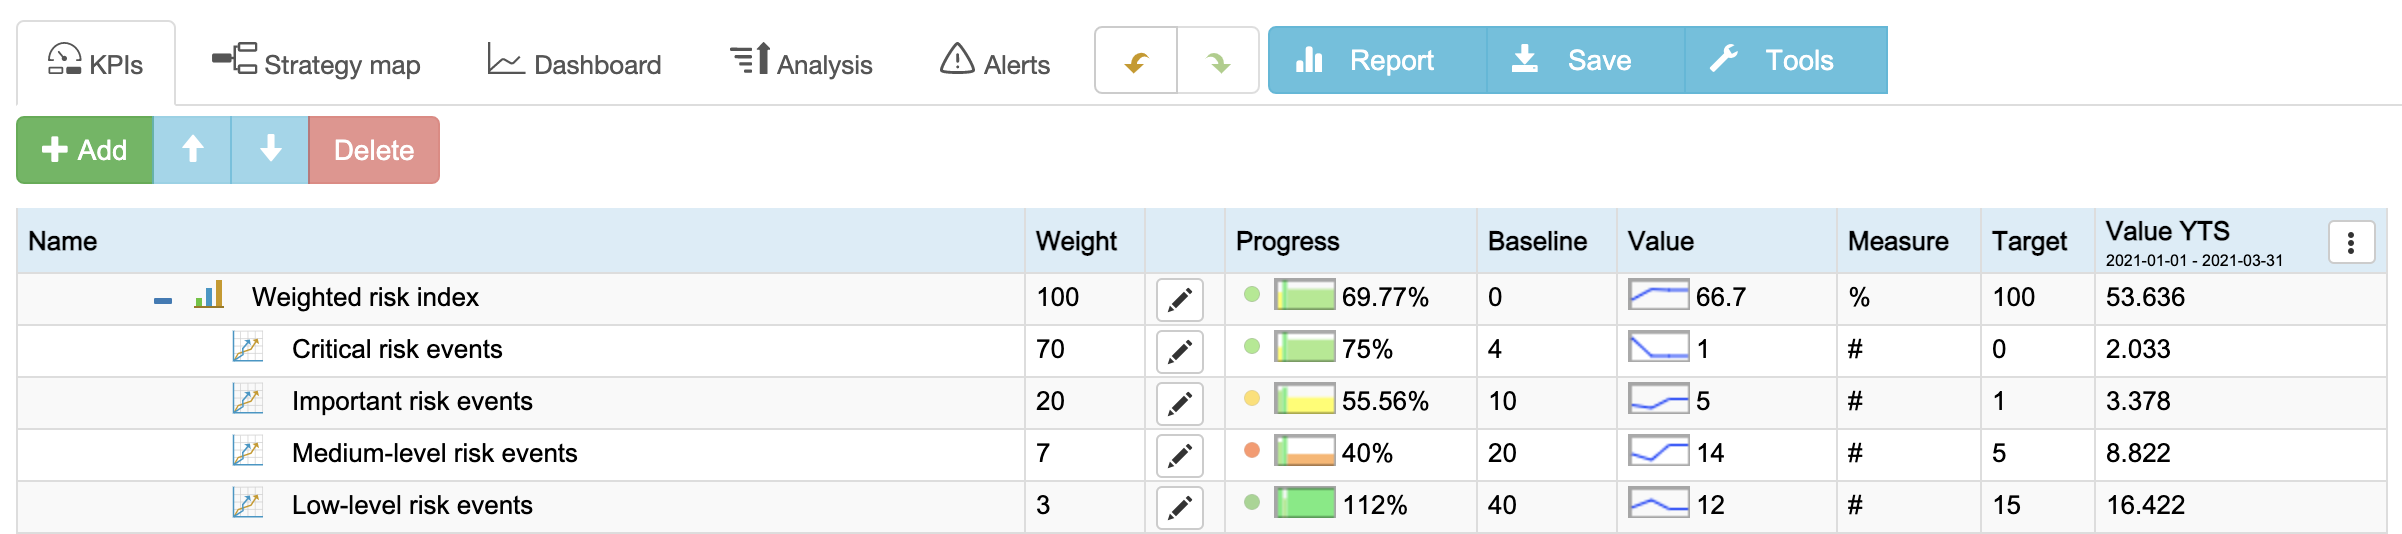
Weighted Risk Index
The goal of this indicator is to quantify the current risk level that the organization is dealing with. To do this, we will quantify the number of data breaches categorized by their impact level:
- Critical risk events, weight 70%
- Important risk events, weight 20%
- Medium-level risk events, weight 7%
- Low-level risk events, weight 3%
As you can see, a non-linear weight scale was applied. With this model, critical data breaches have the highest impact on the index metric, while low-level events have low impact.
This approach addresses the problem of manipulating the measurement system when the control indicator is moved to the green zone by solving less significant issues. Still, we need to make sure that the risk events are categorized properly.
If you are interested in learning more about the calculation of the index indicators and taking into account the weight of the indicators, then have a look at the respective article on our website.
Measuring Data Protection or Data Privacy
As explained before, data protection is about the ethical and lawful use of Personally Identifiable Information (PII) and similar data.
The protection measures, in this case, are well-articulated by the applicable legislation. In Europe, it is GDPR; in the U.S., there are different laws depending on the business domain, like CCPA, HIPPA, PCI DSS, GLBA.
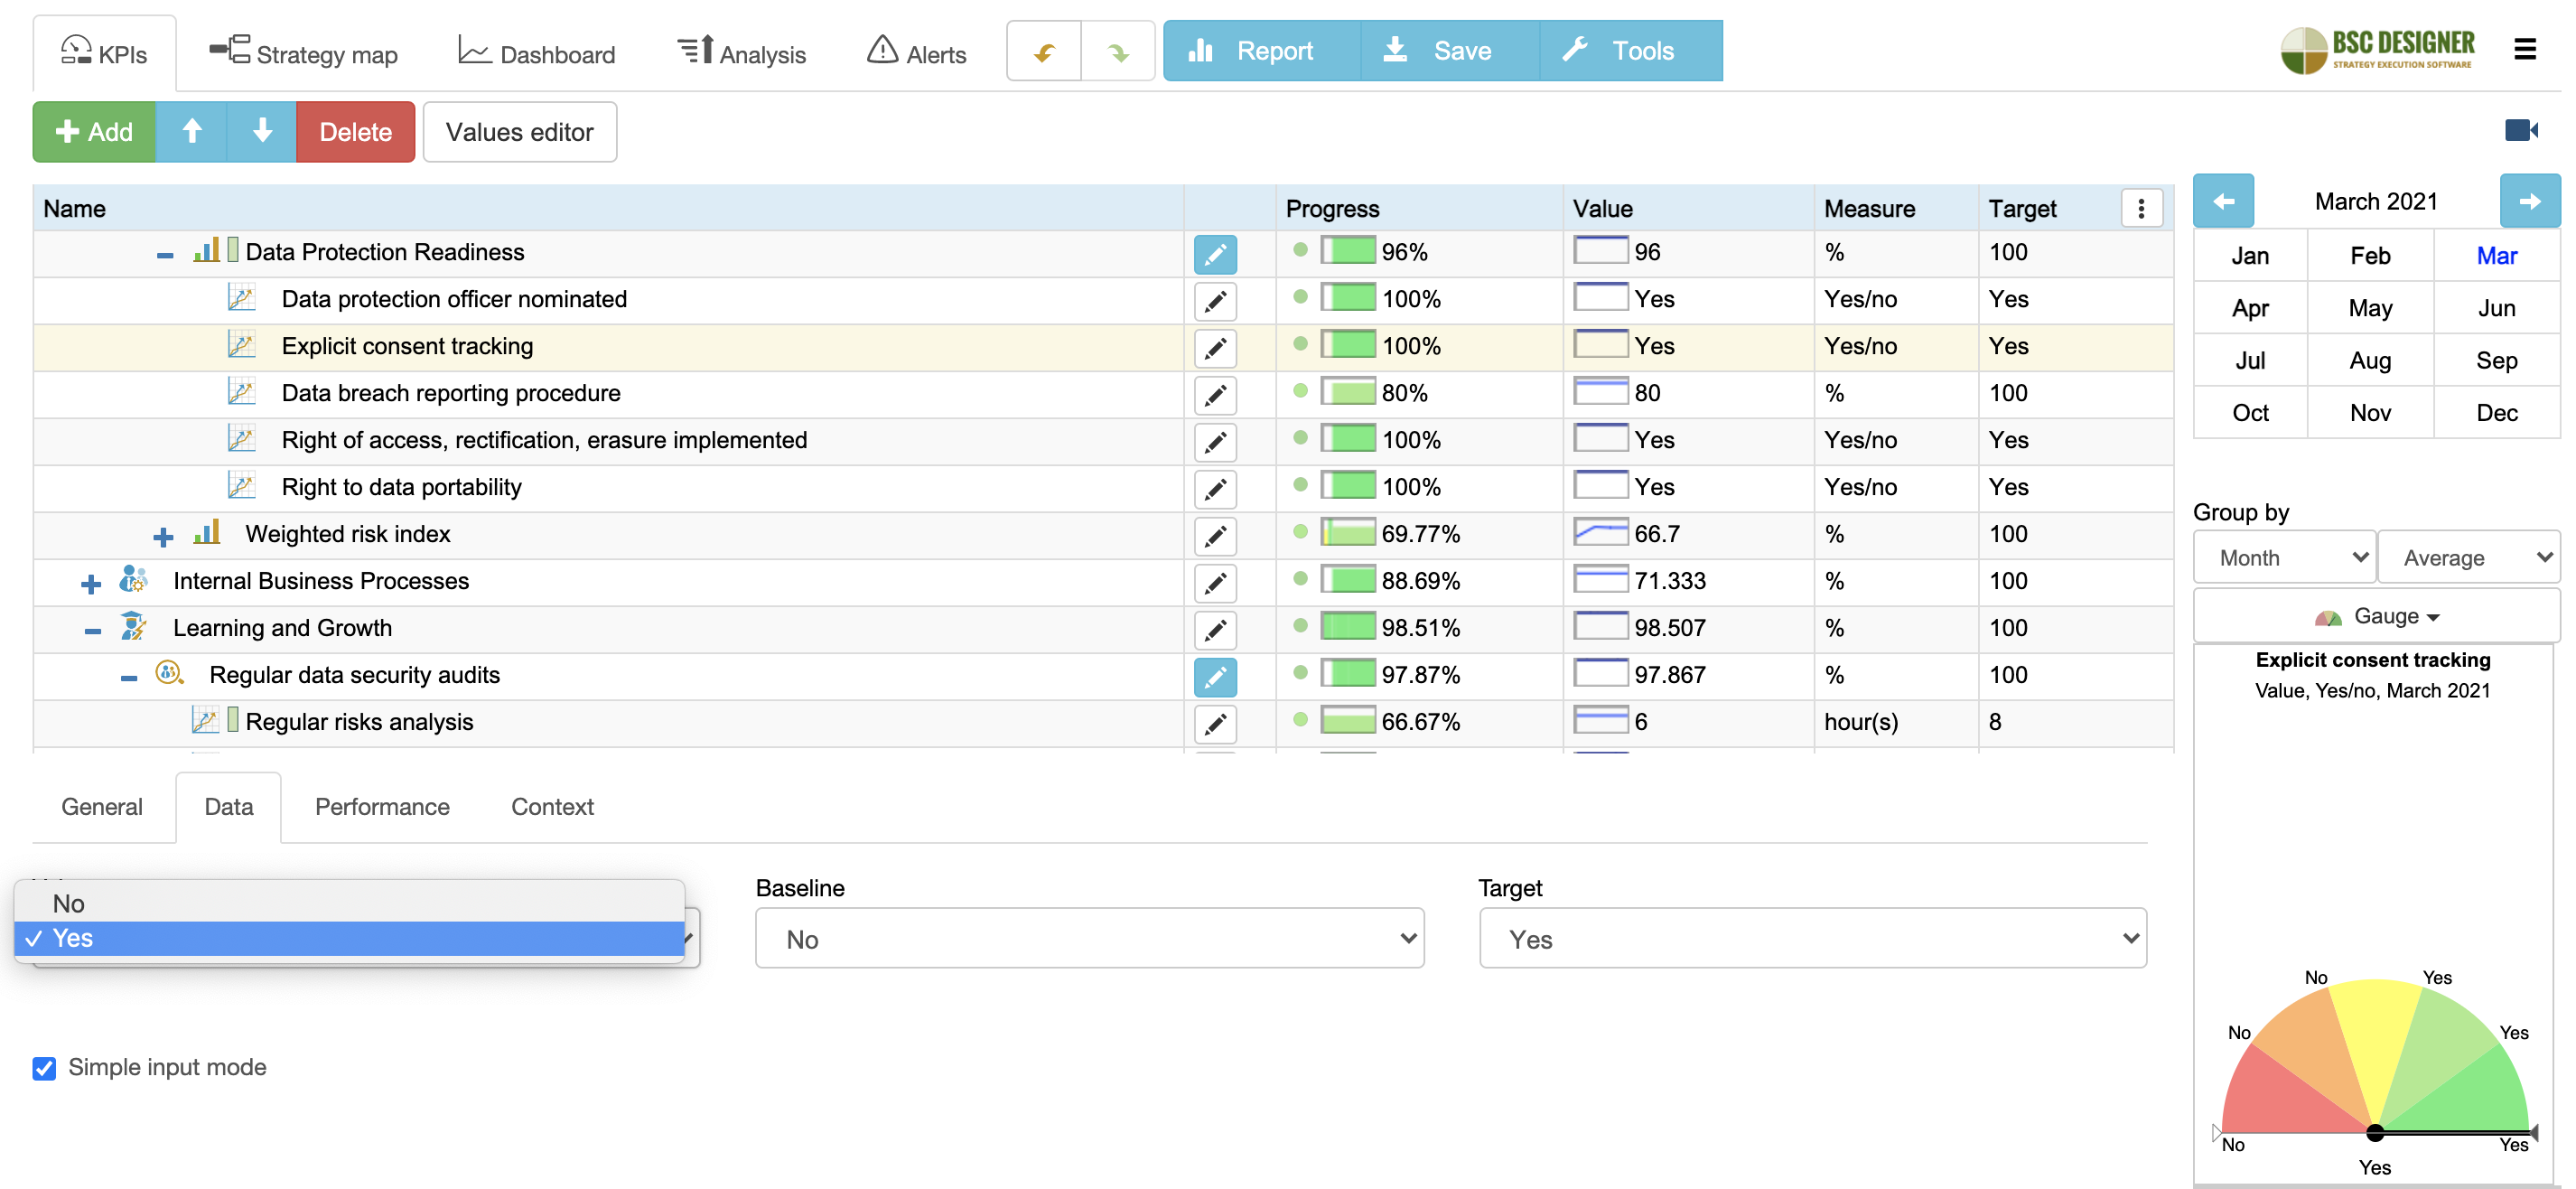
If we take GDPR as an example, from the viewpoint of measurement, data protection can be tracked by an index indicator, Data Protection Readiness, that is calculated using such metrics (mostly binary ones) like:
- Data protection officer nominated
- Explicit consent tracking
- Data breach reporting procedure
- Right of access, rectification, erasure implemented
- Right to data portability
These indicators can be further detailed into the most specific cases applicable to the organization, its products and services.
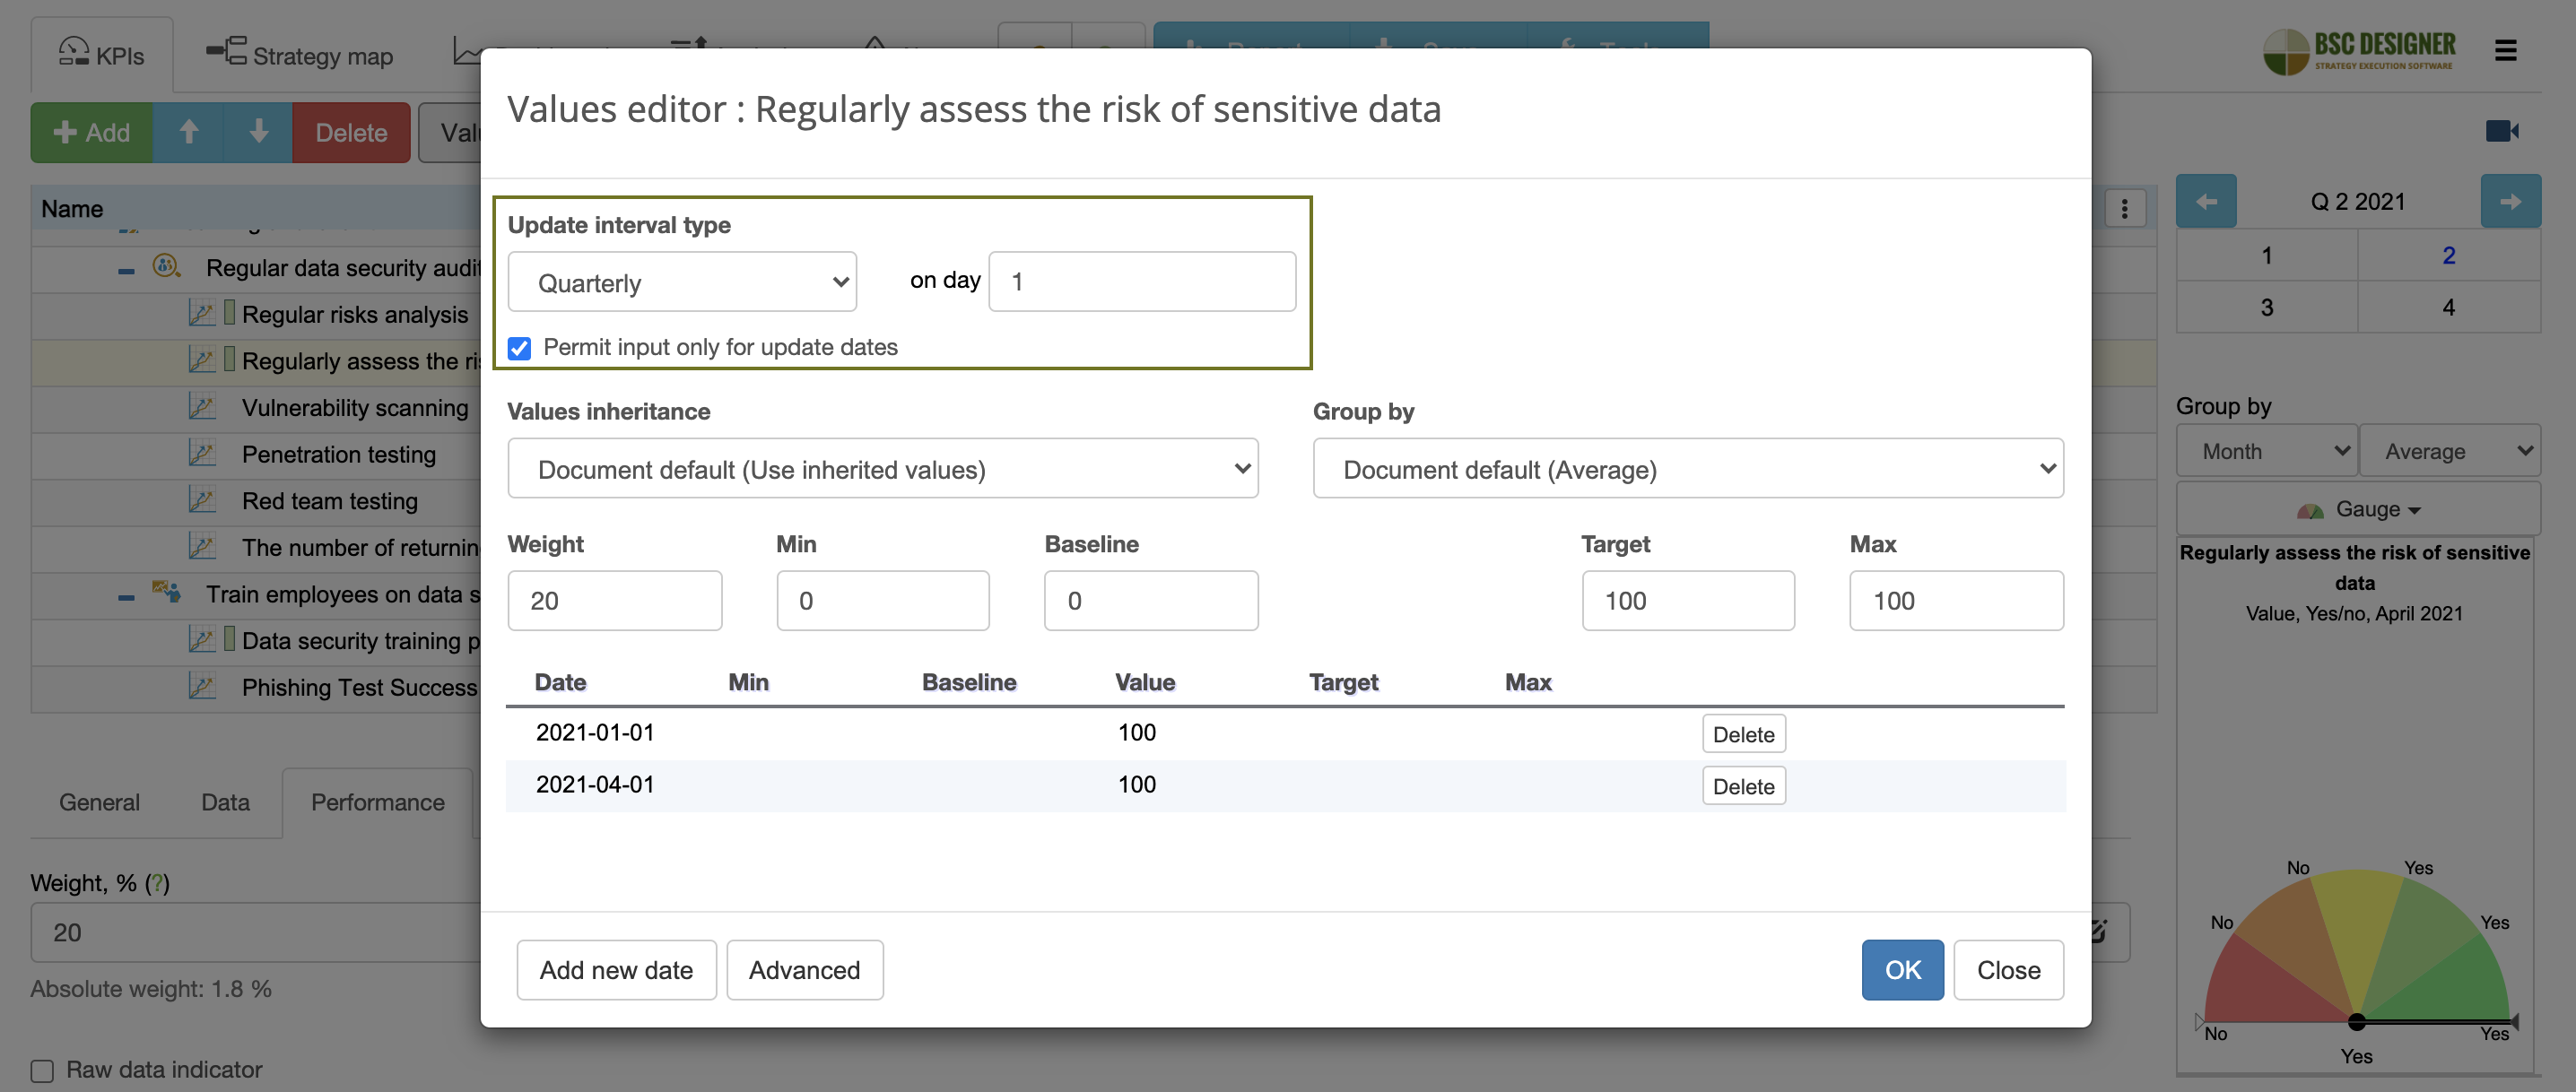
To ensure regulatory compliance, those indicators, as well as legal requirements, should be reviewed on a regular basis. This can be automated by the update interval function for the respective indicator. See the Automation section below for more specific examples.
Internal Perspective. How to Mitigate Data Security Risks
To find the goals and the performance indicators for the internal perspective, we need to do the root cause analysis and look at the risk/cost points found.
The findings will depend on the business domain and business systems of a specific organization. Still, there are some common trends that were highlighted in the reports by IBM Security and Verizon. We will use those findings to formulate the goals and KPIs for the internal perspective of the scorecard.
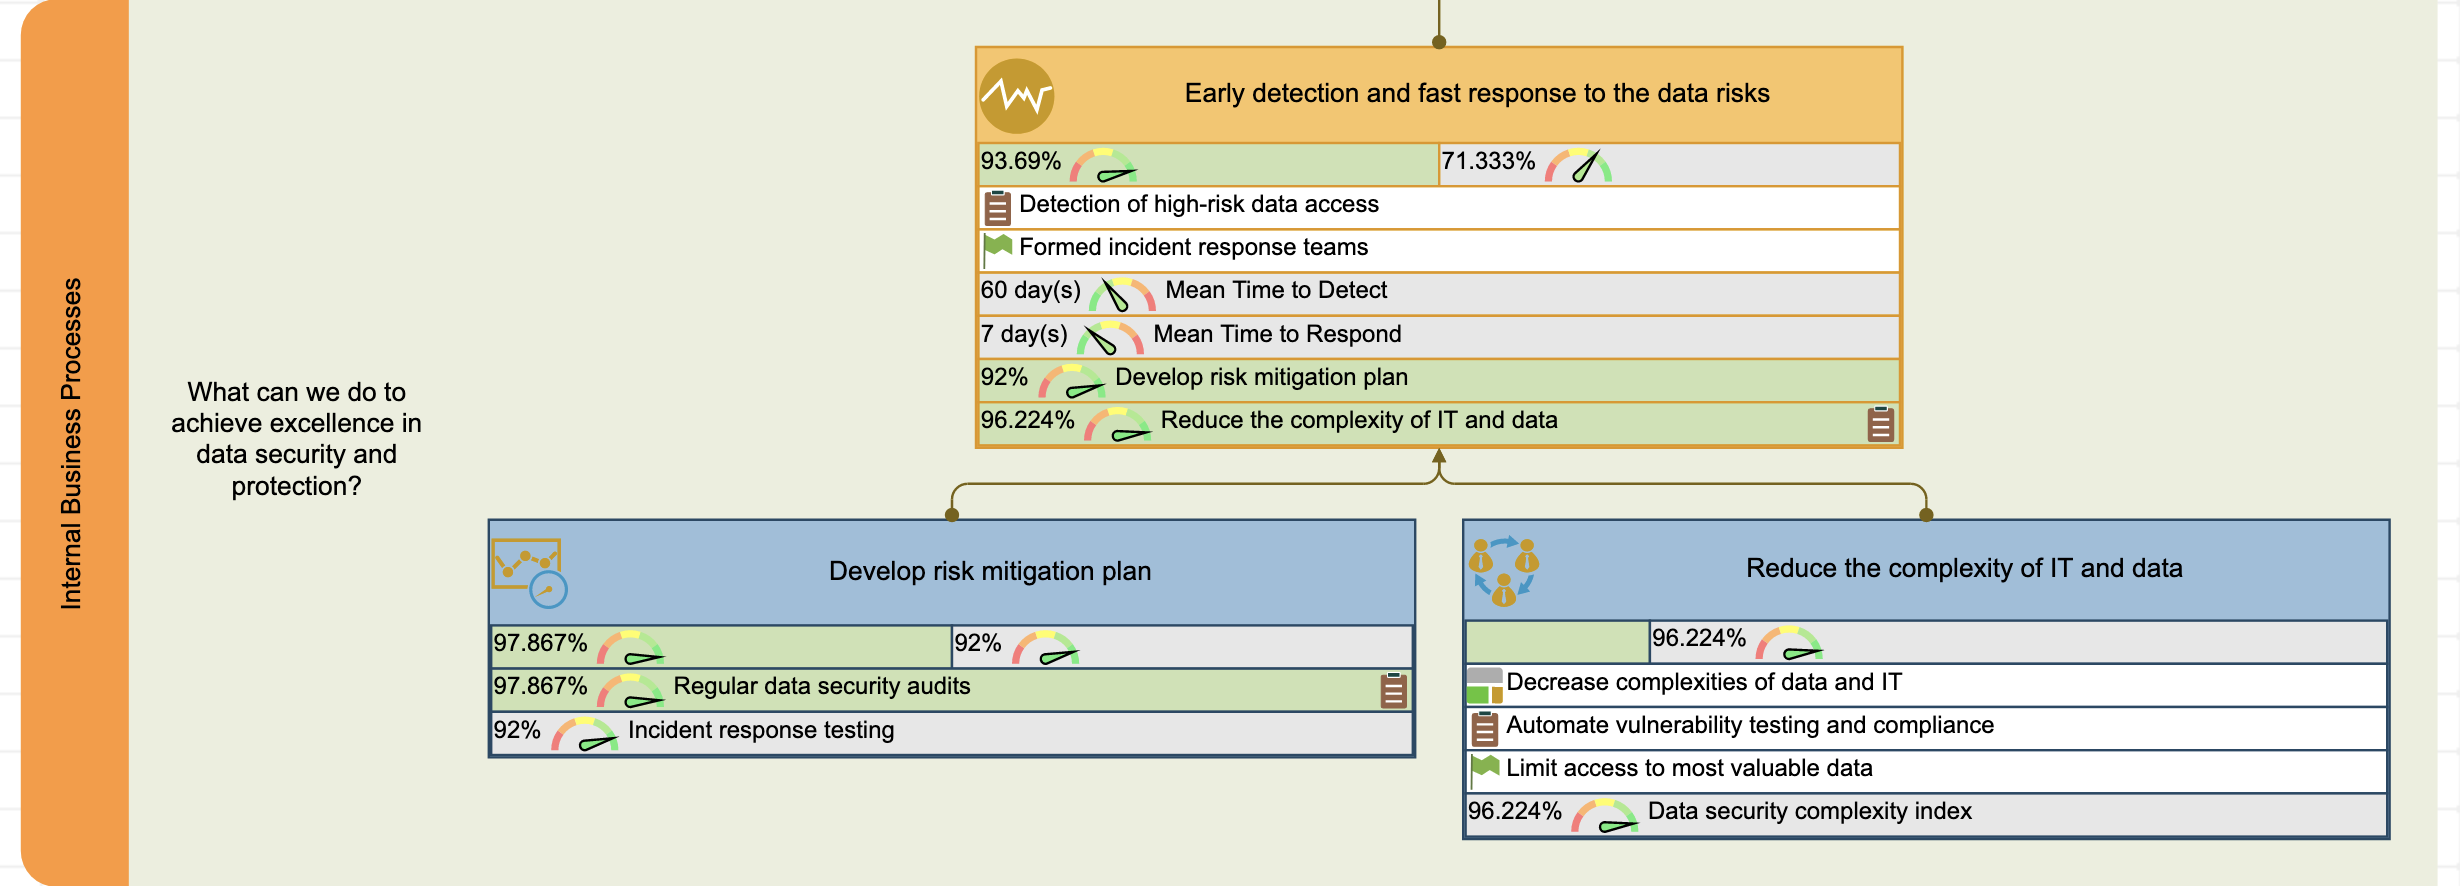
Early Detection and Fast Response to the Data Risks
If a data breach happened, fast response in terms of detection and response would significantly reduce the costs.
On the scorecard, this is quantified by two lagging indicators:
- Mean Time to Detect
- Mean Time to Respond
Lagging indicators quantify what already happened. How can an organization influence these indicators? The same reports suggest certain actions that typically lead to a better data security response.
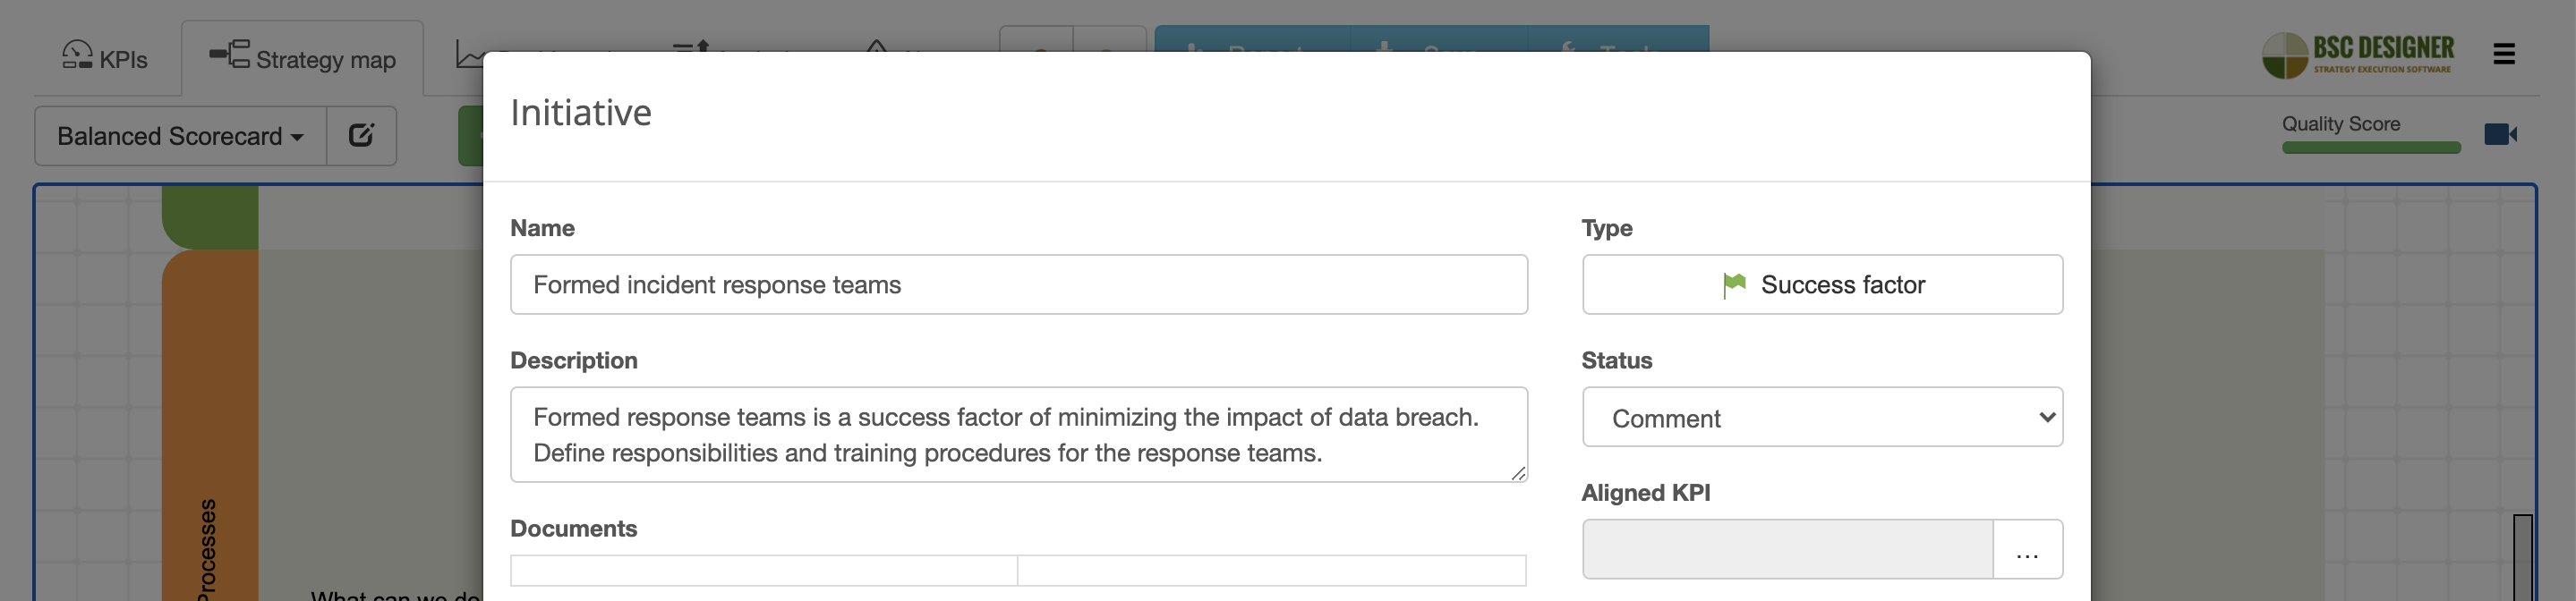
On the scorecard template, you will find two records aligned with Early detection and fast response goal:
- Formed incident response teams. This record is marked as a success factor. According to the IBM Security report, it is one of the root causes of minimizing data breach impacts.
- Detection of high-risk data access. With this initiative, your team can prioritize their efforts according to the impact of certain types of data access. If you are looking for a more systematic approach to prioritization, then check out the article about prioritization frameworks.
There are two more leading indicators in the context of the Early detection and fast response goal. Both are based on the findings of data security reports mentioned above:
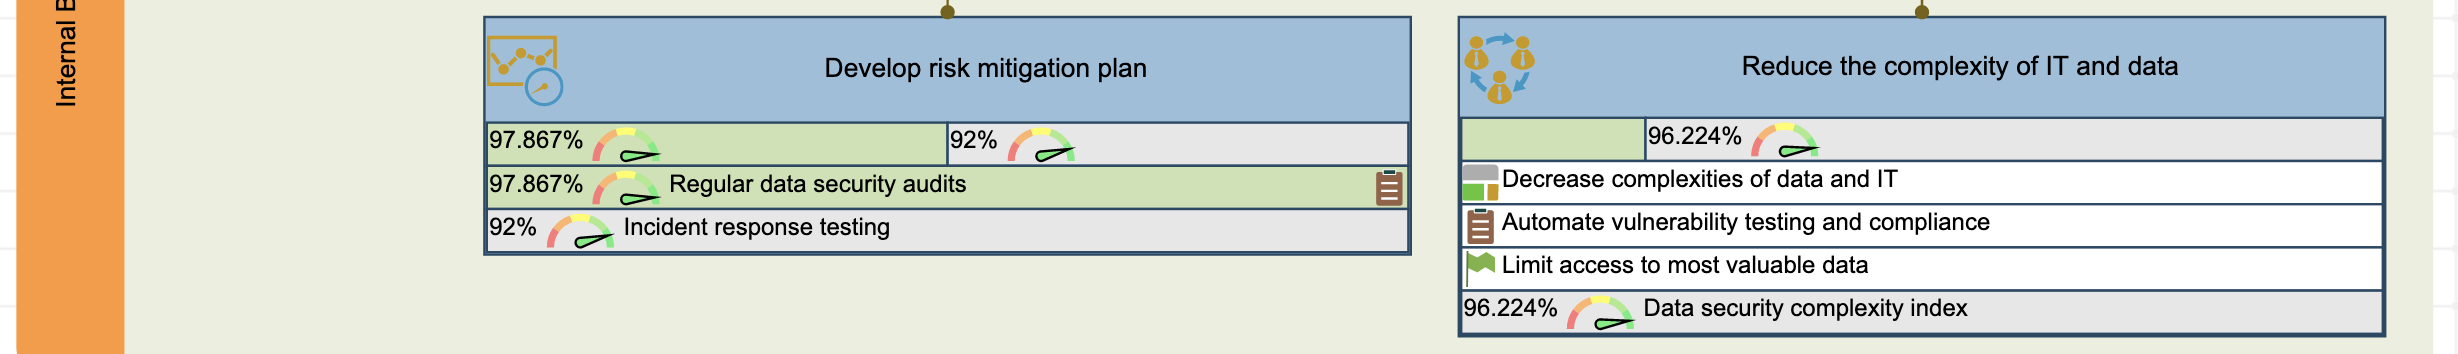
- Develop risk mitigation plan
- Reduce complexity of IT
Let’s discuss them in detail.
Develop a risk mitigation plan
Having a risk mitigation plan is a success factor of a faster response to the data breach.
How can we make sure that the existing plan for data security is a good one?
It should be based on an up-to-date risk model that reflects the way data is managed in the organization. On the strategy scorecard this is quantified by Regular data security audits leading indicator that is explained in the Learning and Growth perspectives.
How do we know that the suggested risk response plan is actually effective?
Together with regular updates of the risk plan, we could test the application of the developed plan in practice. This is quantified by the lagging indicator, Incident response testing.
Reduce the complexity of IT and data
The empirical studies name several other factors that help to minimize data breach costs, such as:
- IT infrastructure complexity
- Data scheme complexity
- Automation
On the strategy map, we formulated these factors within the Reduce complexity of IT and data goal.
In this case:
- Decrease complexities of data and IT is a rationale for the goal
- Limit access to most valuable data is one of the success factors of decreasing the complexity of required IT solutions
- Automate vulnerability testing and compliance is a broad initiative for IT automation of security
Finally, if minimizing complexity is named one of the factors of better data breach response, how can we quantify it?
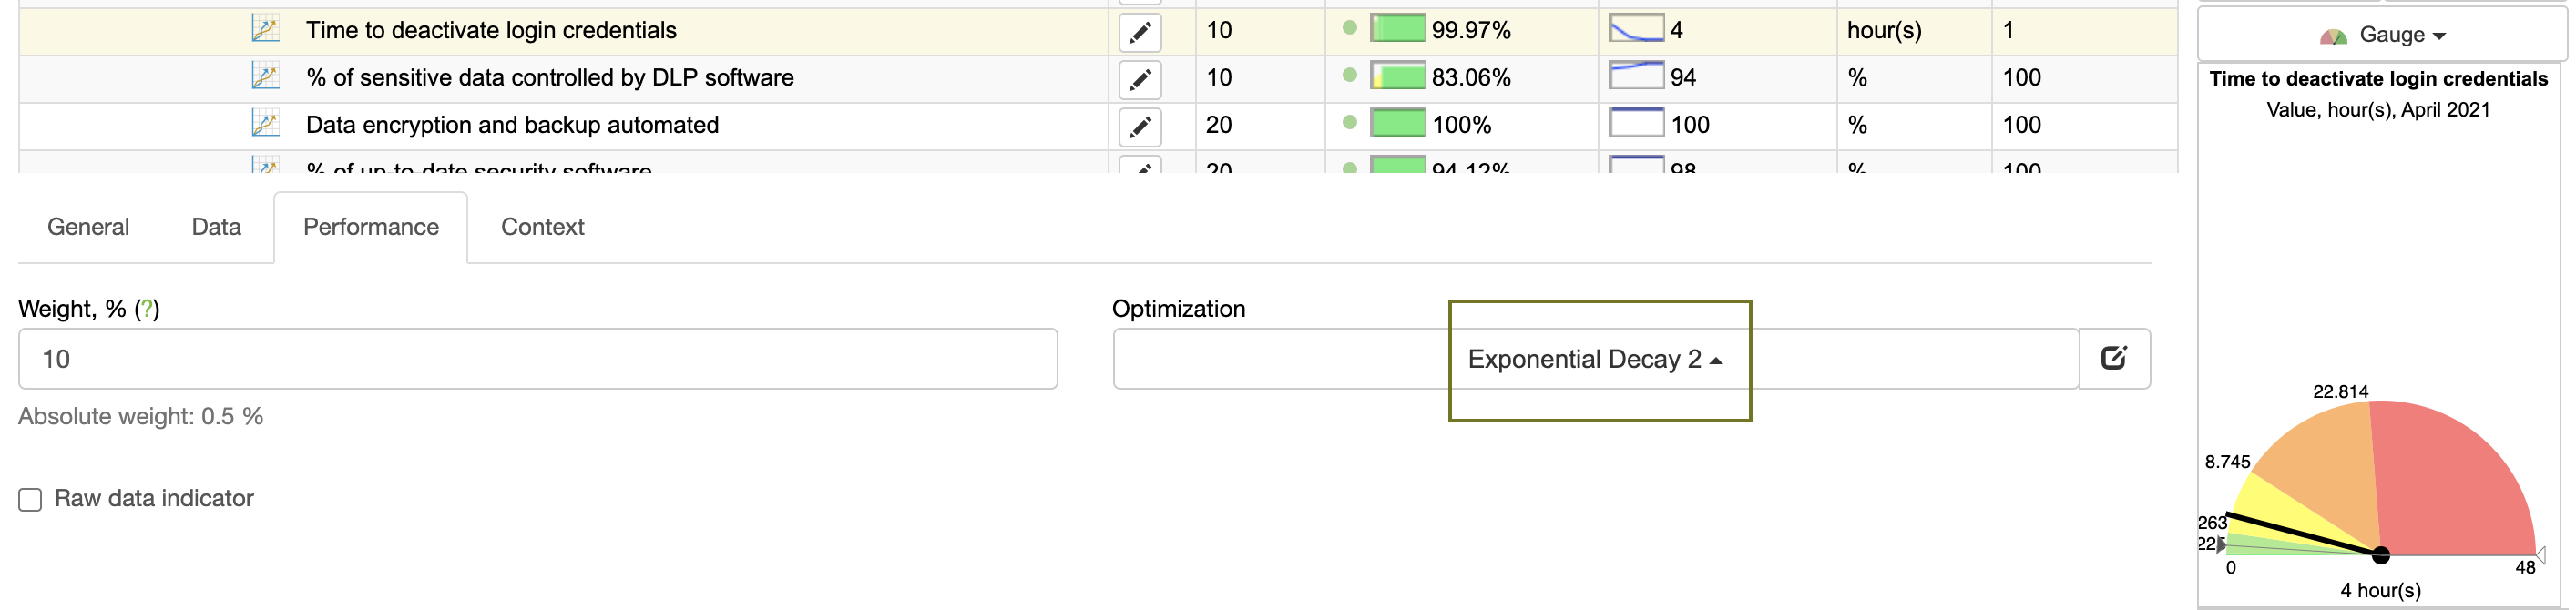
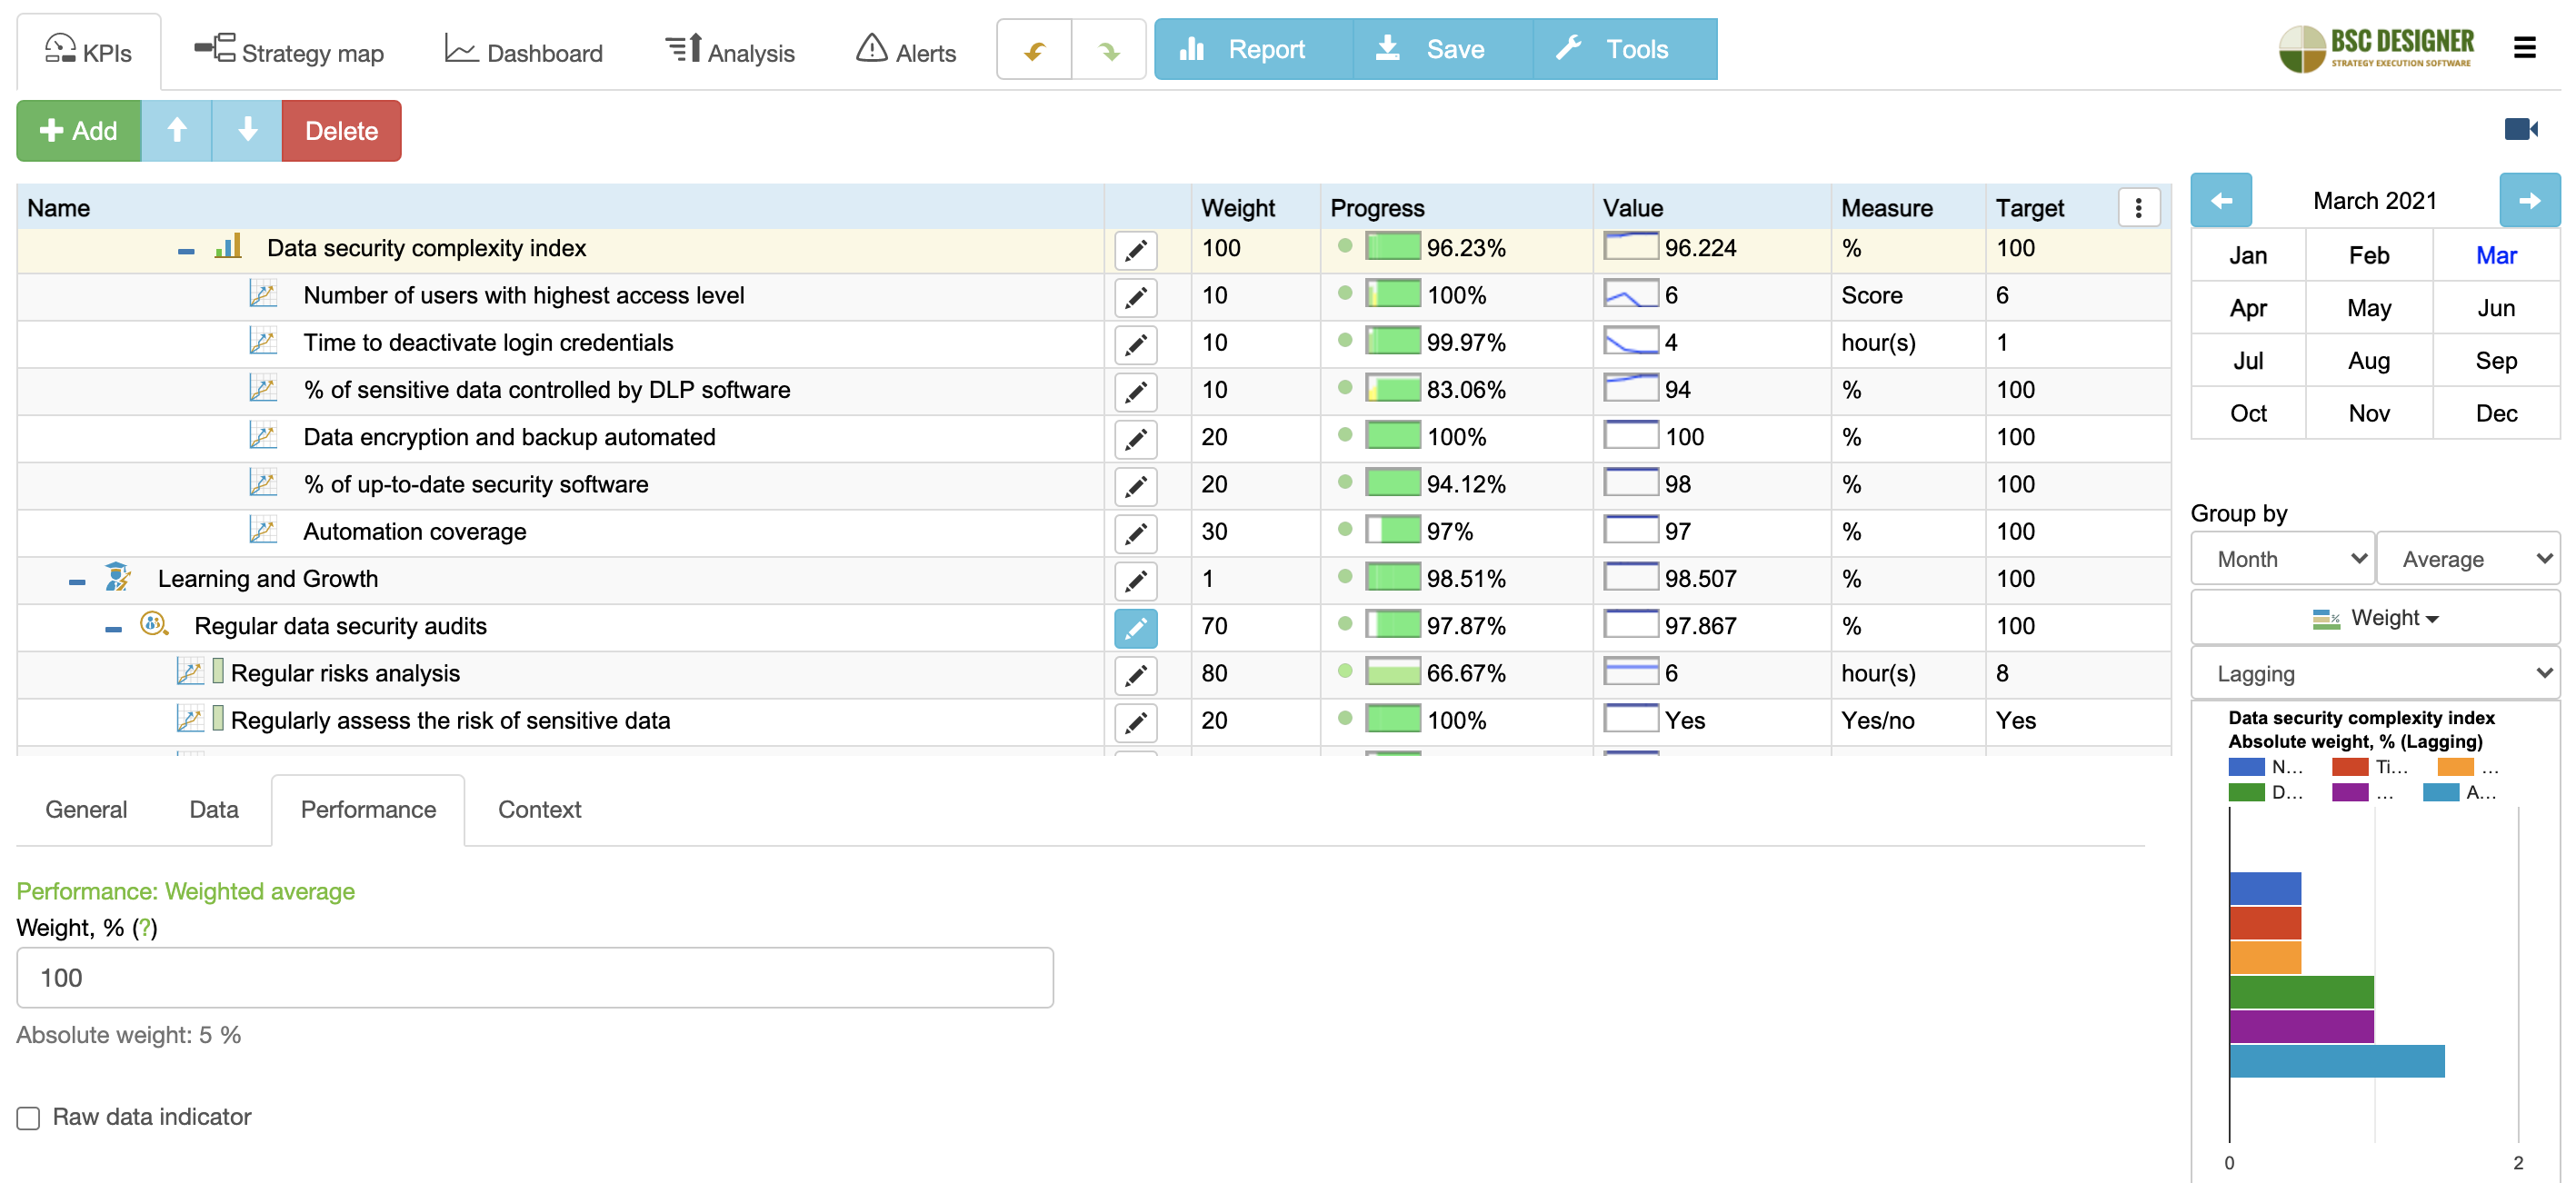
The answer is individual and depends on the IT landscape of your organization. For this scorecard, there is an example of Data security complexity index that is compiled of such indicators as:
- Number of users with the highest access level. The optimization function for this indicator is set to ¨Minimize linearly,¨ as reducing the number of users with access to sensitive data will improve the overall performance of the index.
- Time to deactivate login credentials. 7% of data breaches are root caused by a malicious insider. Deactivating login credentials fast is one of the IT security measures that can reduce this percent. The acceptable time interval, in this case, is very short. To reflect this idea on the scorecard, the optimization function for this indicator is exponential decay.
- % of sensitive data controlled by DLP software. Data loss prevention solutions are one of the ways to automate IT security. As long as organizations deal with new data, it’s important to revise data models regularly to make sure that the sensitive data is accessible by the DLP (Data Loss Prevention) tools.
- Data encryption and backup automated. Similar to the previous indicator, we are interested in having an up to date data model and making sure that sensitive data is properly managed.
- % of up-to-date security software. This metric looks like a simple one, but studies tell a different story. The root cause of 16% of data breaches is vulnerability in third-party software. Software vendors regularly release updates that patch vulnerability. Having the latest updates installed is one of the success factors of minimizing security risks.
- Automation coverage, % indicator compares the level of automation that is possible with the current level of automation. Higher automation reduces the impact of human factors and reduces complexity for the stakeholders.
These are just examples of some metrics that can quantify the complexity in the case of data security. A more robust approach to complexity should include a deeper analysis of stakeholders, finding points of bad complexities and elaborating strategy of complexity reduction. In the previous article, we discussed complexity metrics and the ways to apply them in practice.
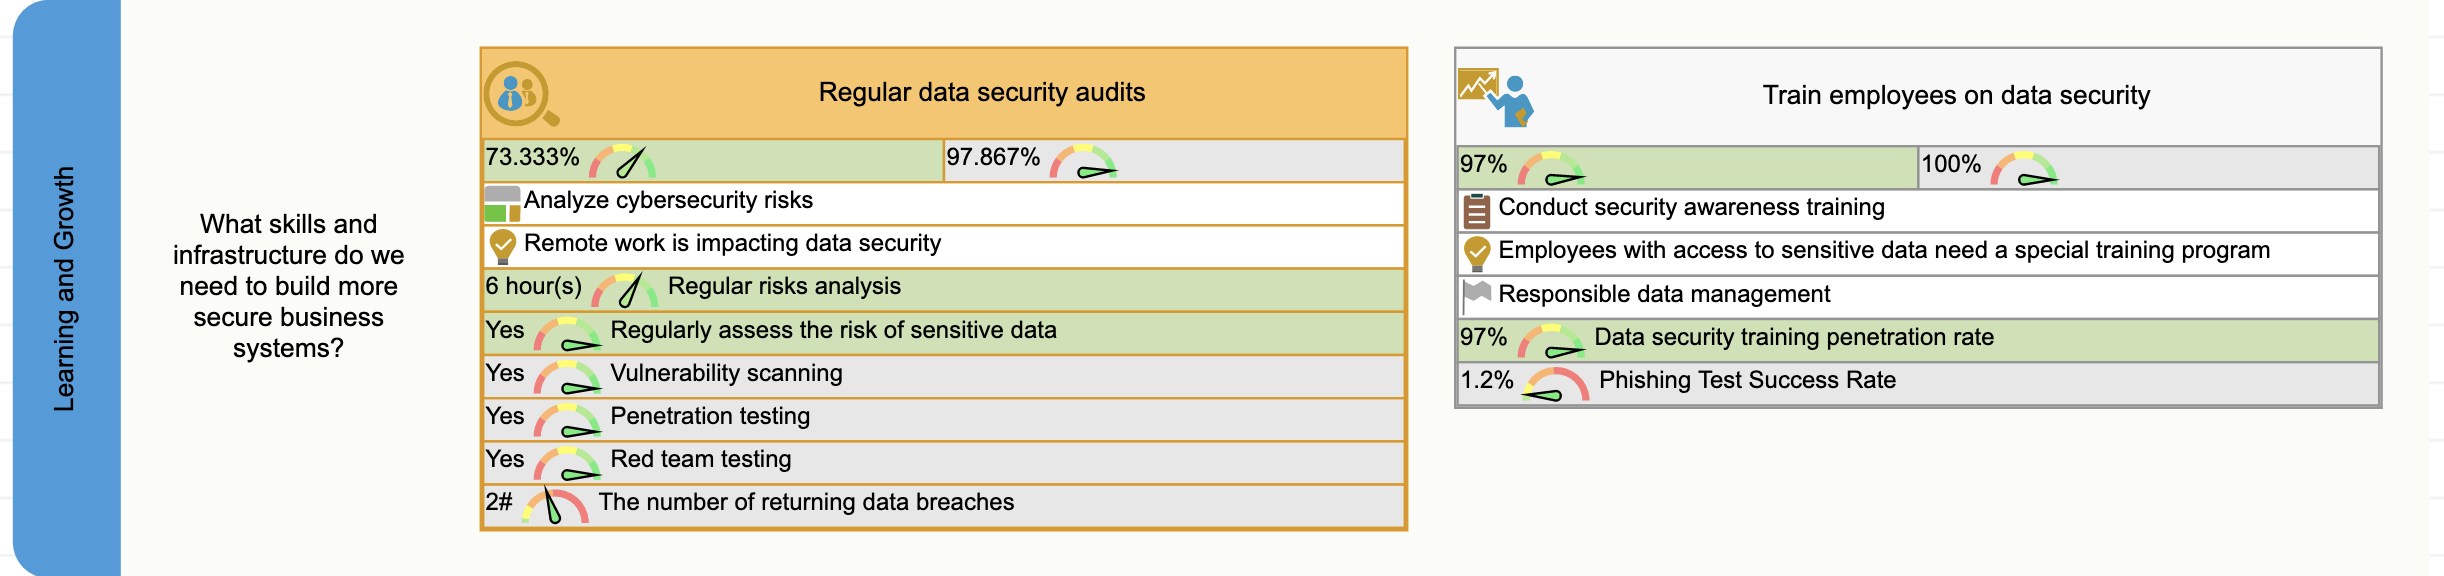
Learning and Growth Perspective
In this perspective, we have two big goals:
- Regular data security audits goal that helps to focus on proper infrastructure for the data security.
- Train employees on data security goal that focuses on giving your team the up-to-date knowledge and skills necessary to prevent data breaches or minimize their impact.
Let’s have a look at how these goals are formulated on the strategy map.
Regular data security audits
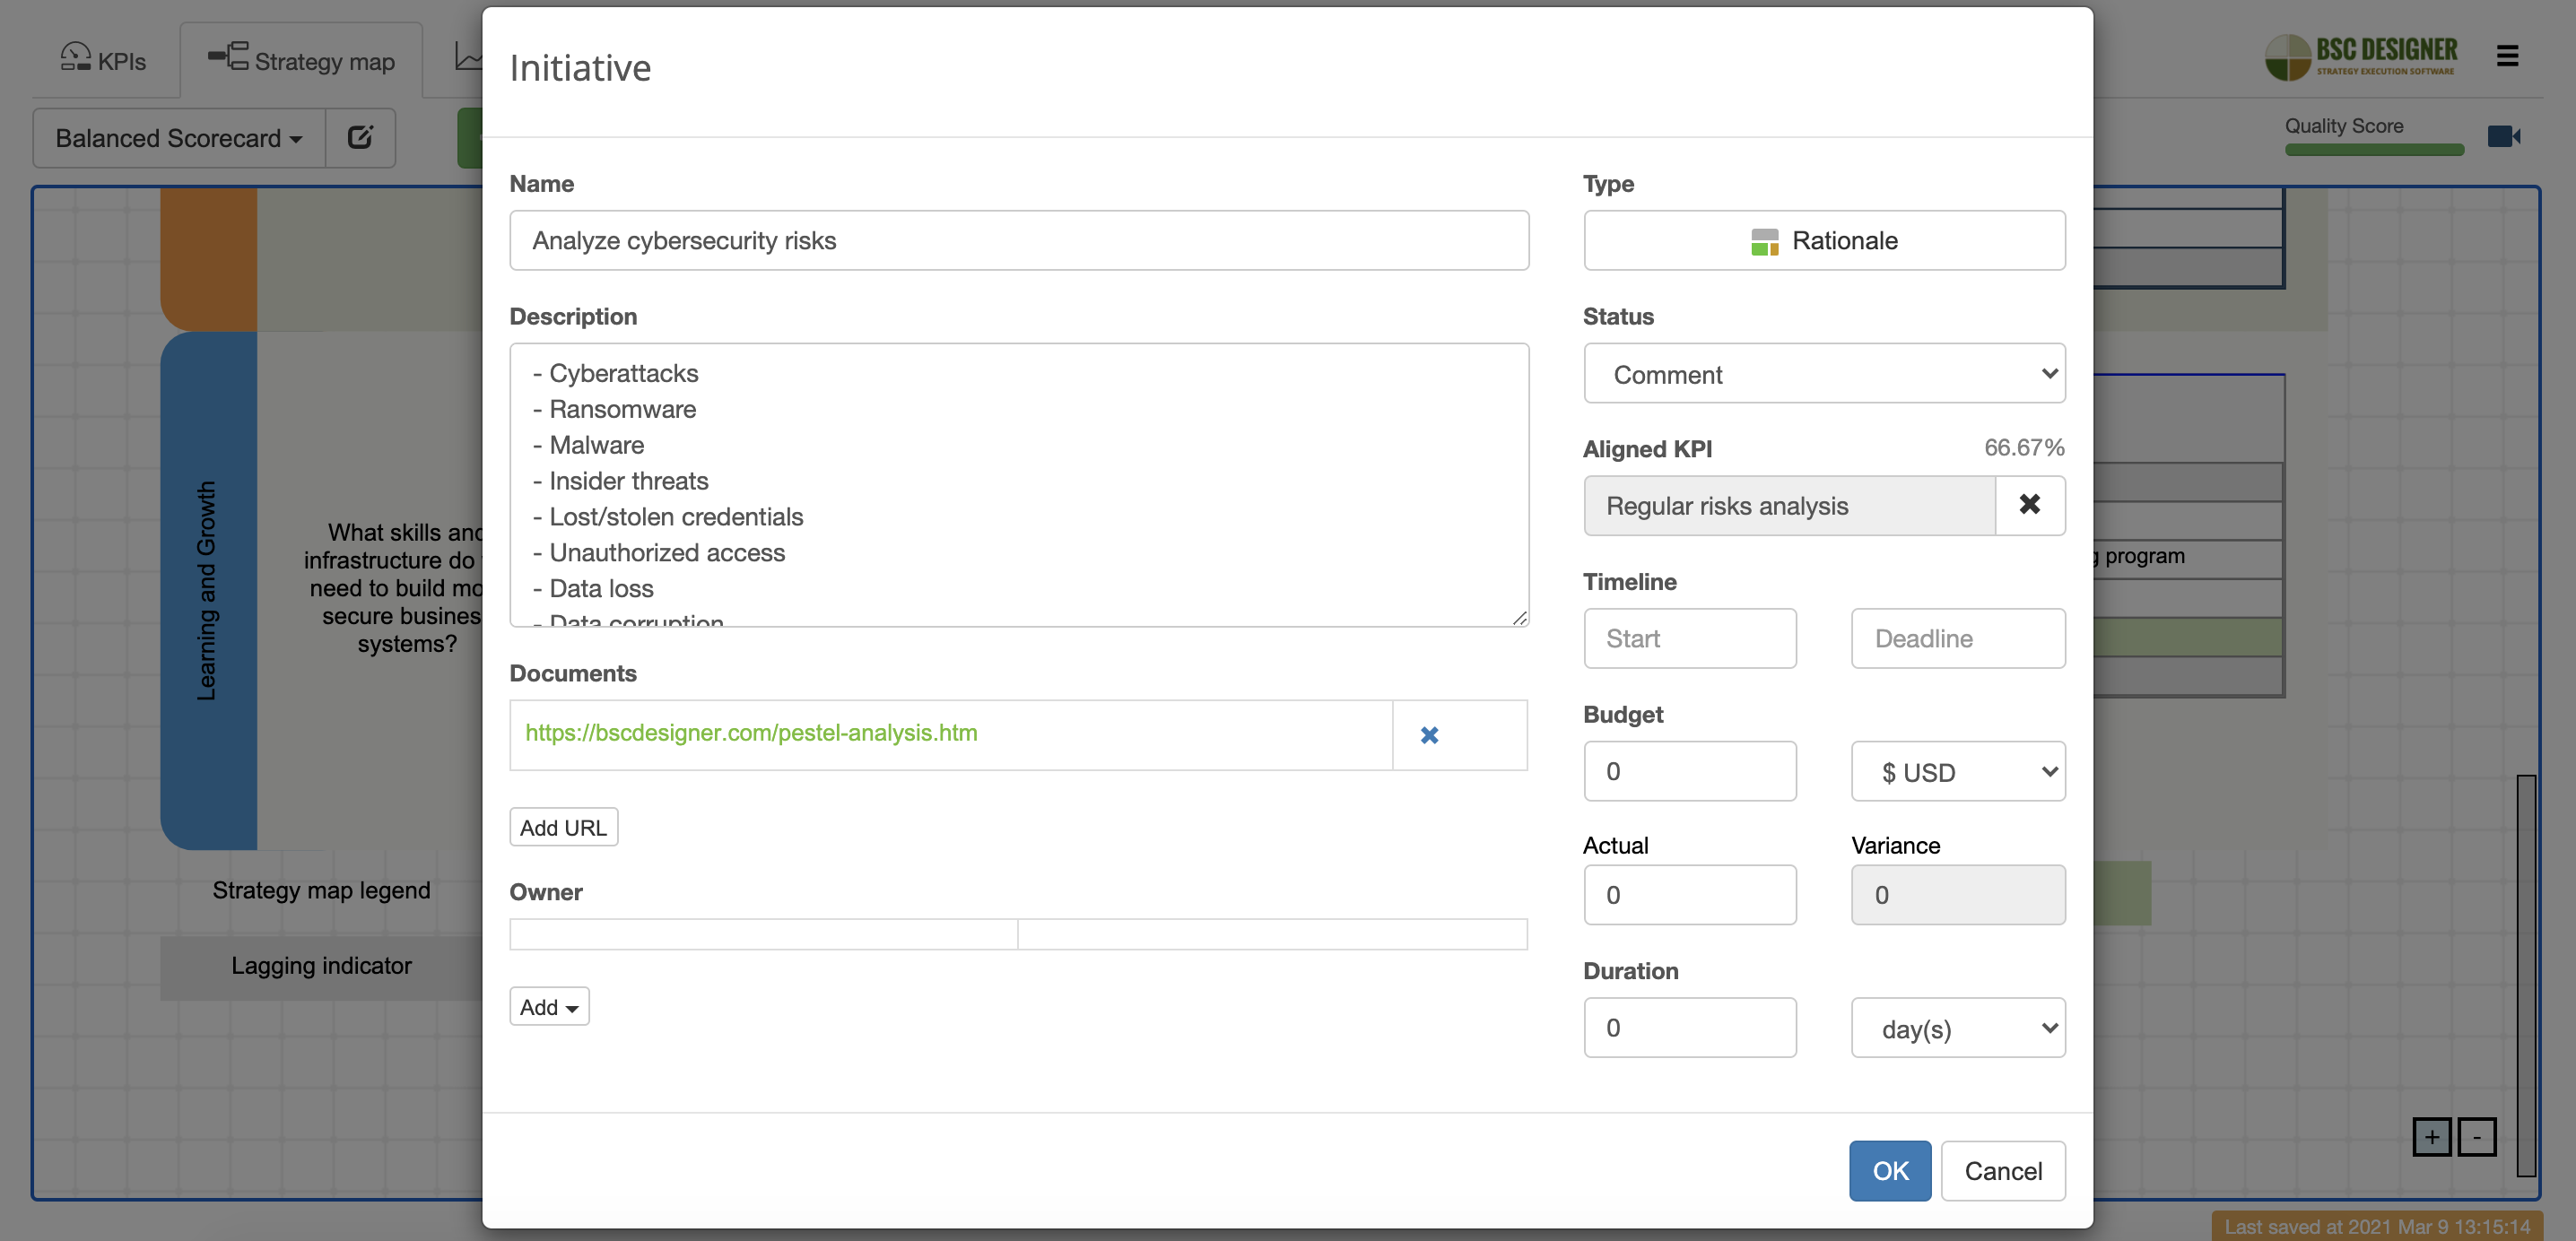
We have a rationale Analyze cybersecurity risks aligned with the goal. What are those typical cybersecurity risks? In the rationale description, we have some examples:
- Cyberattacks
- Ransomware
- Malware
- Insider threats
- Lost/stolen credentials
- Unauthorized access
- Data loss
- Data corruption
There is a hypothesis, Remote work is impacting data security aligned with the goal. For many organizations, remote work was part of their anticrisis strategy in response to Covid-19.
There are two leading indicators:
- Regular risks analysis – a general analysis of the new risks
- Regular assess the risk of sensitive data – a more specific analysis in the context of sensitive data
Both indicators are configured to be updated on a quarterly basis.
There are several metrics that help to quantify the efforts of the security team in analyzing the current risk situation and learning from it:
- Vulnerability scanning – typically, automated scanning done by IT team
- Penetration testing (pen test) – a simulation of a cyber attack
- Red team testing – security testing on a larger scale that involves more participants
The respective KPIs are configured for the different updates intervals:
- Automated vulnerability scanning can be done weekly or monthly.
- Depending on the risk model, a pen test can be performed quarterly.
- Finally, the indicator for the most resource-demanding red team testing is configured to half-yearly or annual update interval.
The risk analysis and testing procedures are designed to find weak spots in the security system. How do we know that the take-aways of those simulations and tests are effectively implemented? To find the answer to this question, we can track:
- The number of returning data breaches indicator.
If the data breach of the same type has repeated occurrences, it is a sign that the risk mitigation plan suggested by the security team is not as effective as expected.
Train Employees on Data Security
The human factor remains one of the highest risks of any data security system. According to the IBM Security report, around 36% of malicious data breaches are associated with human behaviour (phishing, social engineering, compromised credentials).
How can the data security strategy be designed to mitigate those risks effectively?
One of the solutions is to automate certain operations and reduce the role of the human operator. It resonates a lot with the Complexity reduction goal that we discussed in the internal perspective.
For the rest of the cases, where automation is not possible or is not rentable, education is an answer. How to focus educational efforts in the context of data security? We can use a pair of leading and lagging indicators!
- Leading indicator: Data security training penetration rate can be used to track the coverage of data security awareness training, where the participants can learn, for example, about phishing practices and the way to avoid them.
- The best lagging indicator, in this case, should be focused on the tangible impact of the awareness training. If understanding phishing practices was one of the topics of the training, conduct a Phishing Test and see if employees actually use the take-aways of the training. This can be quantified on the scorecard with the Phishing Test Success Rate indicator.
If educating employees on data security is your priority now, then your security team can design a training evaluation scorecard using Kirkpatrick’s levels model, as discussed in this article.
Automation for the Data Security Scorecard
We discussed an example of a strategy scorecard that helps to describe, implement and execute the data security strategy in your organization.
This scorecard is available as one of the free templates in BSC Designer Online so that you can sign-up with a free plan account and start customizing it according to your needs.
Know the Total Cost of Strategy
We mentioned that one of the reasons to have a strategy scorecard for data security is that it will make it easier to present new initiatives to the stakeholders.
The cost of the suggested strategy is one of the first questions that will be on the table. The cost to execute the strategy can be estimated as the sum of the costs of all business goals and their respective initiatives.
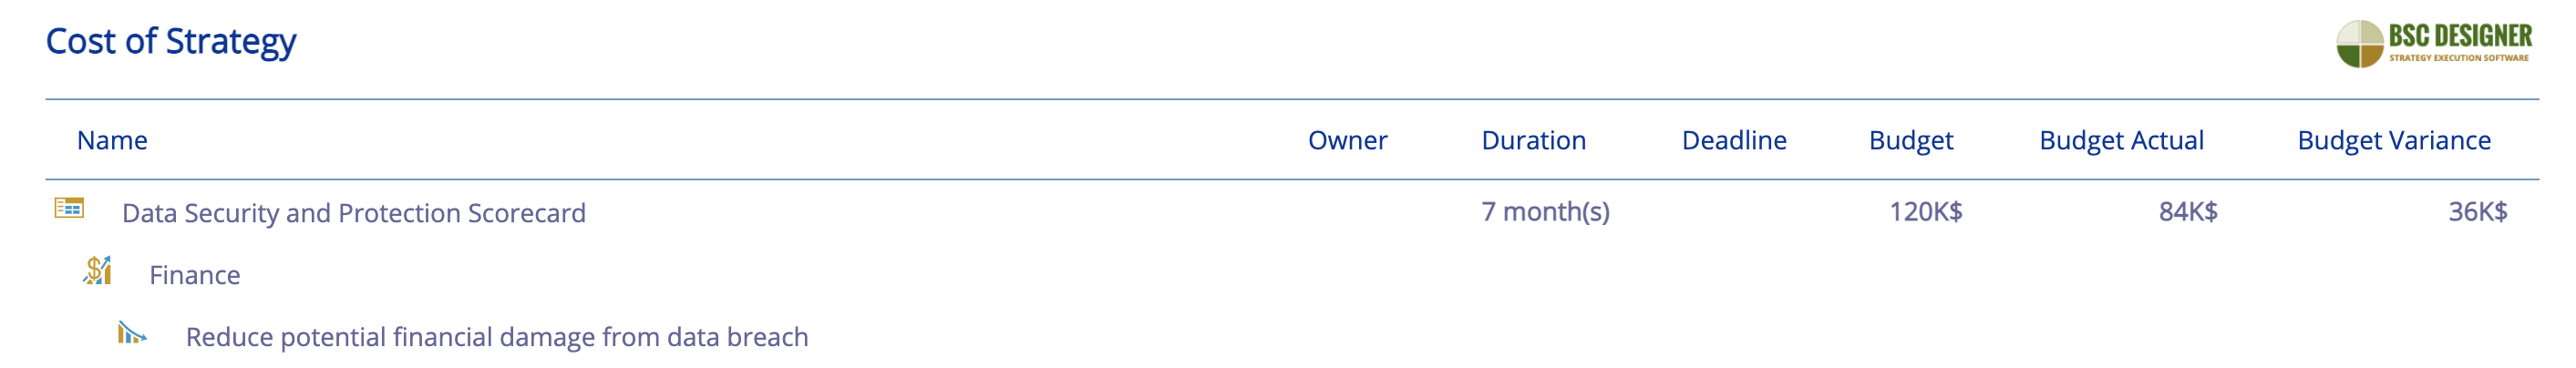
If you use BSC Designer as an automation tool, you will be able to assign budgets to the initiatives and control their usage. The software will be able to generate a cost of strategy report to present a total expected cost to execute the strategy.
Visualize Important Data on the Dashboards
Another typical request of stakeholders is to have the data to make the right decisions (before, we talked about data-driven decisions). By itself, the strategy map contains a lot of data. Another approach is to build a BI dashboard that can be configured to display the most important indicators and their data.
In the strategy template for this article, we have two dashboards (you can switch between them).
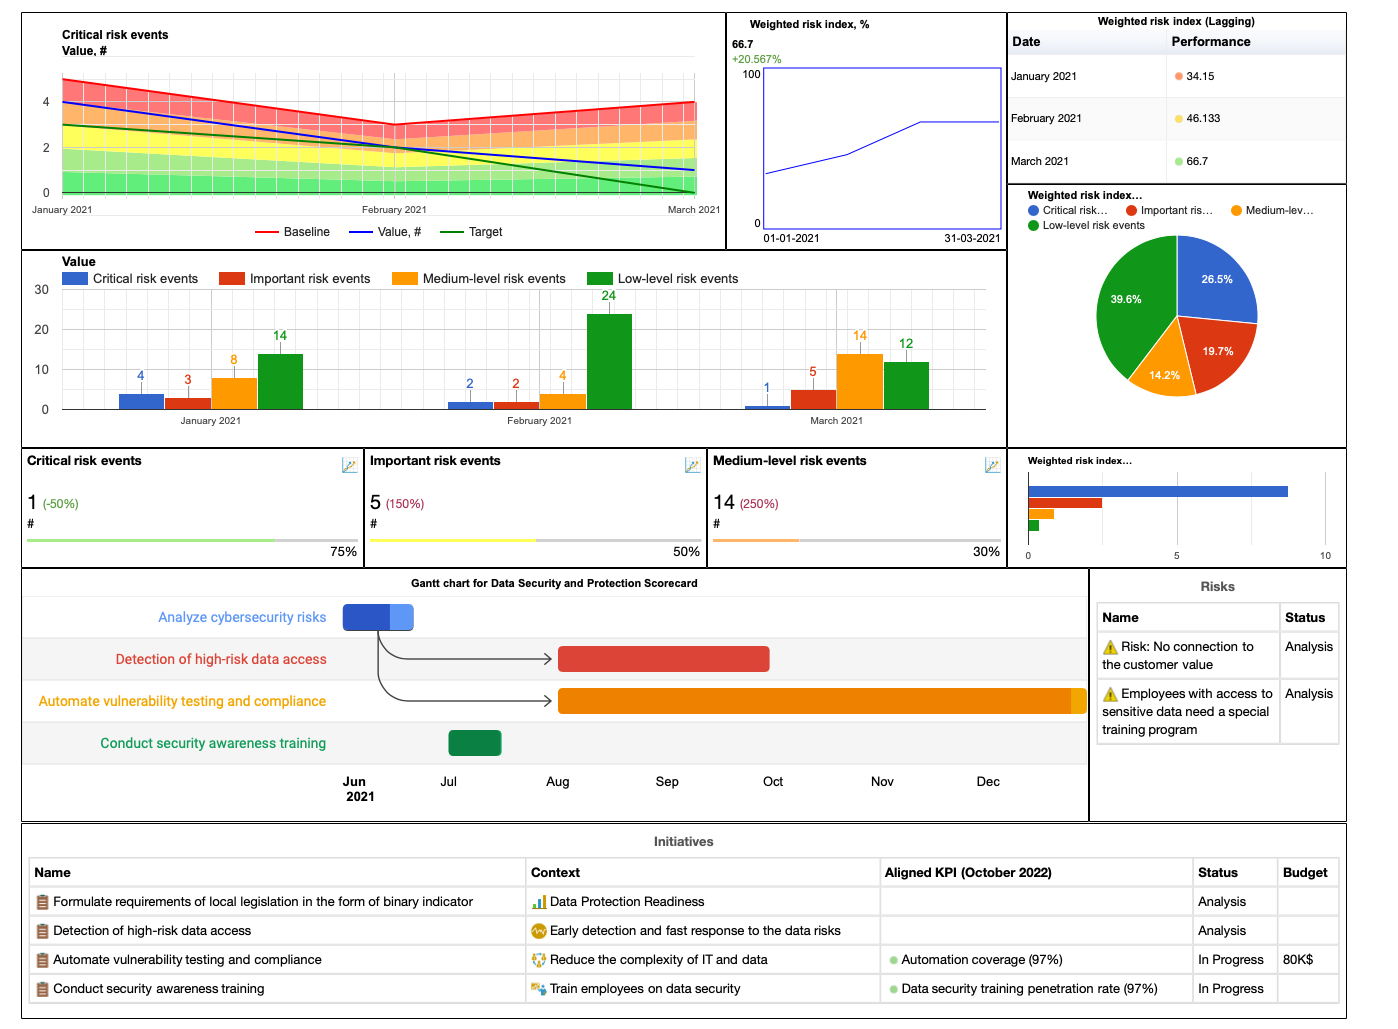
The Risk Index Dashboard is focused exclusively on the risk index indicators that we used to quantify the current risk situation. With the diagrams of the dashboard, we can see:
- Current risks visualized on the gauge charts
- How the risk index was changing over the time
- The contribution of each indicator to the risk index on the weight chart
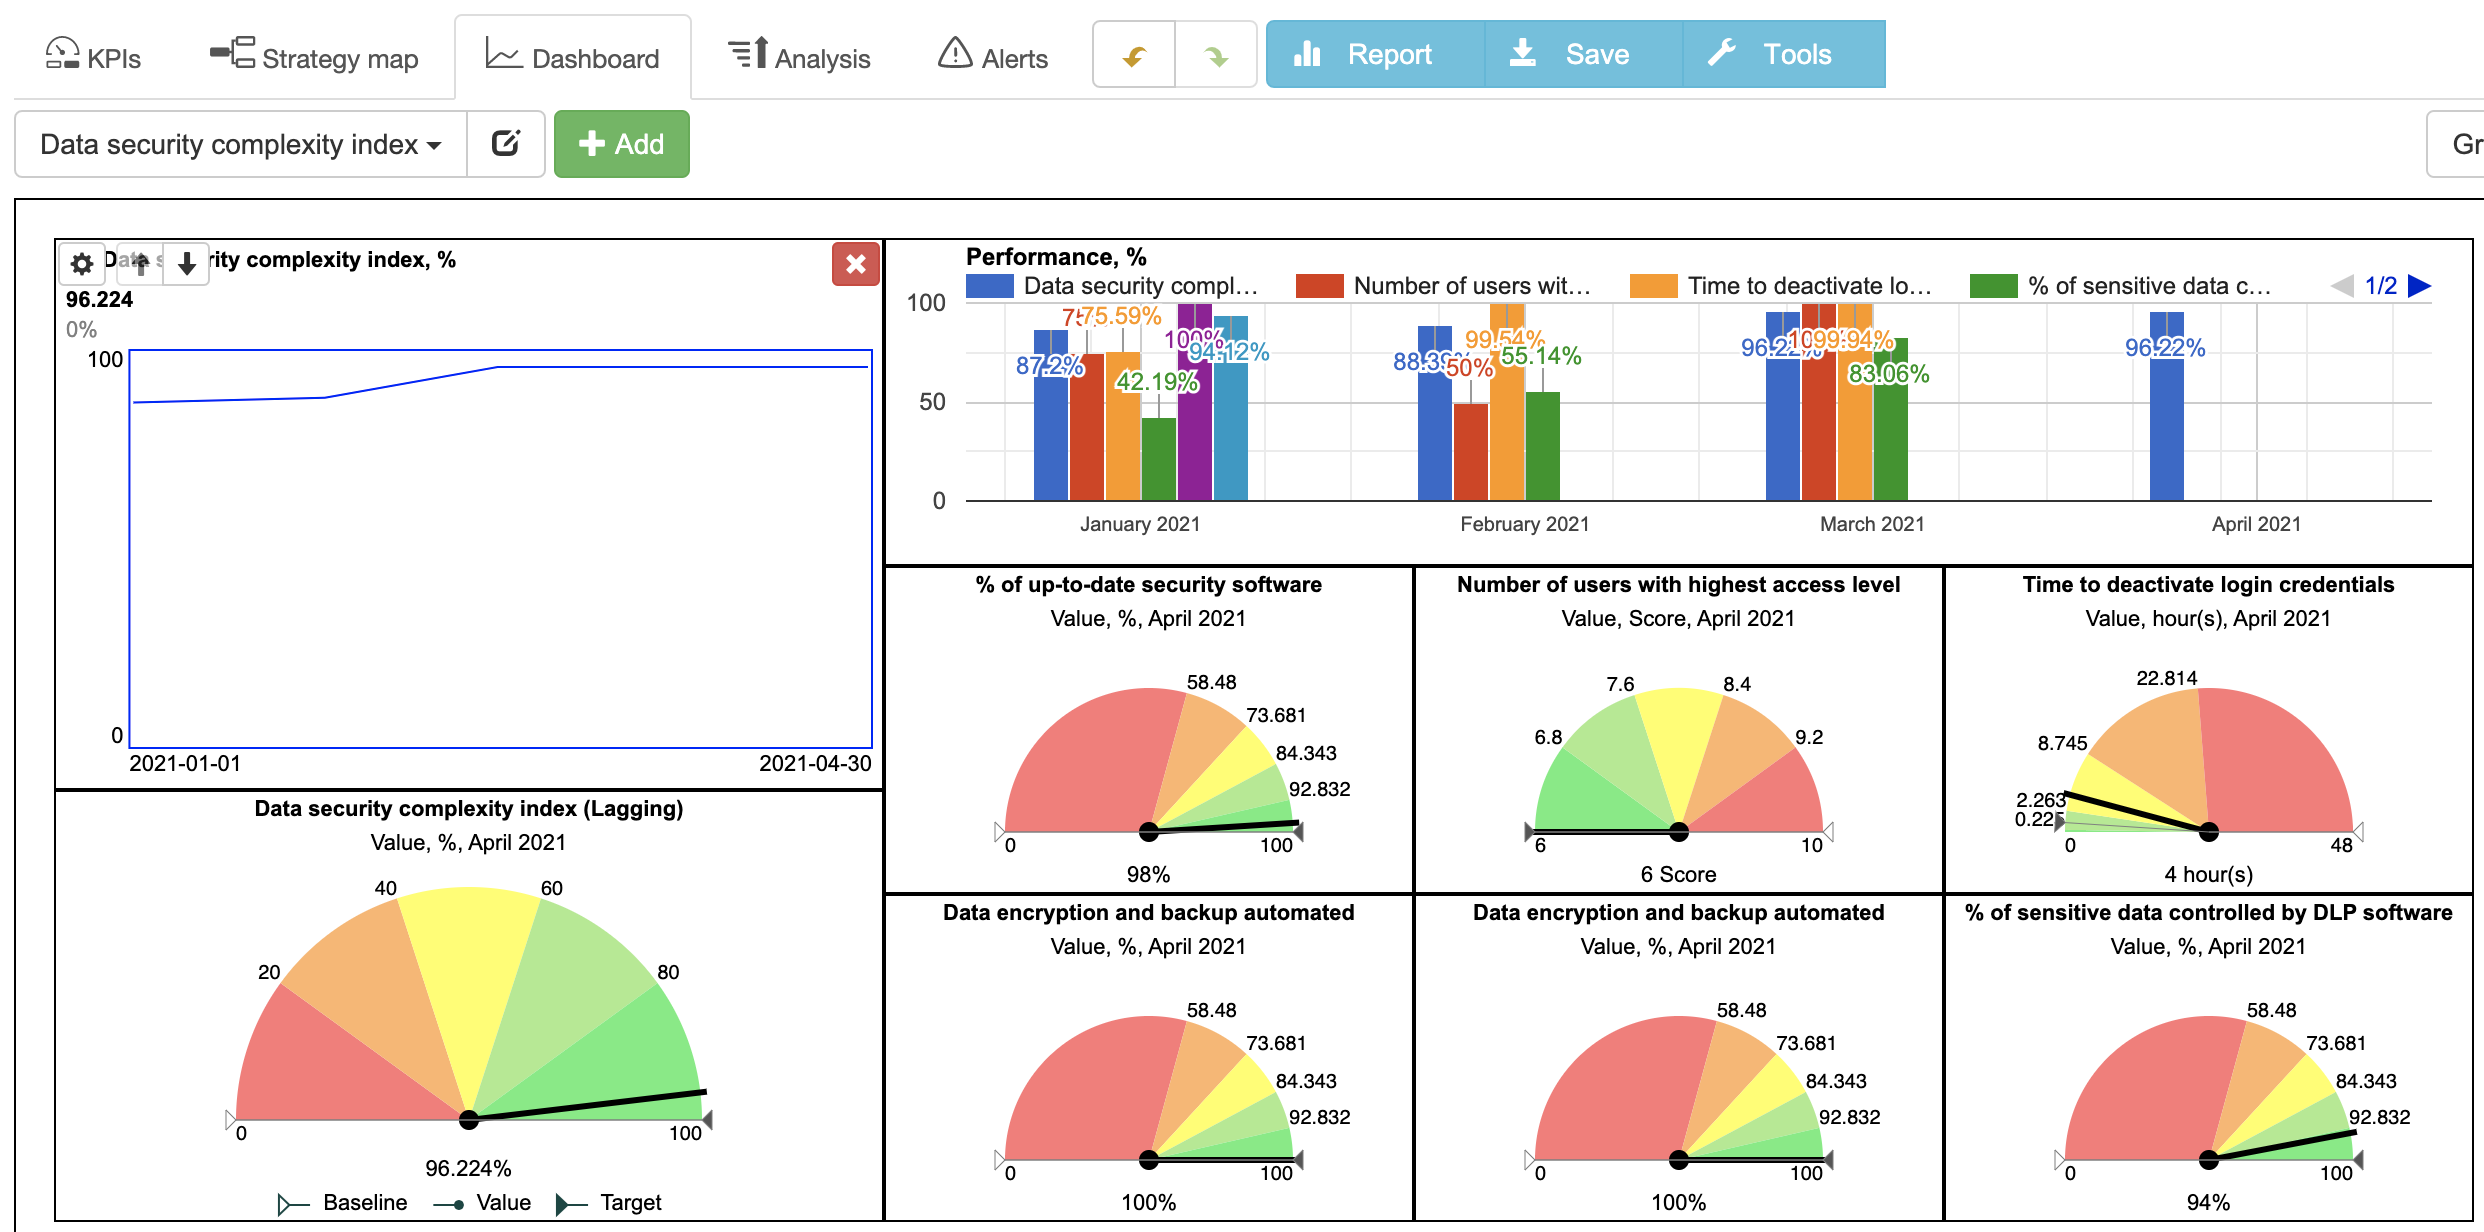
Another dashboard is Data security complexity index. As we discussed, bad complexities of the security systems are the factor of the higher data breach risks. This dashboard visualizes the current state of the complexity as quantified by the selected indicators.
Analyzing Performance Data
Collecting performance data in the form of KPIs is something that most organizations do regularly. It doesn´t matter what automation tool is used, there is a lot of data available.
The question is always how to use this data and convert it into actionable information. Some insights happen when the team discusses a strategy map or a dashboard; finding other insights can be automated.
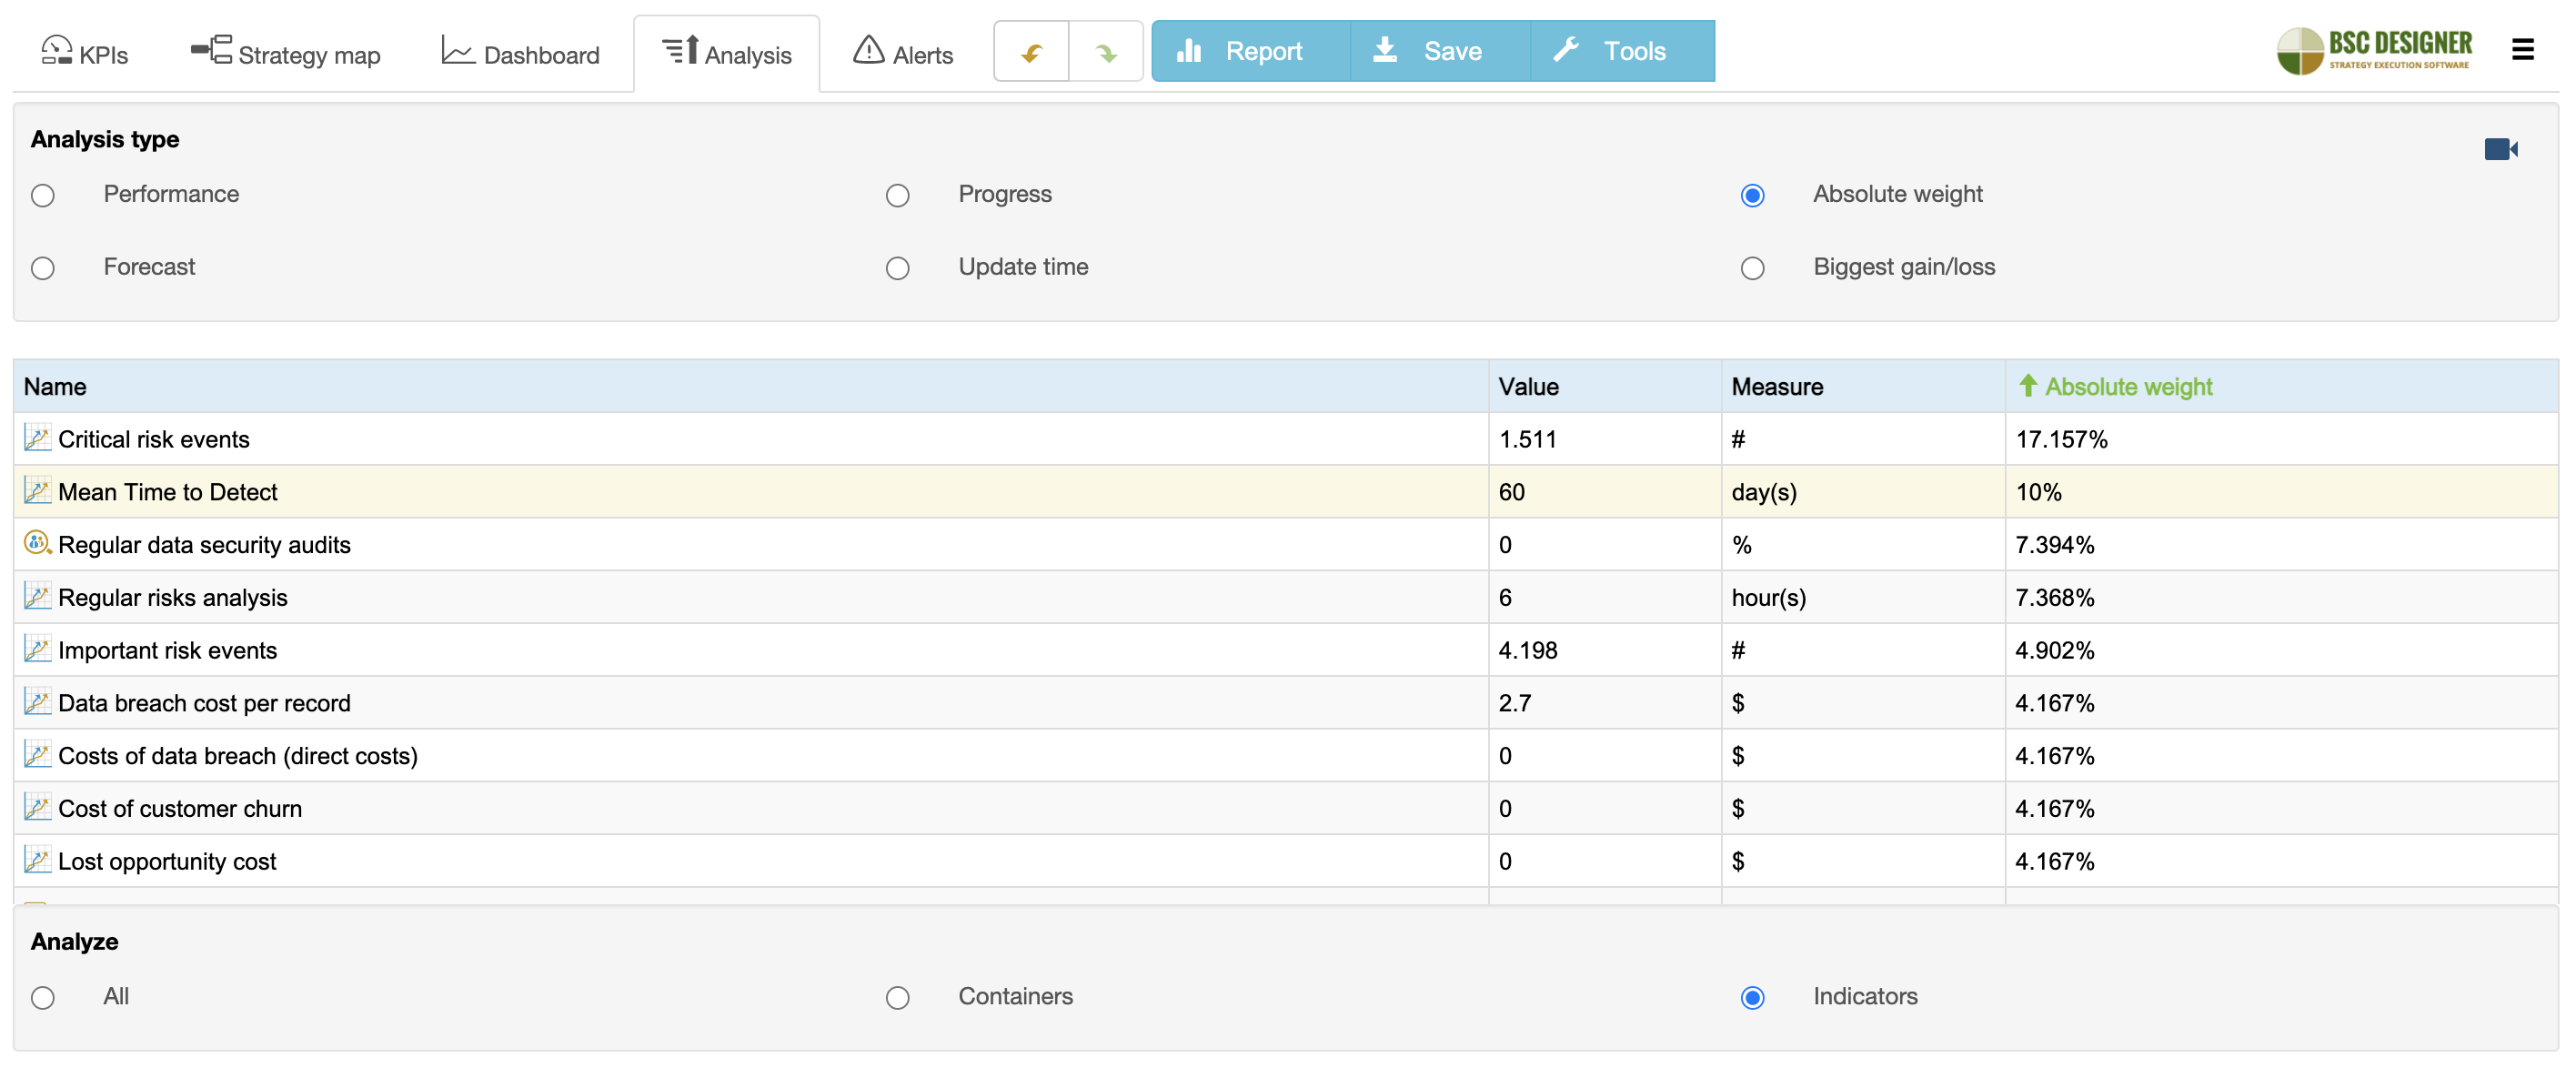
In this sense, the Analysis function in BSC Designer helps a lot. Here are some examples:
- Most of the indicators that we discussed need to be updated regularly. With Update time analysis, you can find the indicators that need to be updated soon or those that were not updated on time. This can also be automated with the Alerts function.
- Each indicator on the scorecard has its weight that reflects the importance of the indicator. With Absolute weight analysis, you can find the indicators with the highest weight. For example, in our example, the indicator Mean Time to Detect has one of the highest weight. If your team considers working on several initiatives, and one of them promises to detect data breaches faster, then give priority to that one.
- Sometimes, interesting findings can be located by simply looking at how the performance data changed. Rapid gain or loss is a sign of some new factors that should be analyzed. Why did the Medium-level risk events indicator have a loss of 30% – was it the result of some internal system update, or is it the problem of reporting?
Map Rationales, Success Factors, and Expected Results
In the free strategic planning course, we discussed the importance of understanding the business context of a goal. It’s not enough to have a well-described goal, it’s important to understand the reasoning behind it, its success factors and expected outcomes that are valuable for the organization.
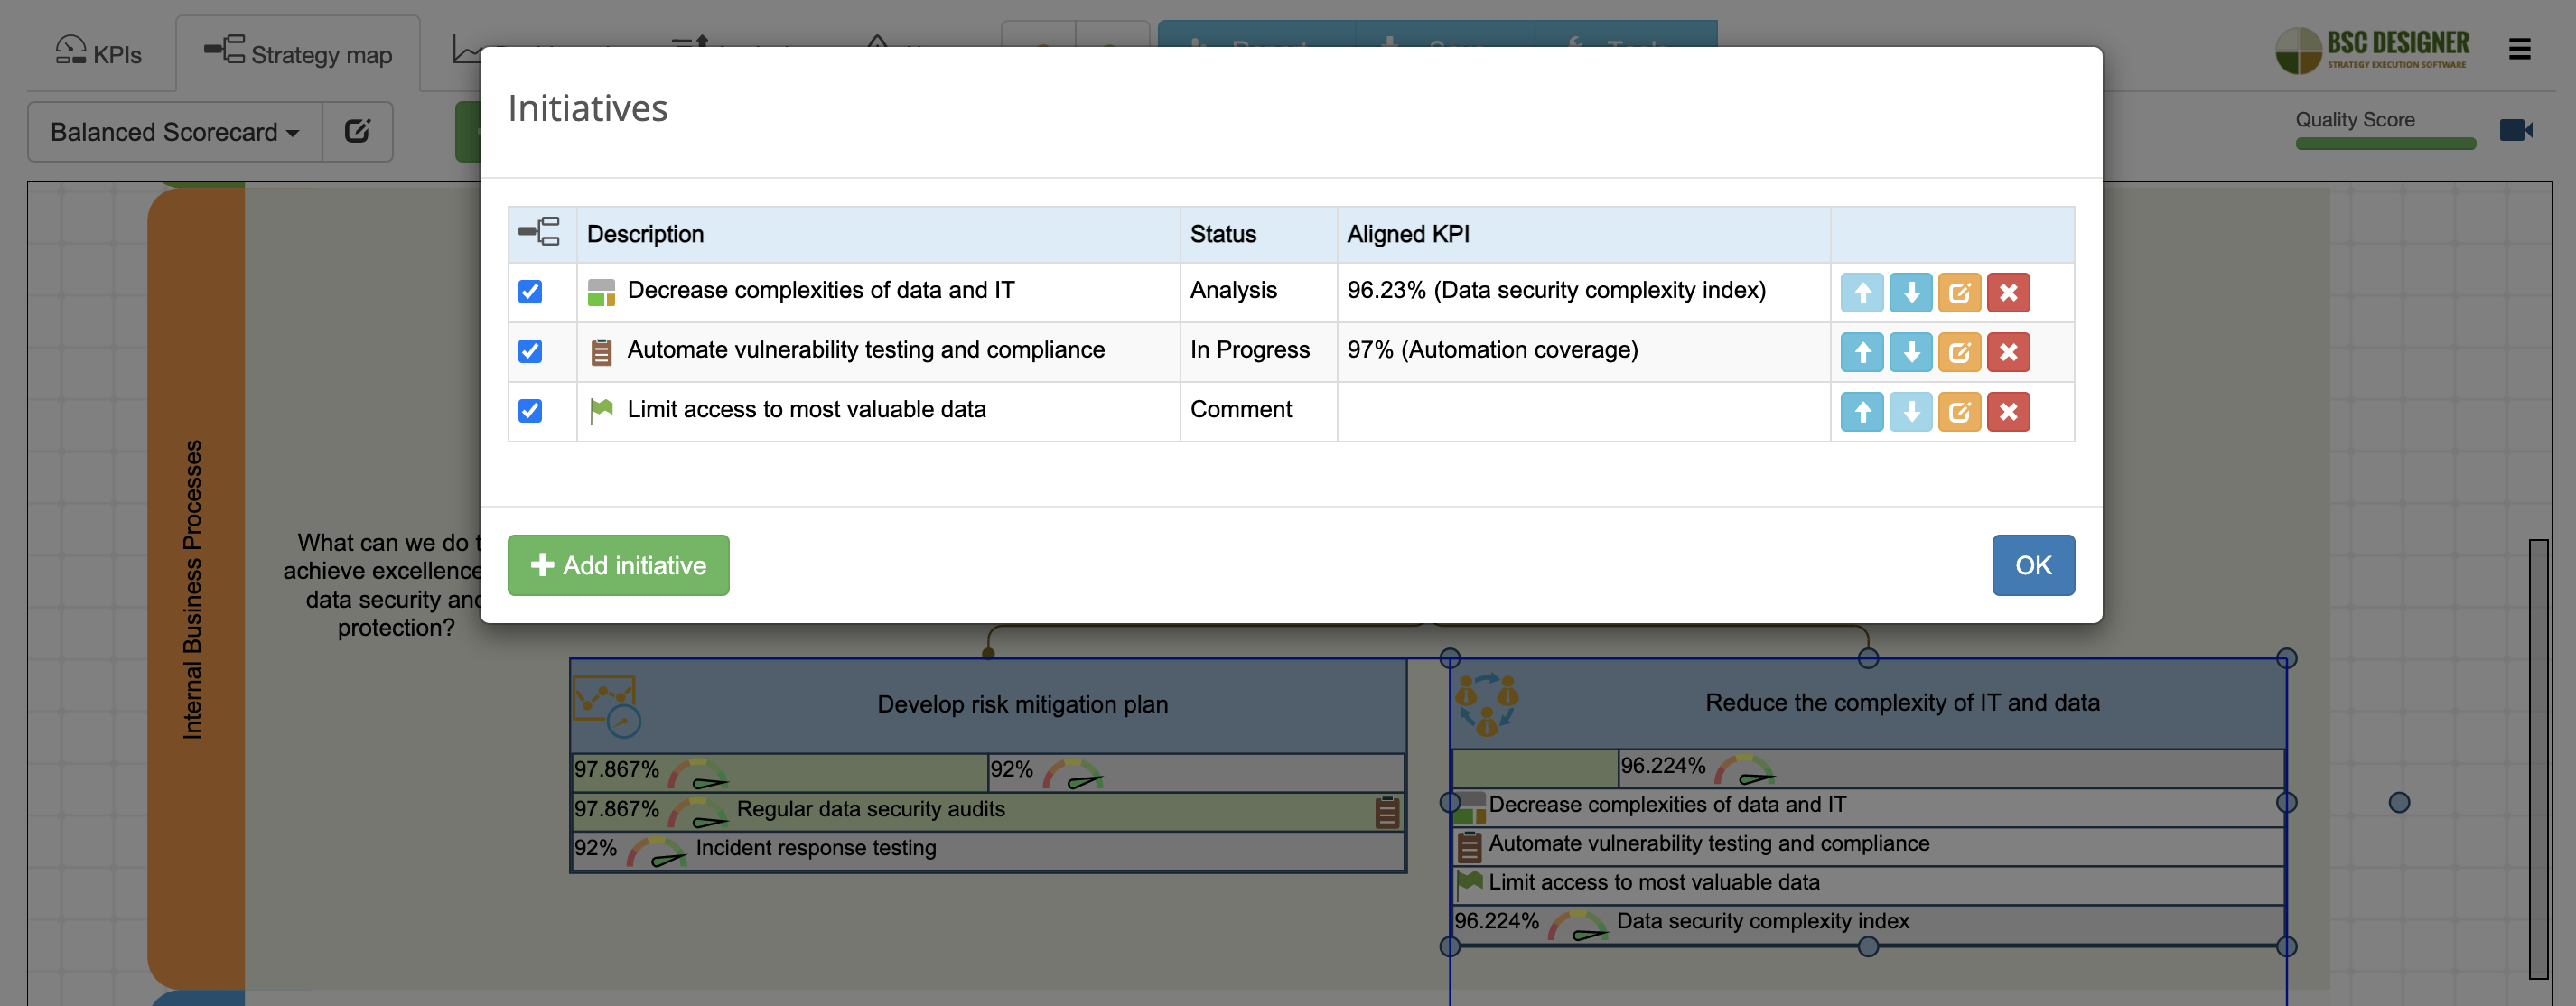
Have a look at the Reduce complexity of IT and data goal from the scorecard template:
- There is a rationale record Decrease complexities of data and IT that explains why this goal is important: “High complexity of software systems and data infrastructure is a risk factor for data breach.”
- There is also a success factor of decreasing complexities – Limit access to most valuable data. It makes perfect sense in the context of the goal – less access to the sensitive data reduces complexity of the data scheme and reduces the risks of data breaches as a result.
In some cases, we don’t have a fixed plan to achieve something, instead we are dealing with an educated hypothesis. The users of BSC Designer can add a hypothesis to their goals. In our example, there was a hypothesis, Remote work is impacting data security aligned with Regular data security audits.
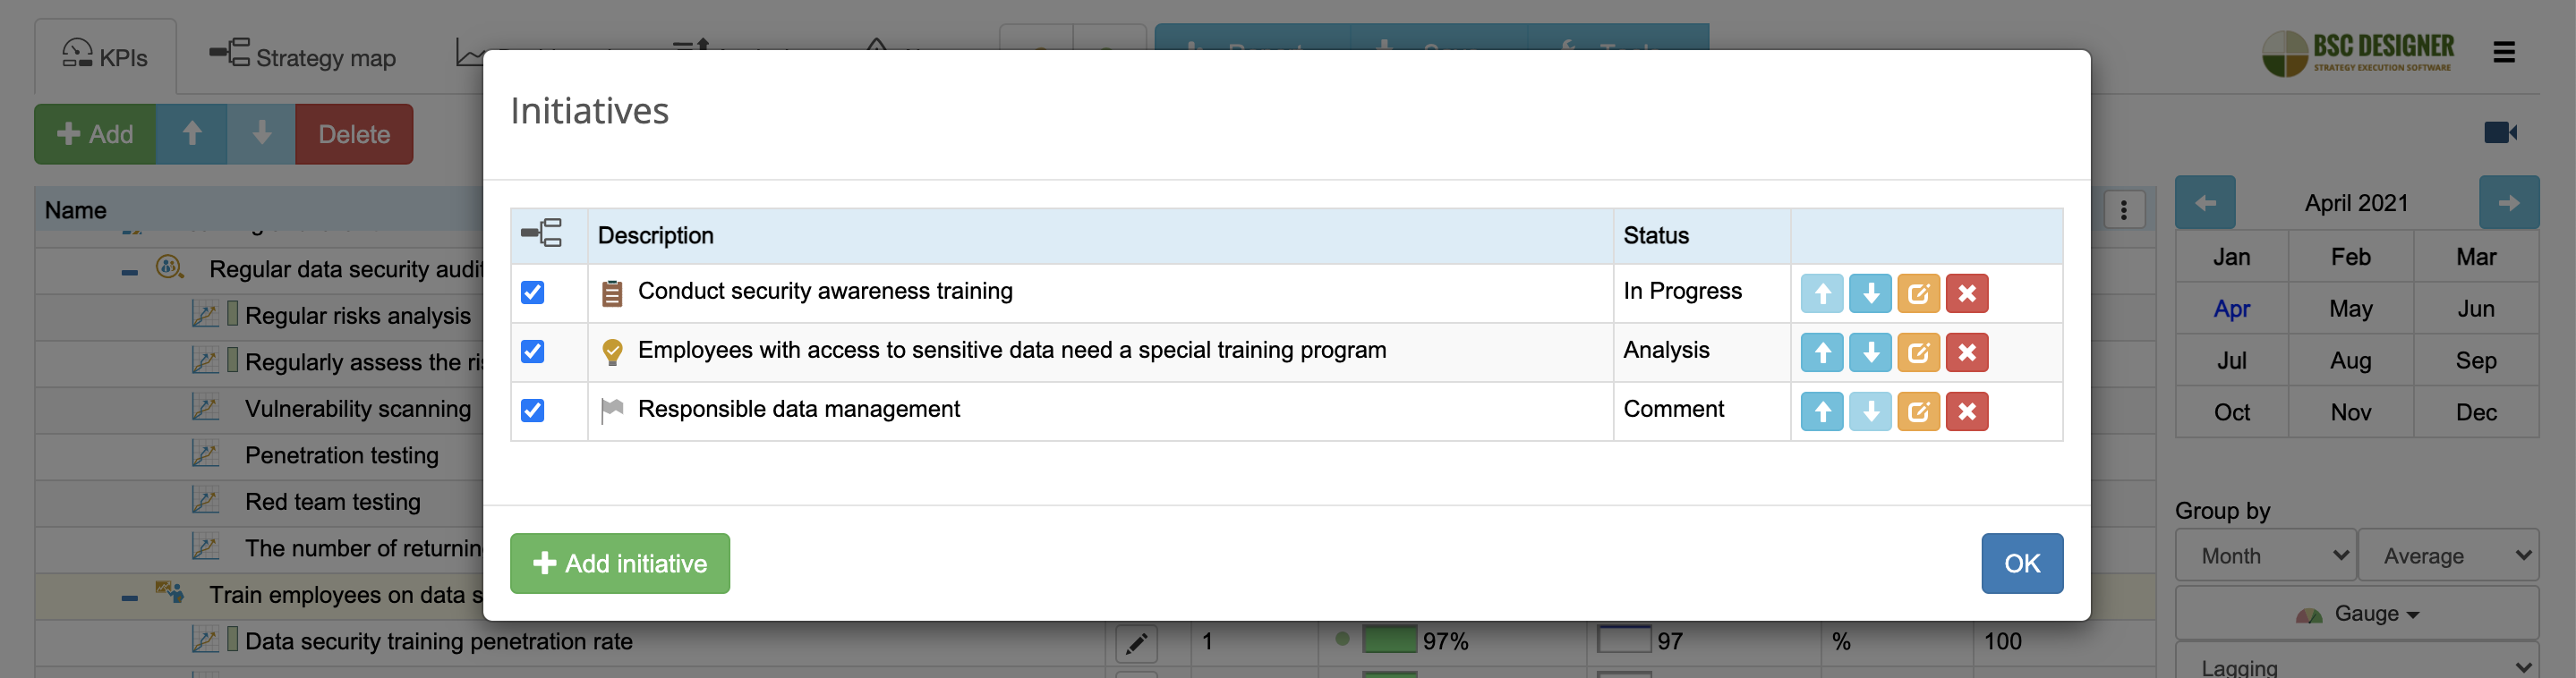
Knowing the expected outcomes is also critical. For example, for the Train employees on data security, we have an expected outcome called Responsible data management. What does it mean in practice? How can we quantify this? These questions open the door for some interesting discussion.
Create Initiatives with Budgets, Owners, and Statuses
To fill the gap between strategy planning and execution, use the initiatives for the goals. Let’s take the Automate vulnerability testing and compliance initiative aligned with Reduce complexity of IT and data.
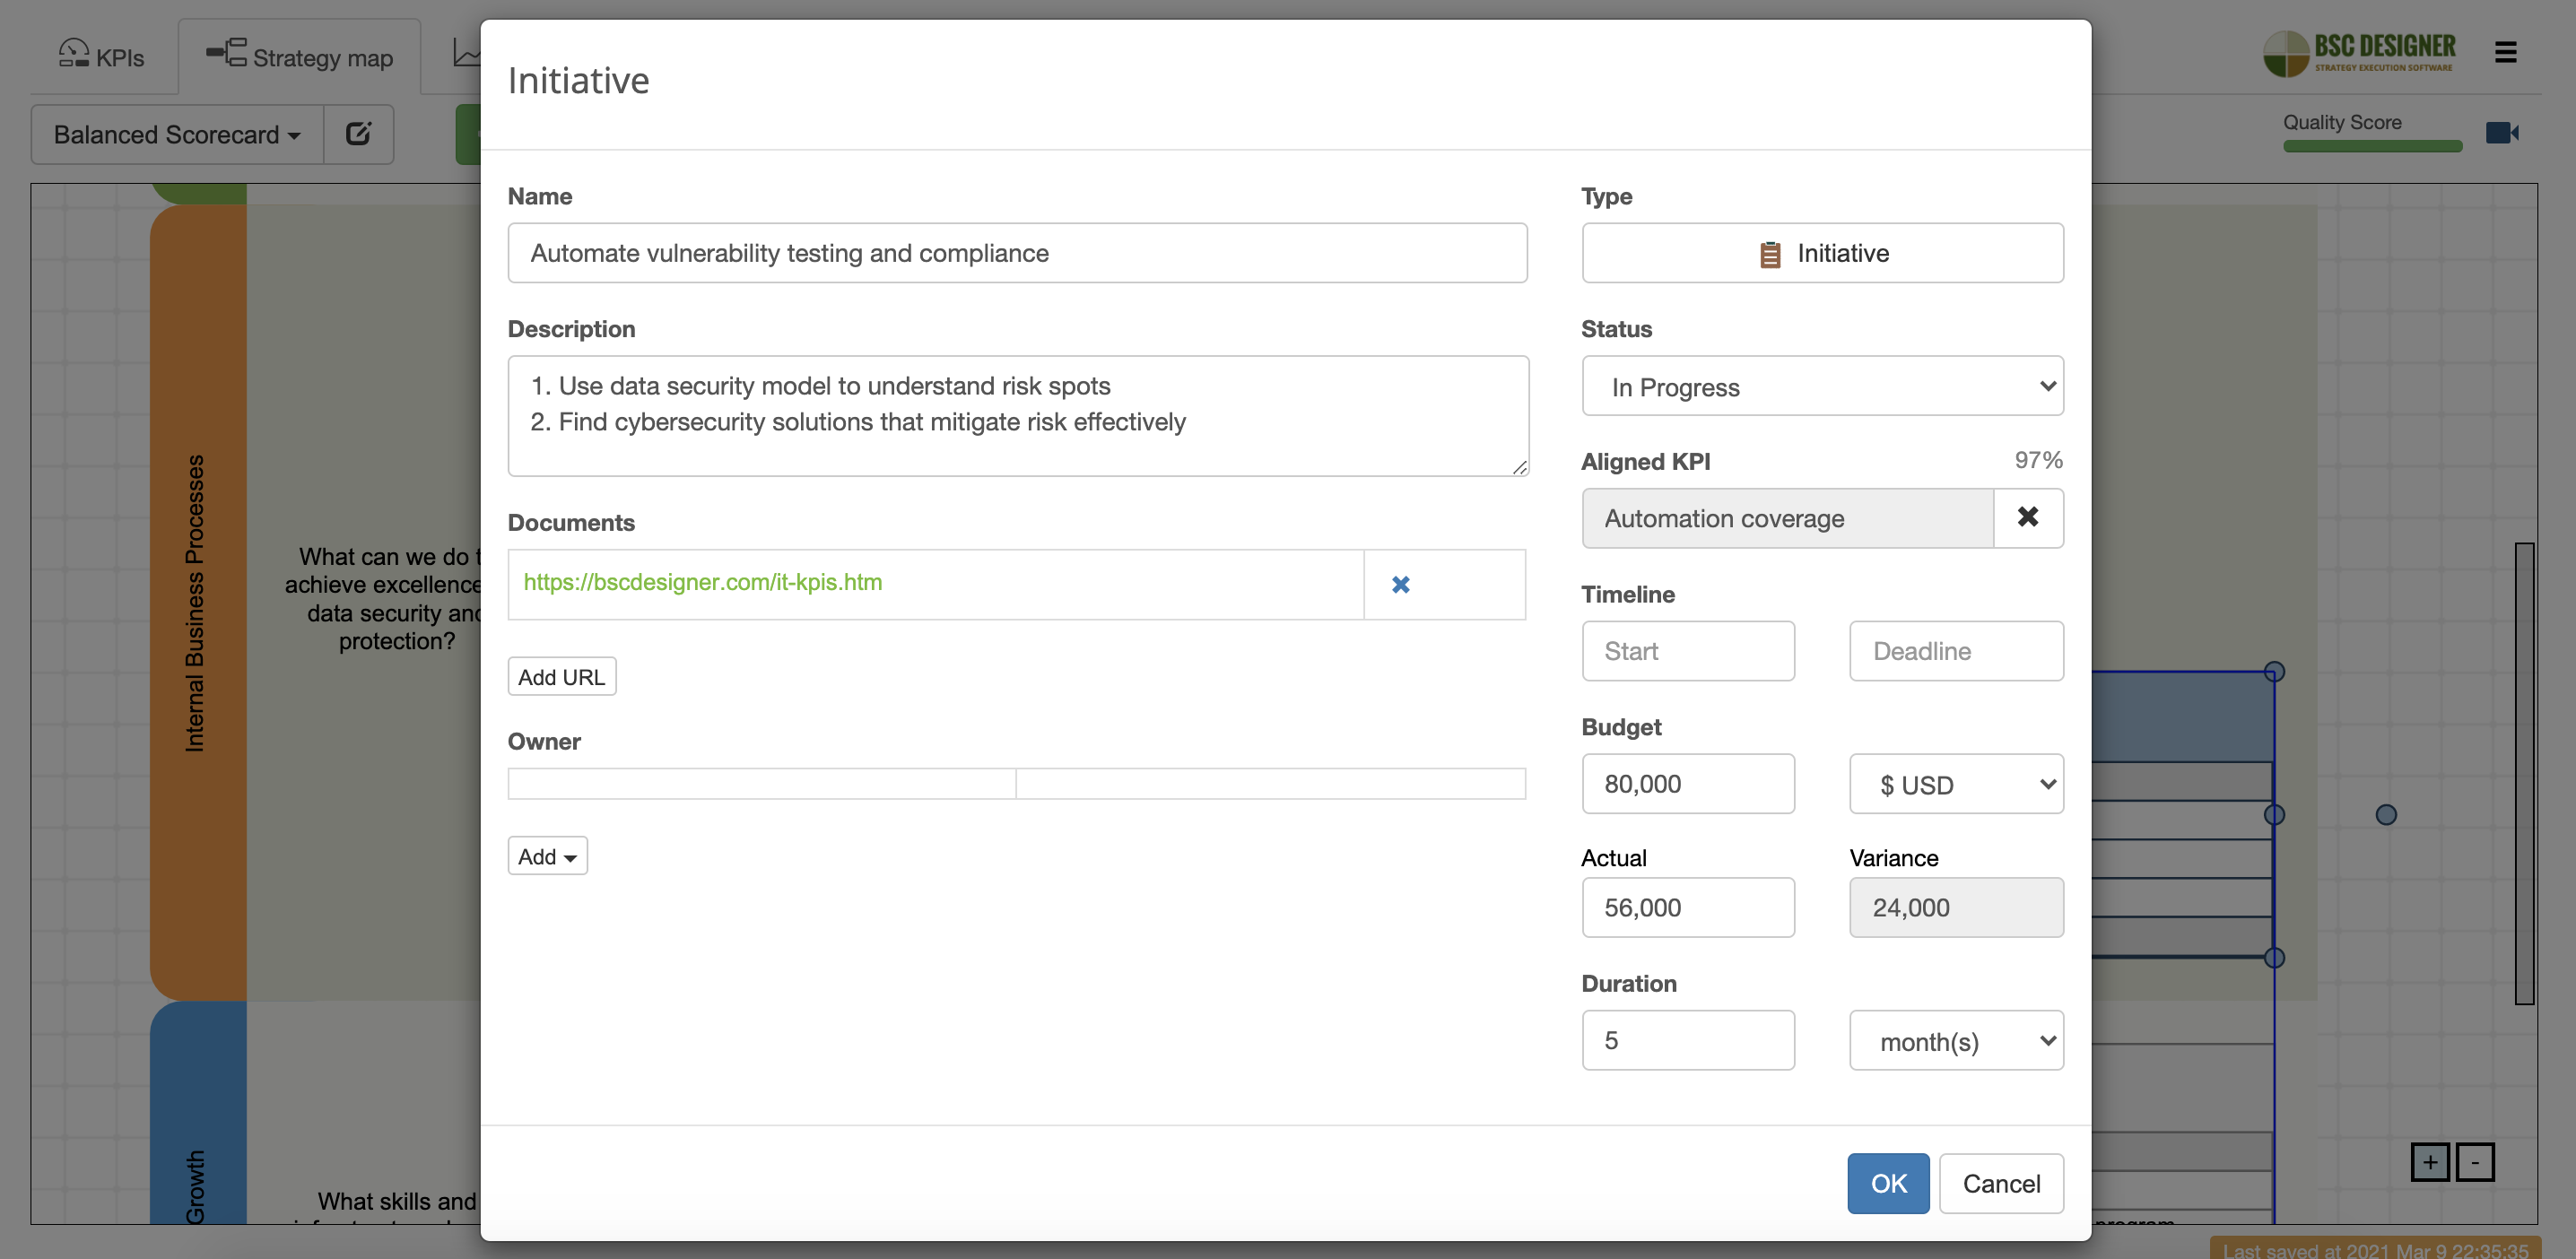
- How exactly is your team going to work on this initiative? Use the description field to add a detailed action plan.
- How is it aligned with other risk mitigation plans? Use the documents section to link to the relevant resources. In our example, we linked to the IT scorecard example.
- Who is responsible for this initiative? Assign owners so that they get a notification when something relevant happens.
- What is the current status of the initiative? Update the status along with the progress of your team working on the initiative.
- How can you track the progress in the context of this initiative? In our example, we’ve linked it to the automation coverage, % indicator that forms a Data security complexity index.
Conclusions
In this article, we discuss an example of a data security strategy. Here are the most important ideas that we discussed:
- There are known risk factors of data breach, as well as proven ways to minimize the impact of security incidents.
- Help your stakeholders understand the direct and indirect costs of data breaches.
- Focus your strategy on detecting problems early and responding fast.
- Have a risk mitigation plan and response team to decrease the impact of data breaches.
- Reduce bad complexities of IT systems and data schemes.
- Update risk models regularly, test your security environment.
- Human factor is one of the risk spots – educate your team, look at the changes in the behaviour, not just at formal exam scores.
What’s next? A good cyber strategy is tailor-made according to the needs of your organization. Use the security strategy template discussed in this article as a starting point to start building your own data security strategy. Feel free to share your challenges and findings in the comments.
What's next?
- Follow our
 Strategy Implementation System to align stakeholders, strategic ambitions, and business frameworks into a comprehensive strategy.
 - Automate strategic planning with BSC Designer by organizing goals, initiatives, risks, and KPIs into scorecards.
More About Strategic Planning


- Cost of a Data Breach Report. 2020, IBM Security ↩
- 2020 Data Breach Investigations Report, 2020, Verizon ↩
- Global Information Security Survey, 2020, EY ↩
- M-TRENDS Report, 2020, FireEye ↩
![]() CEO | Author | Speaker
CEO | Author | Speaker
BSC Designer is strategy execution software that enhances strategy formulation and execution through tangible KPIs. Our proprietary strategy implementation system reflects our practical experience in the strategy domain.