Business Continuity Management (BCM) ensures that critical functions of an organization remain operational to minimize the impact of disruptions on stakeholders. Let’s explore the practical steps to implement Business Continuity Management within the context of strategic planning.
An approach to business continuity management according to ISO 22301 involves:
- Identifying critical business elements
- Analyzing threats and risks
- Creating prevention and response plans, including training and simulations
- Tracking and learning from incidents
To integrate these elements into strategic planning:
- We will employ a value-based decomposition method
- Quantify strategies and plans with performance metrics
- Maintain actionable records in the form of initiatives, risks, and comments
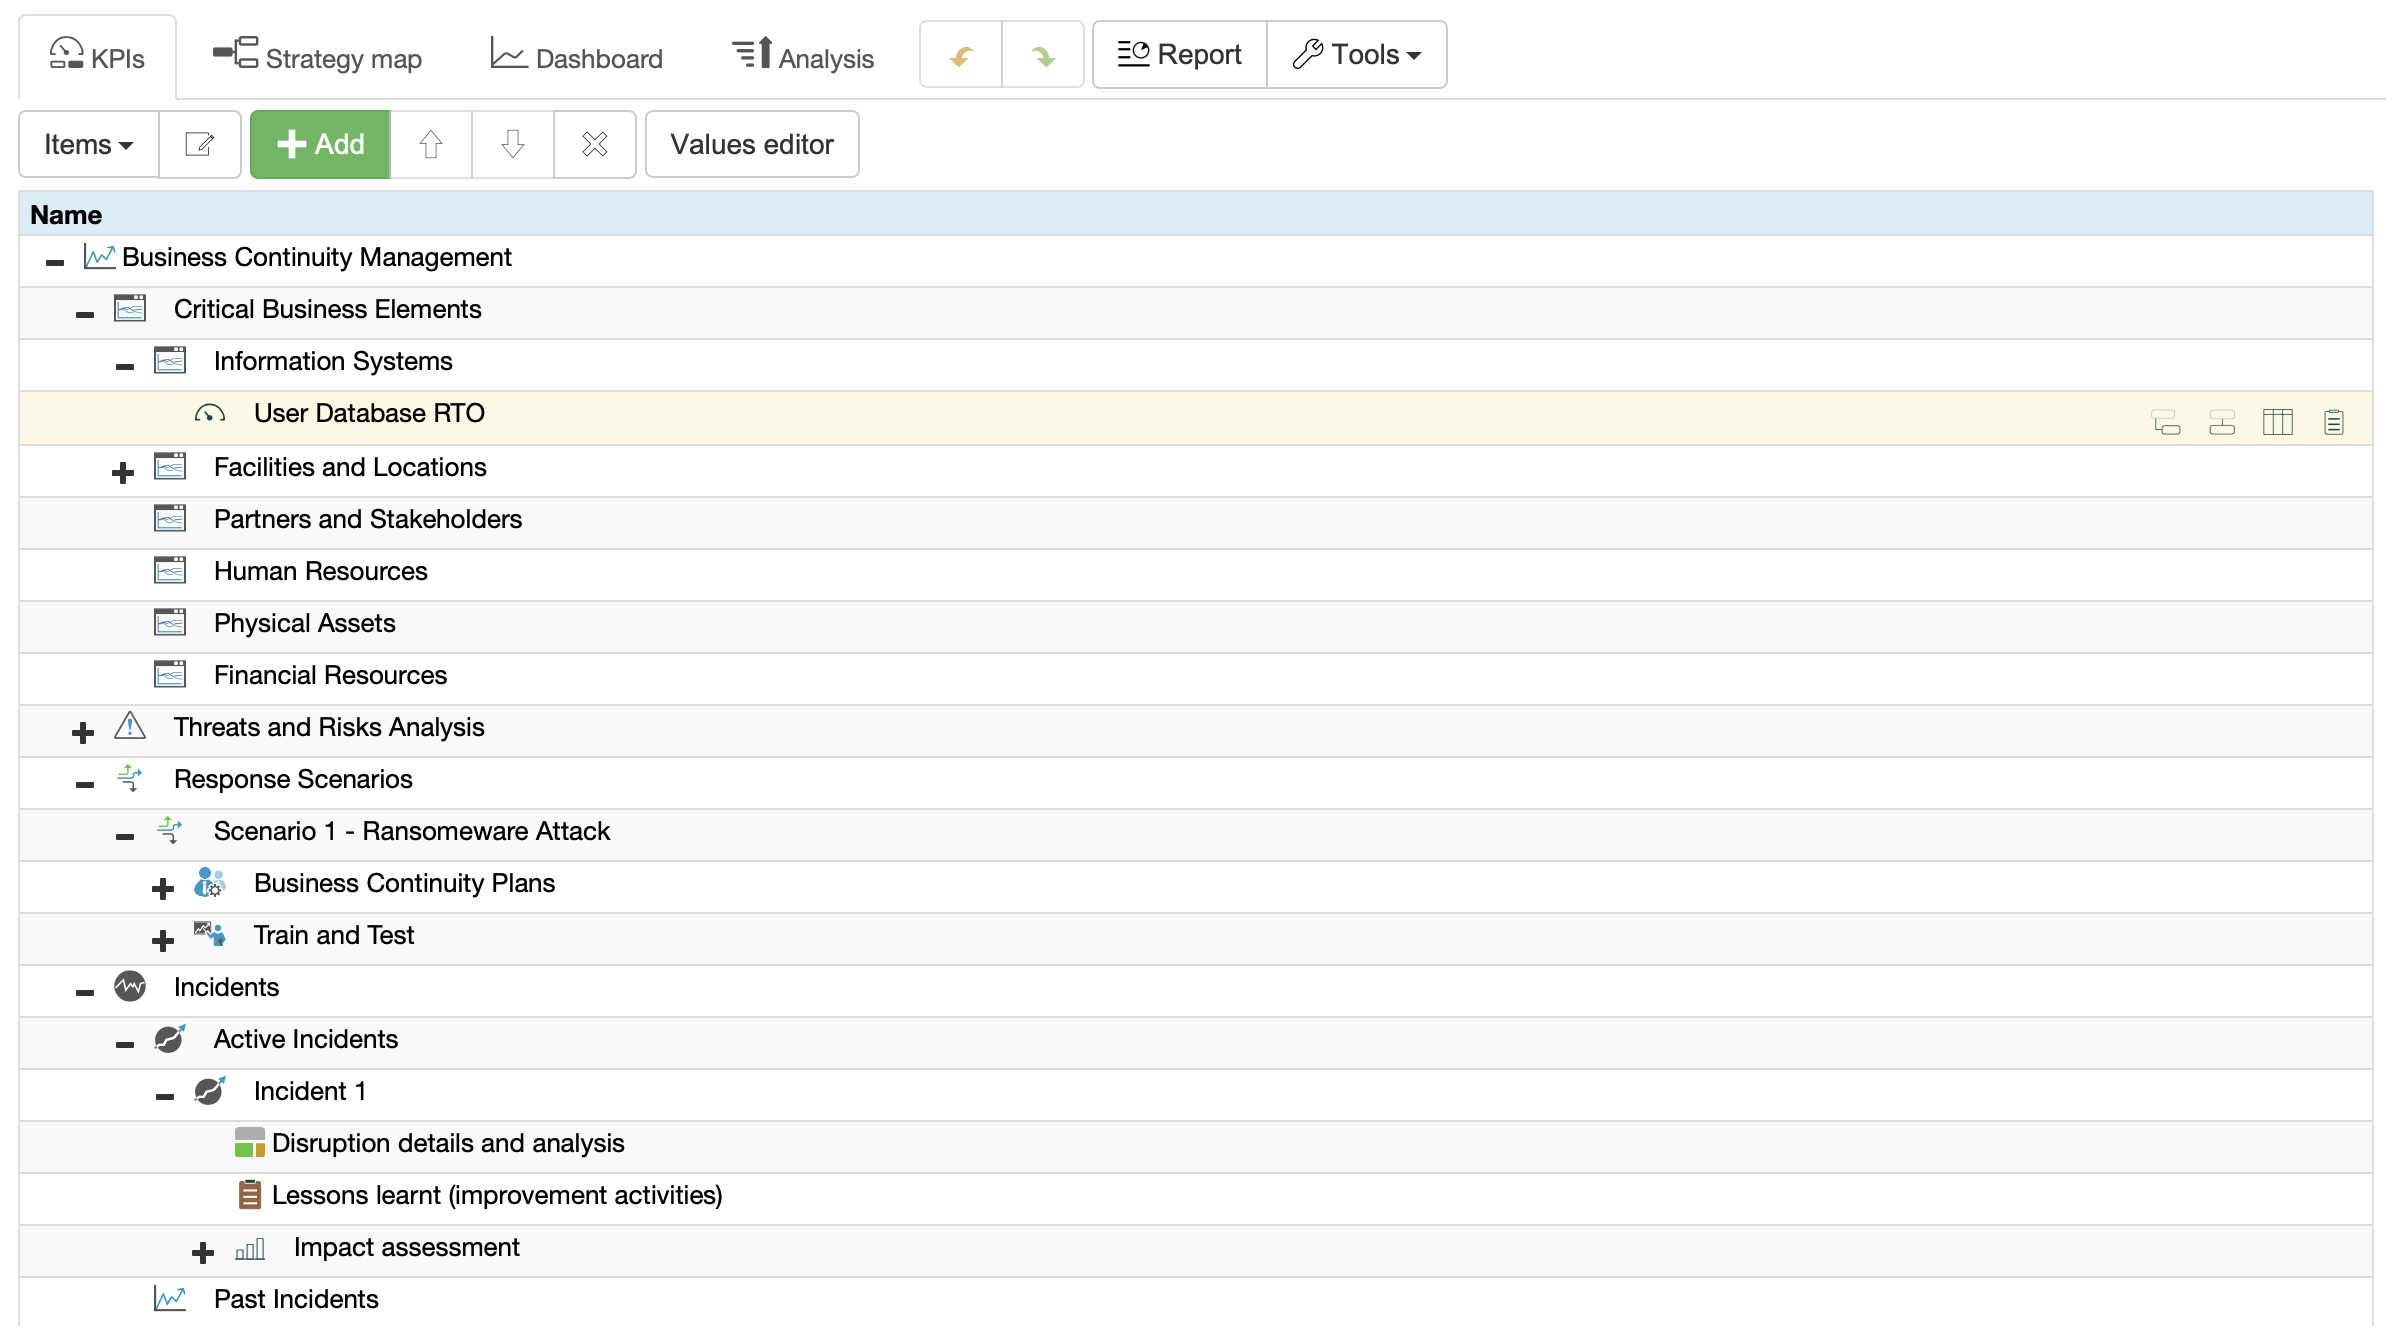
Identification of Critical Business Elements
Our goal is to identify key business elements critical for business continuity. We use the following perspectives as a starting point:
- Information Systems
- Facilities and Locations
- Partners and Stakeholders
- Human Resources
- Physical Assets
- Financial Resources
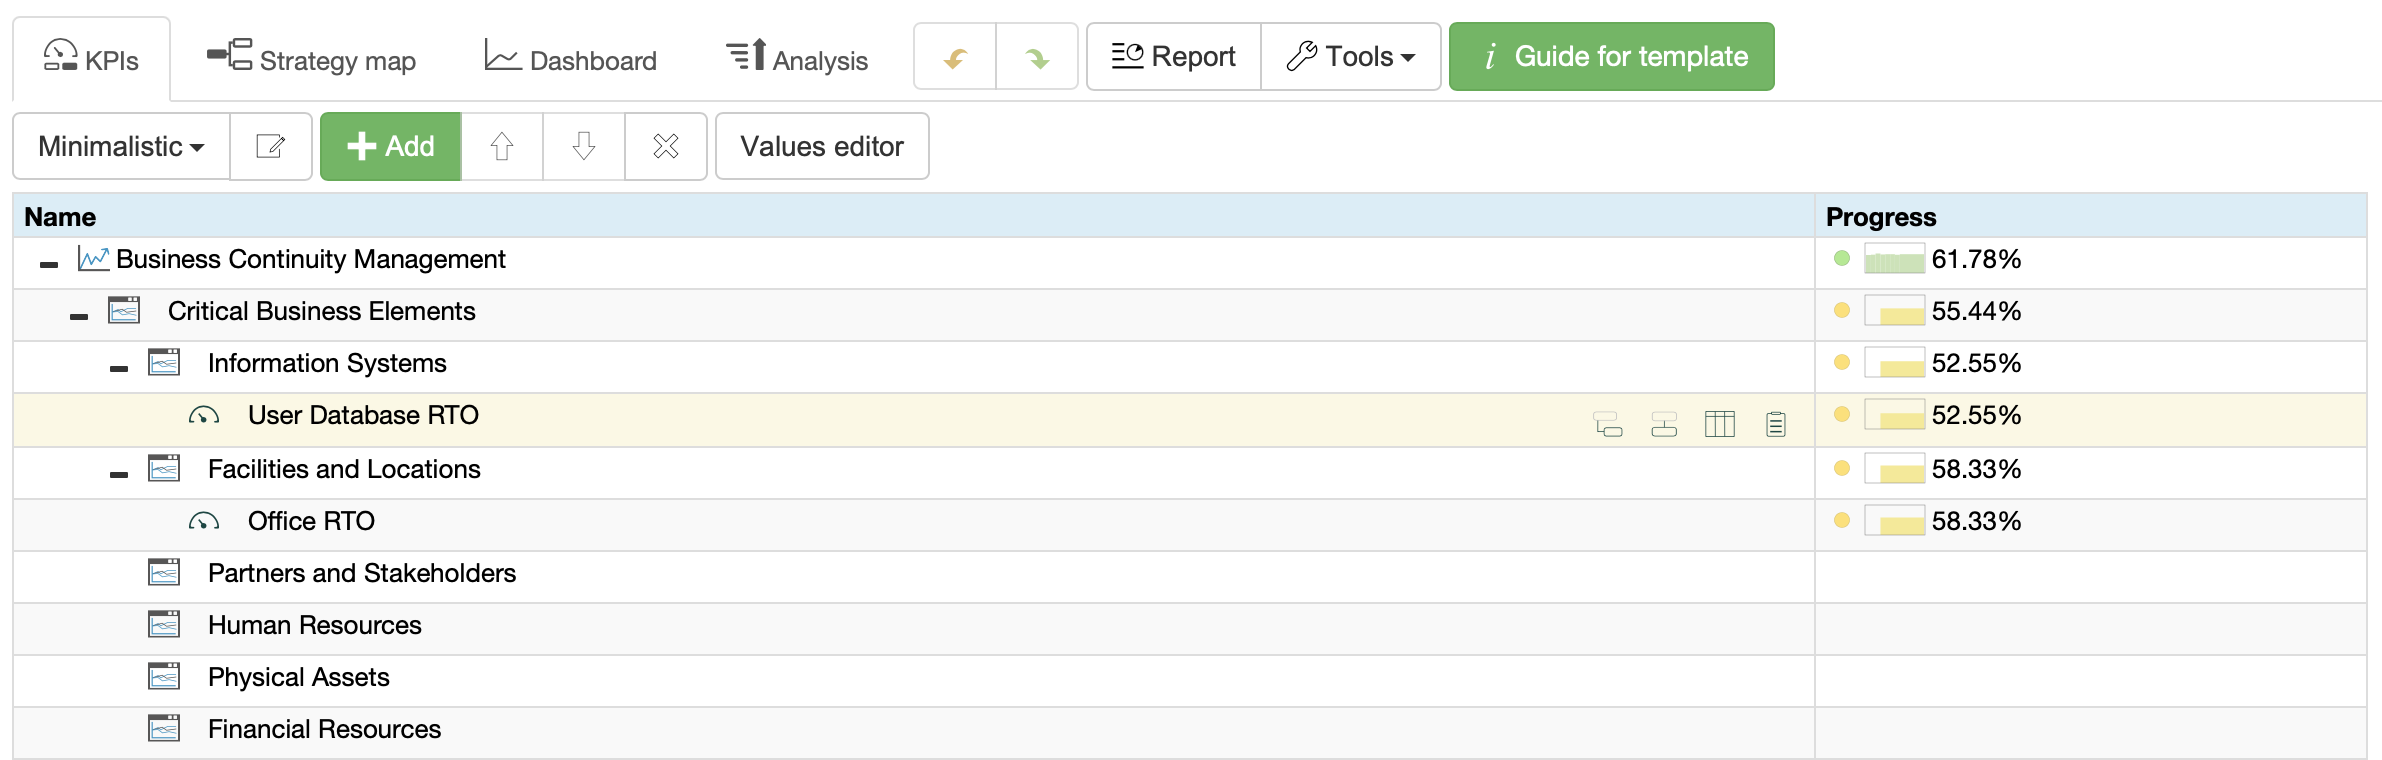
Once the elements and sub-elements are defined, we can quantify their susceptibility to risk events by establishing Recovery Time Objectives (RTO).
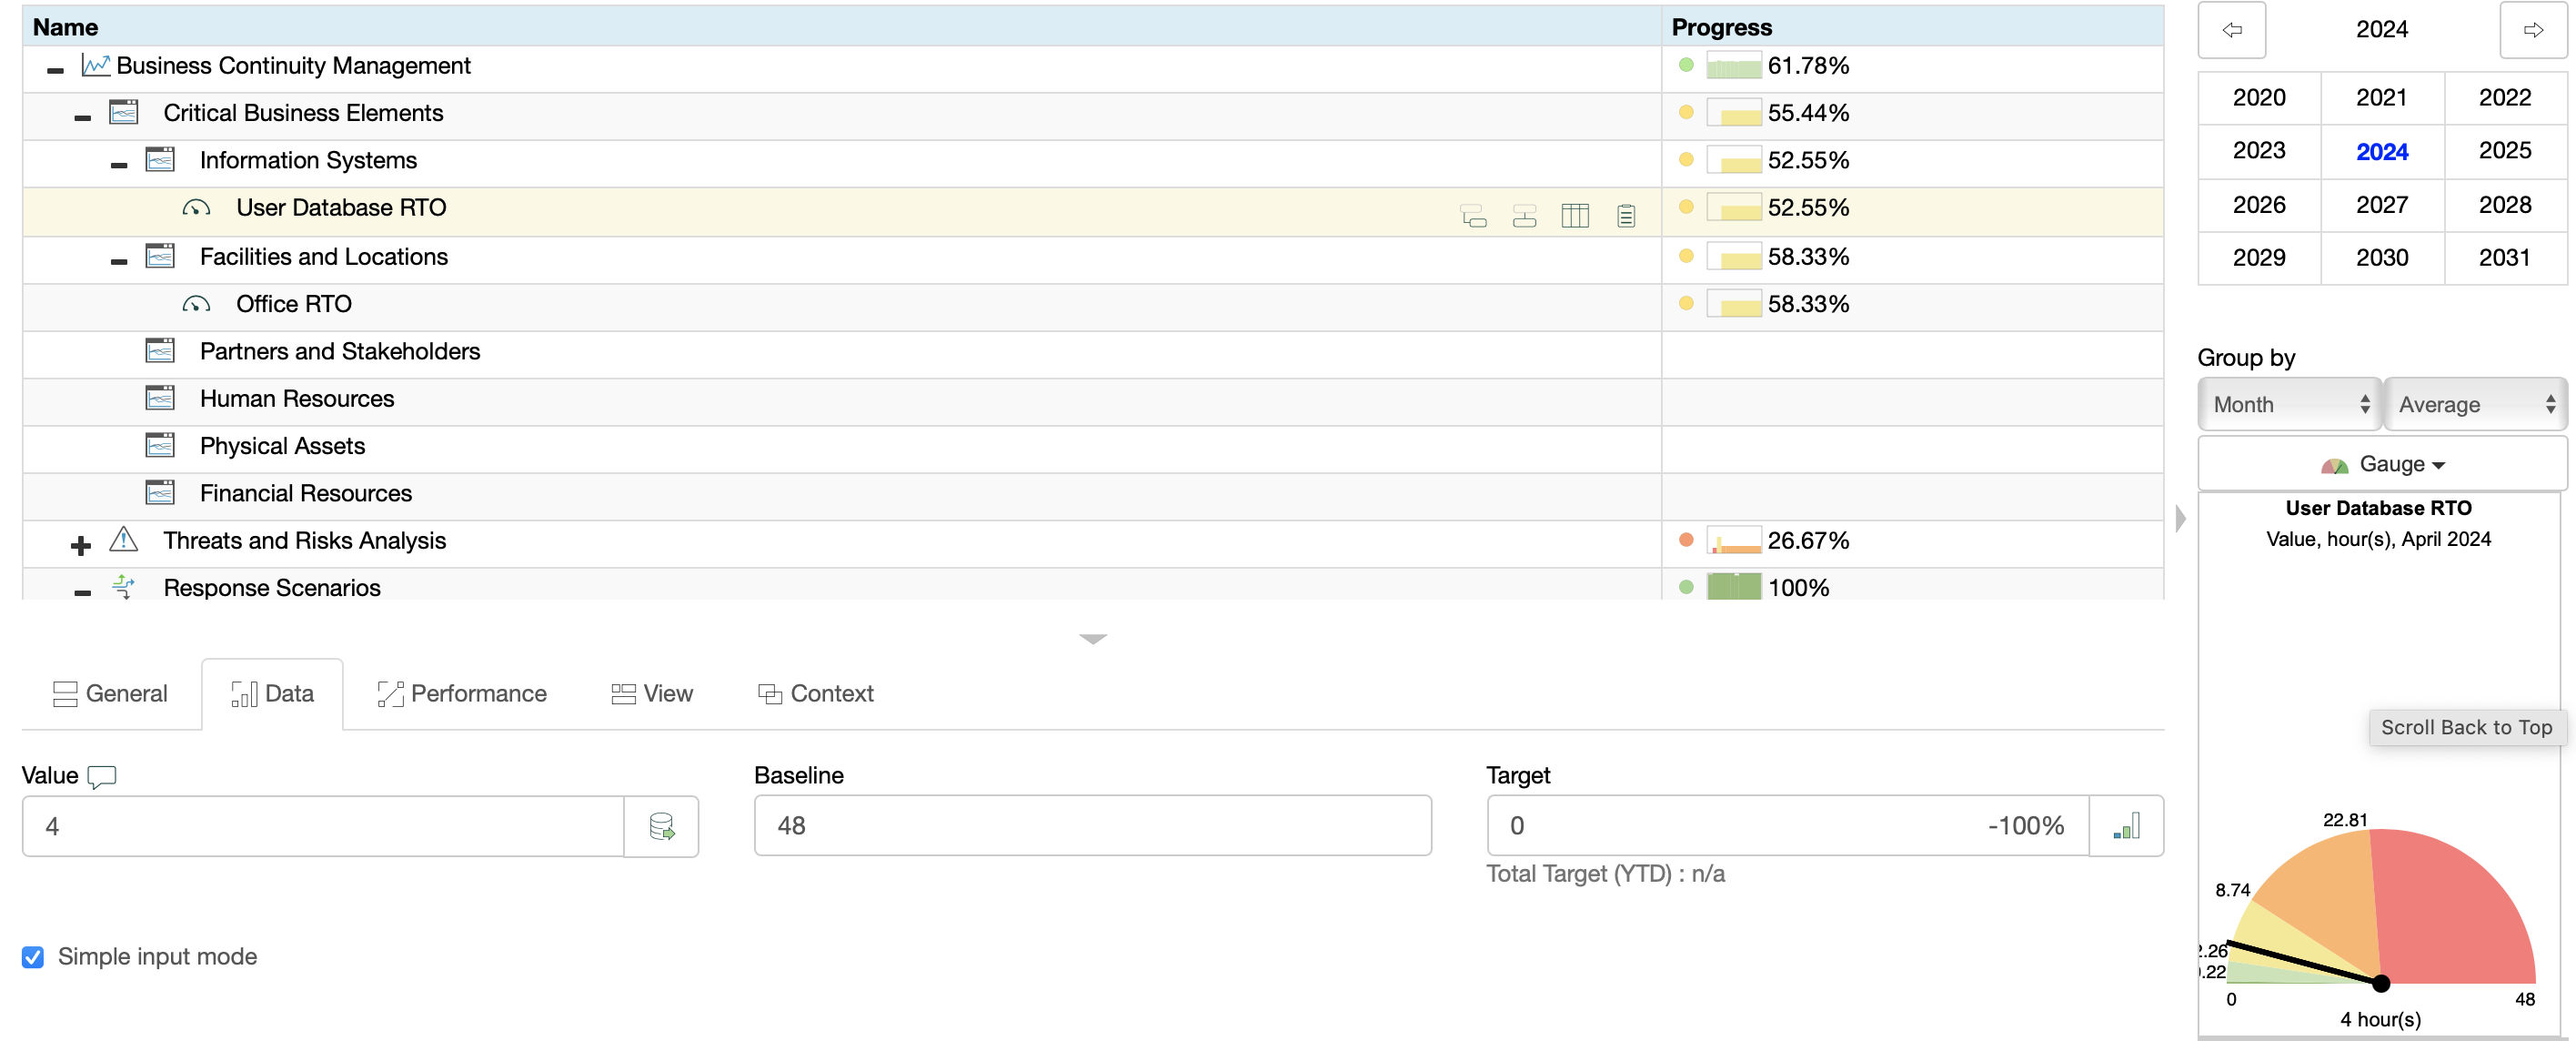
For the Recovery Time Objective, we define:
- Measurement units (e.g., hours or days)
- The “Baseline” as the catastrophic recovery time
- The “Target” as the desired recovery time
- The current value, as the estimated recovery time based on technologies and policies in place
With this data, we can calculate the performance of each business element in terms of susceptibility or readiness in case of an emergency event.
In this context:
- A lower value (e.g., faster recovery time) will result in higher performance
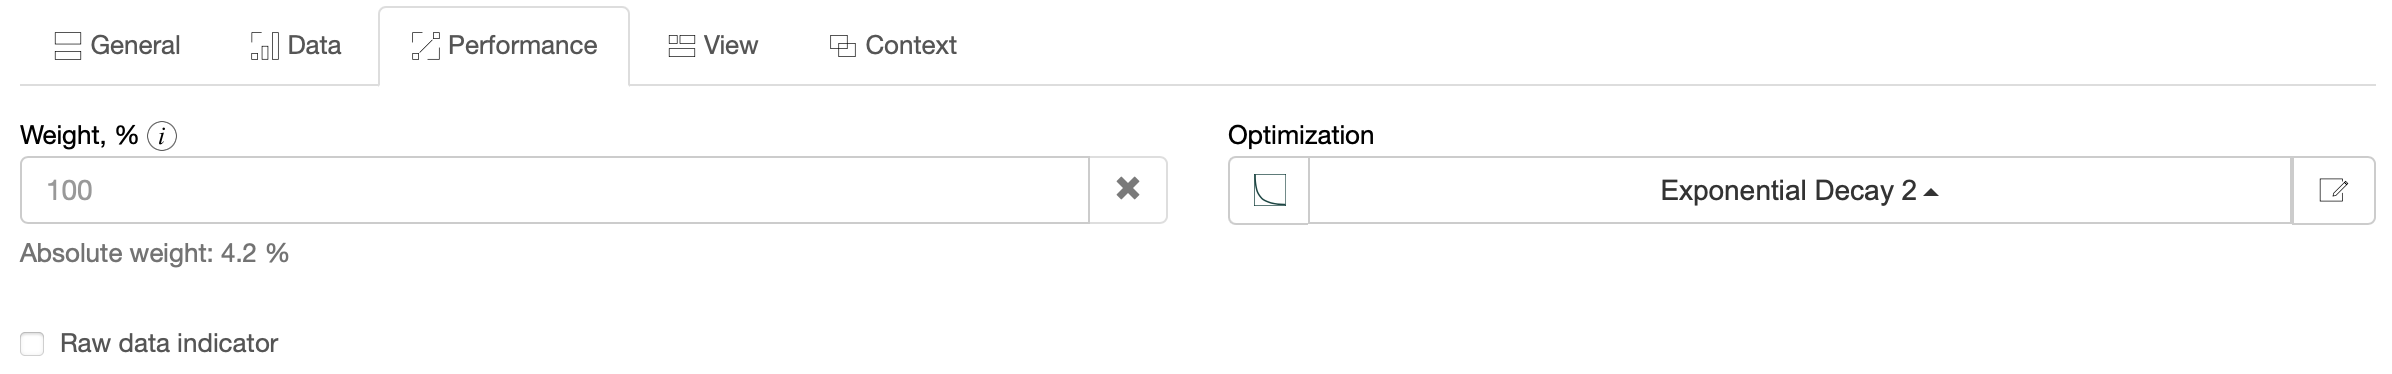
- The performance function should not be linear; the extensive area next to the “catastrophic” baseline should be the red zone
In BSC Designer:
- Define the required recovery baseline, target, and current value on the Data tab.
- Use the “Exponential decay” function to create a performance function with a relatively small green zone for recovery times near the target and a significant red zone for longer recovery times.
The software enables the tracking of RTOs for each business element over time.
Threats and Risks Analysis
Analyze potential threats using these perspectives as a starting point:
- Operational
- Technological
- Economic
- Workforce
- Safety and security
- Environmental
- Reputation
- Legal
For each relevant threat, perform a decomposition into specific risks and conduct a Business Impact Analysis (BIA).
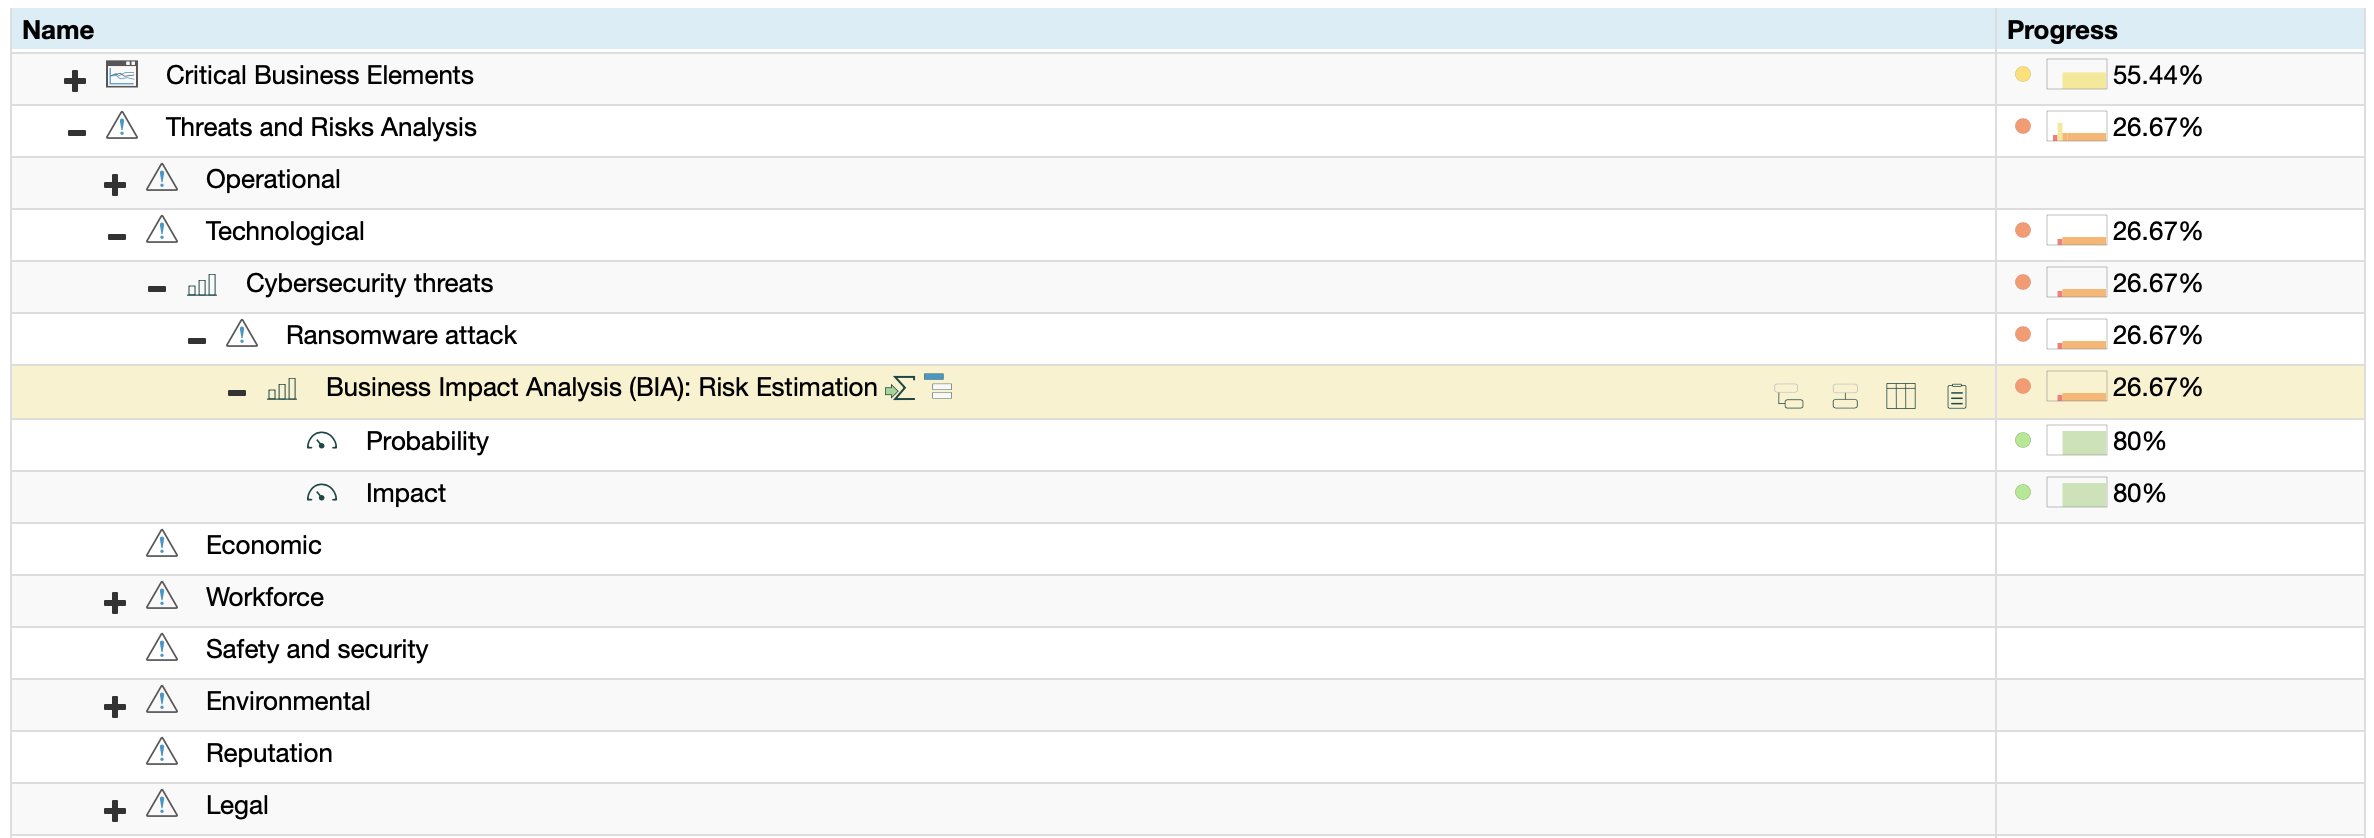
For instance, you can break down Technological threats into ‘Cybersecurity threats’ and further into a ‘Ransomware attack.’
The risk in this case can be quantified through a simple risk estimation formula, such as probability multiplied by impact. Various ways to define risks were discussed in a separate article.
Response Scenarios
Develop response scenarios for threats with the highest risk impact estimation scores.
A typical scenario will include:
- Business continuity plans (prevention, response, recovery)
- Communication plan
- Train and test plans
These plans can be quantified by:
![]() Regular update metric
Regular update metric
![]() Training coverage
Training coverage
![]() Simulations / Exercises success
Simulations / Exercises success
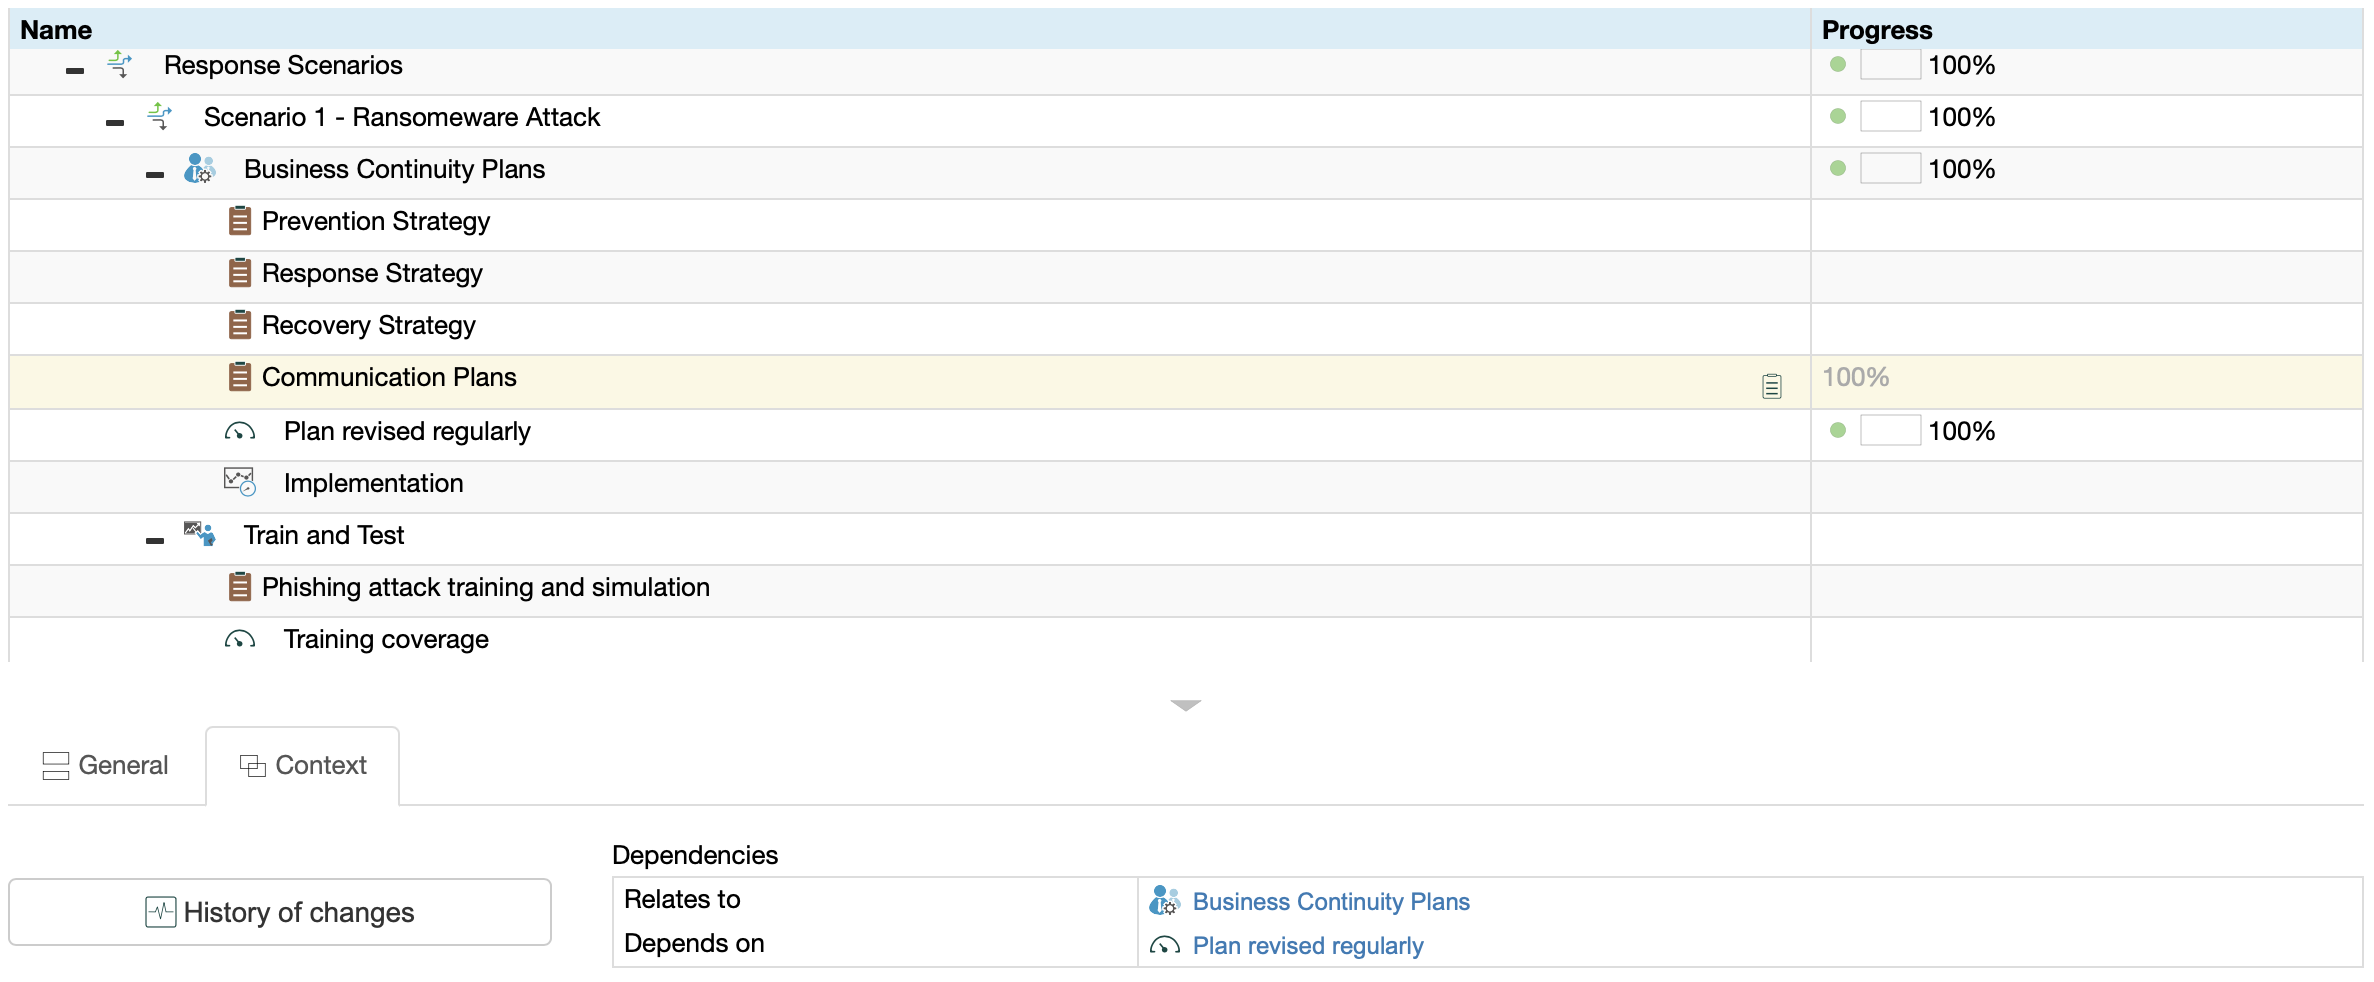
Consider ‘Scenario 1 – Ransomware Attack,’ which is broken down into:
- Business Continuity Plans
- Train and Test
The ‘Business Continuity Plans’ section includes several initiatives:
- Prevention Strategy
- Response Strategy
- Recovery Strategy
- Communication Plans
Within the ‘Communication Plans,’ the ‘Plan revised regularly’ metric quantifies the frequency of updates. The metric owner receives regular reminders to revise communication plans, ensuring that contact persons and their details remain up-to-date.
To validate the effectiveness of the ‘Response Strategy’ initiative, we quantify it with the ‘Simulations / Exercises’ indicator.
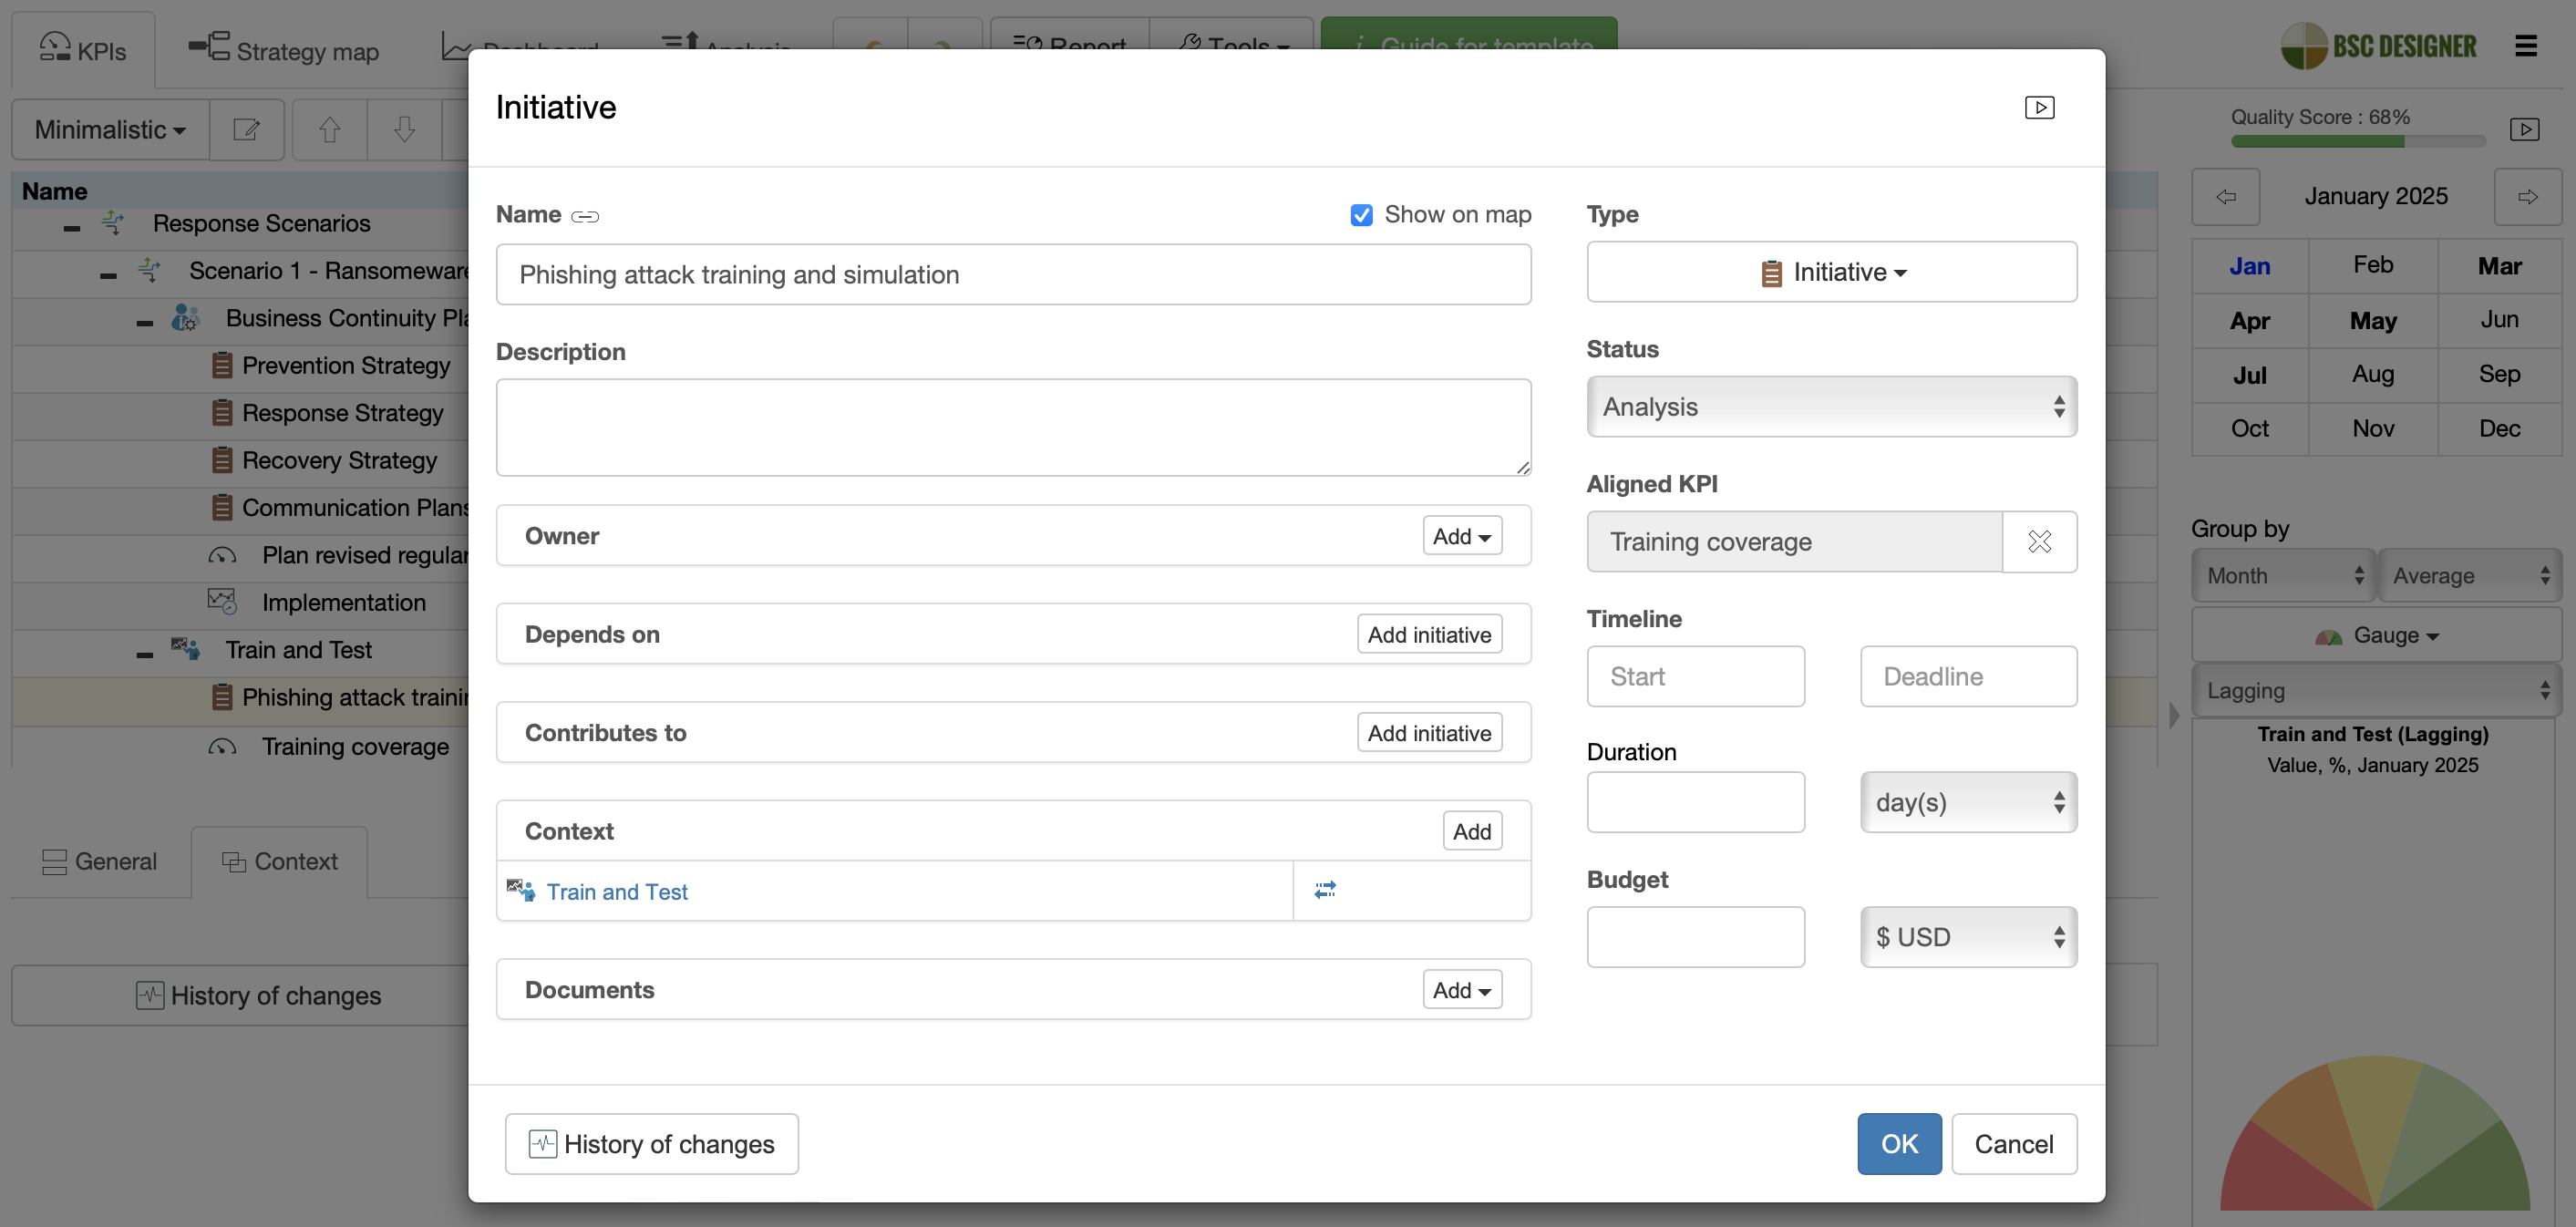
The ‘Train and Test’ section includes the ‘Phishing attack training and simulation’ initiative, along with two metrics:
- Training coverage
- Simulations / Exercises
While these continuity plans are presented as initiatives, further decomposition is possible. We can break them down into more specific sub-goals and metrics.
Mapping Incidents or Disruptions
To map active incidents, include disruption details and root cause analysis.
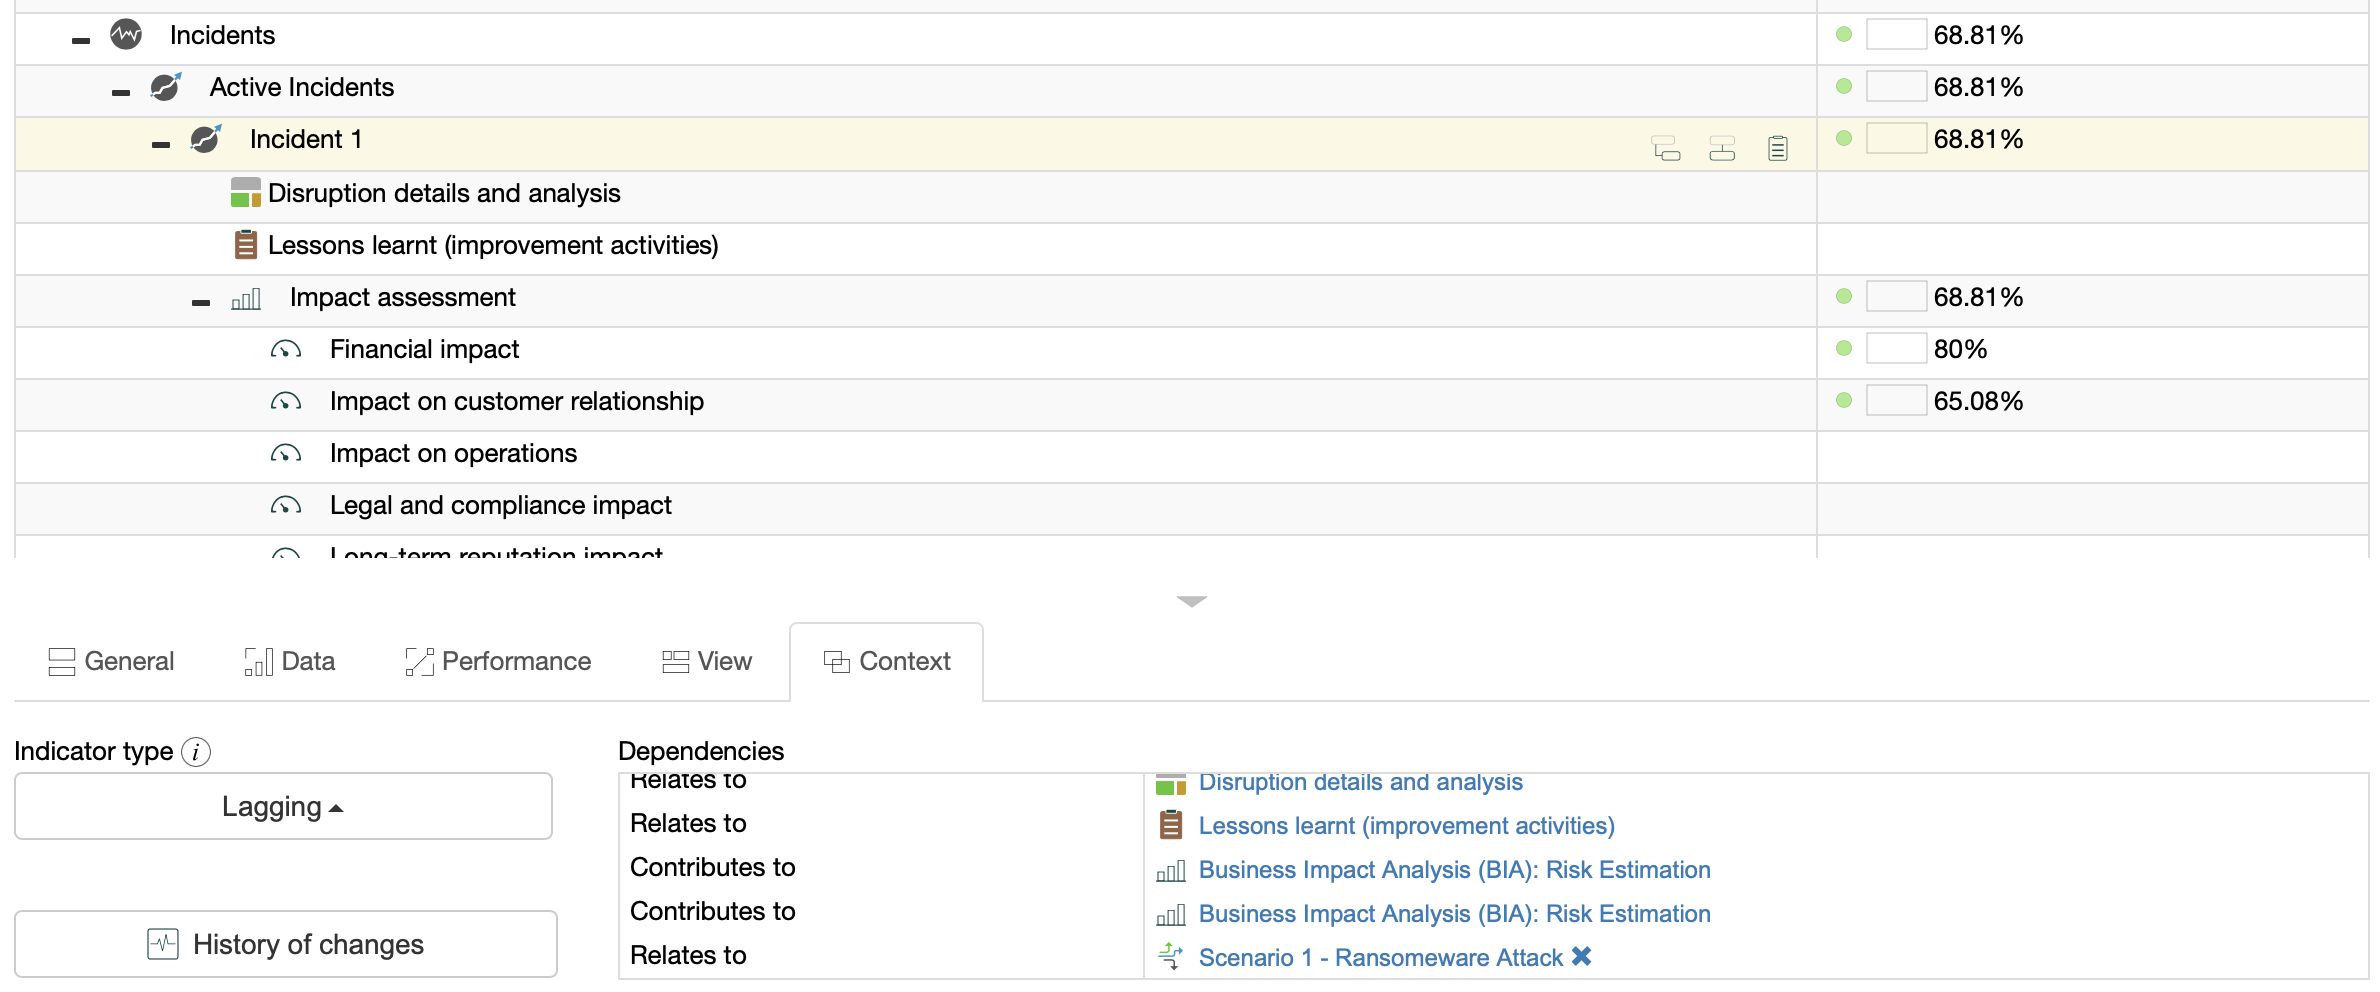
To quantify the impact, we can use the weighted impact assessment index consisting of:
![]() Financial impact
Financial impact
![]() Impact on customer relationships (quantified as a percentage of affected customers)
Impact on customer relationships (quantified as a percentage of affected customers)
![]() Impact on operations (quantified as a percentage of critical operations affected)
Impact on operations (quantified as a percentage of critical operations affected)
![]() Legal and compliance impact (quantified by fines and other legal consequences)
Legal and compliance impact (quantified by fines and other legal consequences)
![]() Long-term reputation impact (quantified as a percentage of customers lost over a 1-year period attributed to the crisis)
Long-term reputation impact (quantified as a percentage of customers lost over a 1-year period attributed to the crisis)
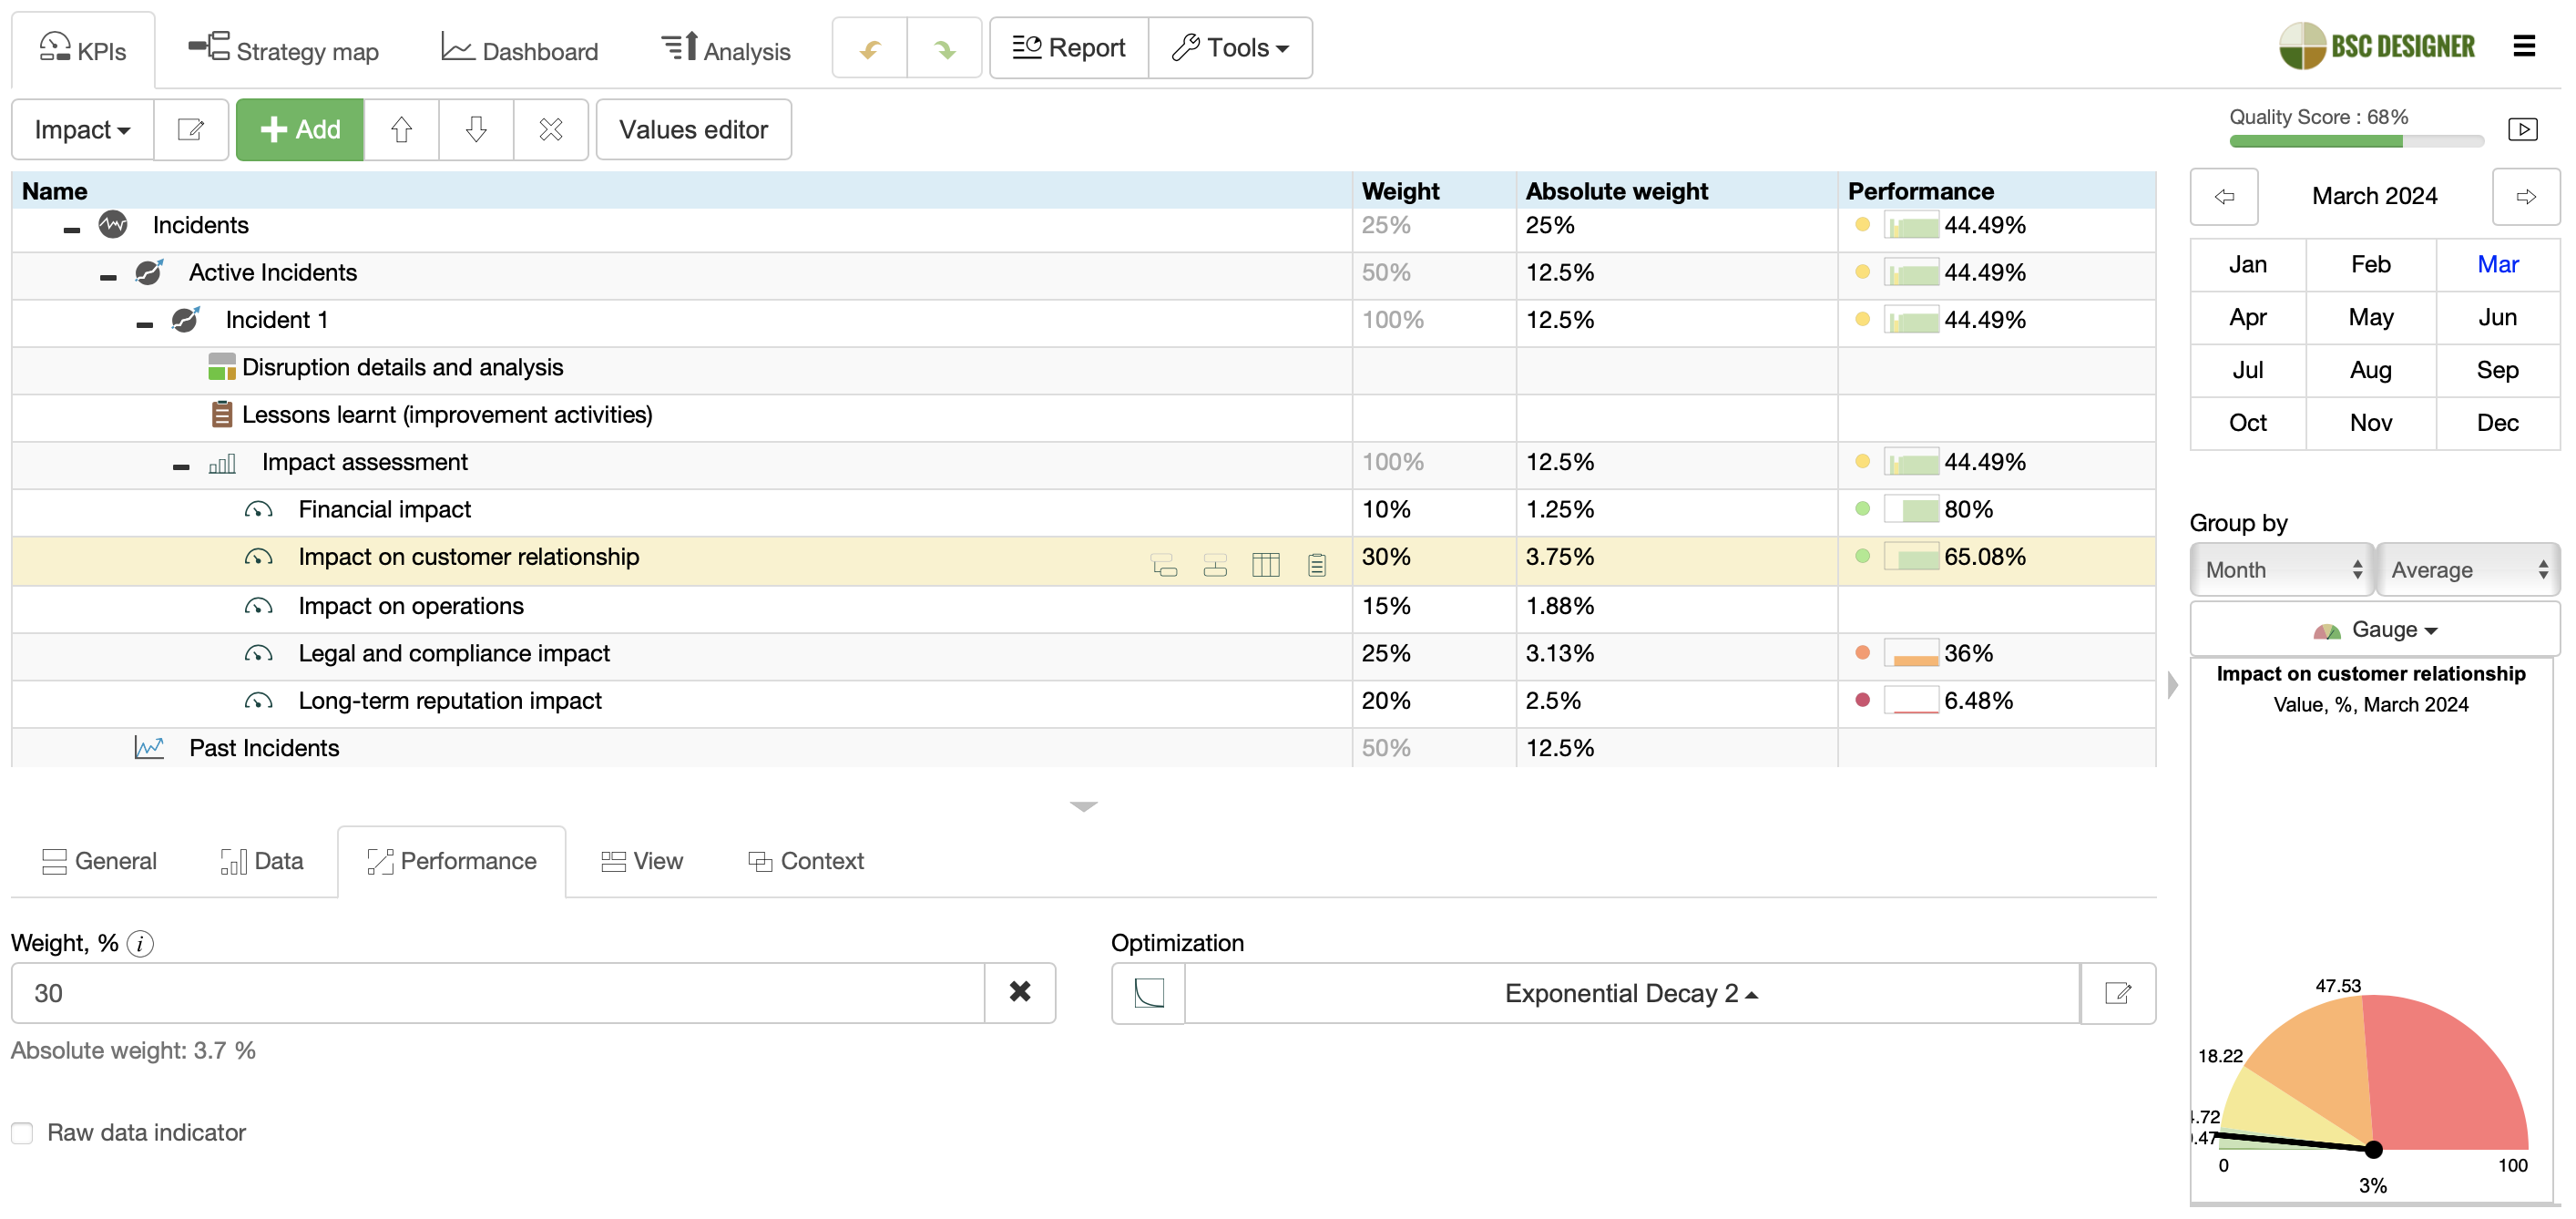
After resolving an incident:
- Update the finishing date in the ‘Disruption details and analysis’ element
- Change its status to ‘Completed’
- Map lessons learned and improvement initiatives
- Move the ‘Incident 1’ group to the ‘Past Incidents’ section.
Inheritance and Update Intervals for Indicators
Depending on the nature of quantification, indicators in the business continuity scorecard need to be configured in various ways.
Metrics Reusing Previous Values (Inherited)
Indicators quantifying the RTO (Recovery Time Objective) are set to use inherited values. In practice, this means that the RTO defined for the current year will automatically be applied for the next year unless redefined. The update interval for these indicators is set to annual or semiannual updates.
Indicators used for quantifying BIA (Business Impact Analysis) are also configured to use inherited values. The update intervals in this case can be adjusted according to the expected dynamic of the threat, using monthly for more dynamic threats and quarterly/annual intervals for stable threats.
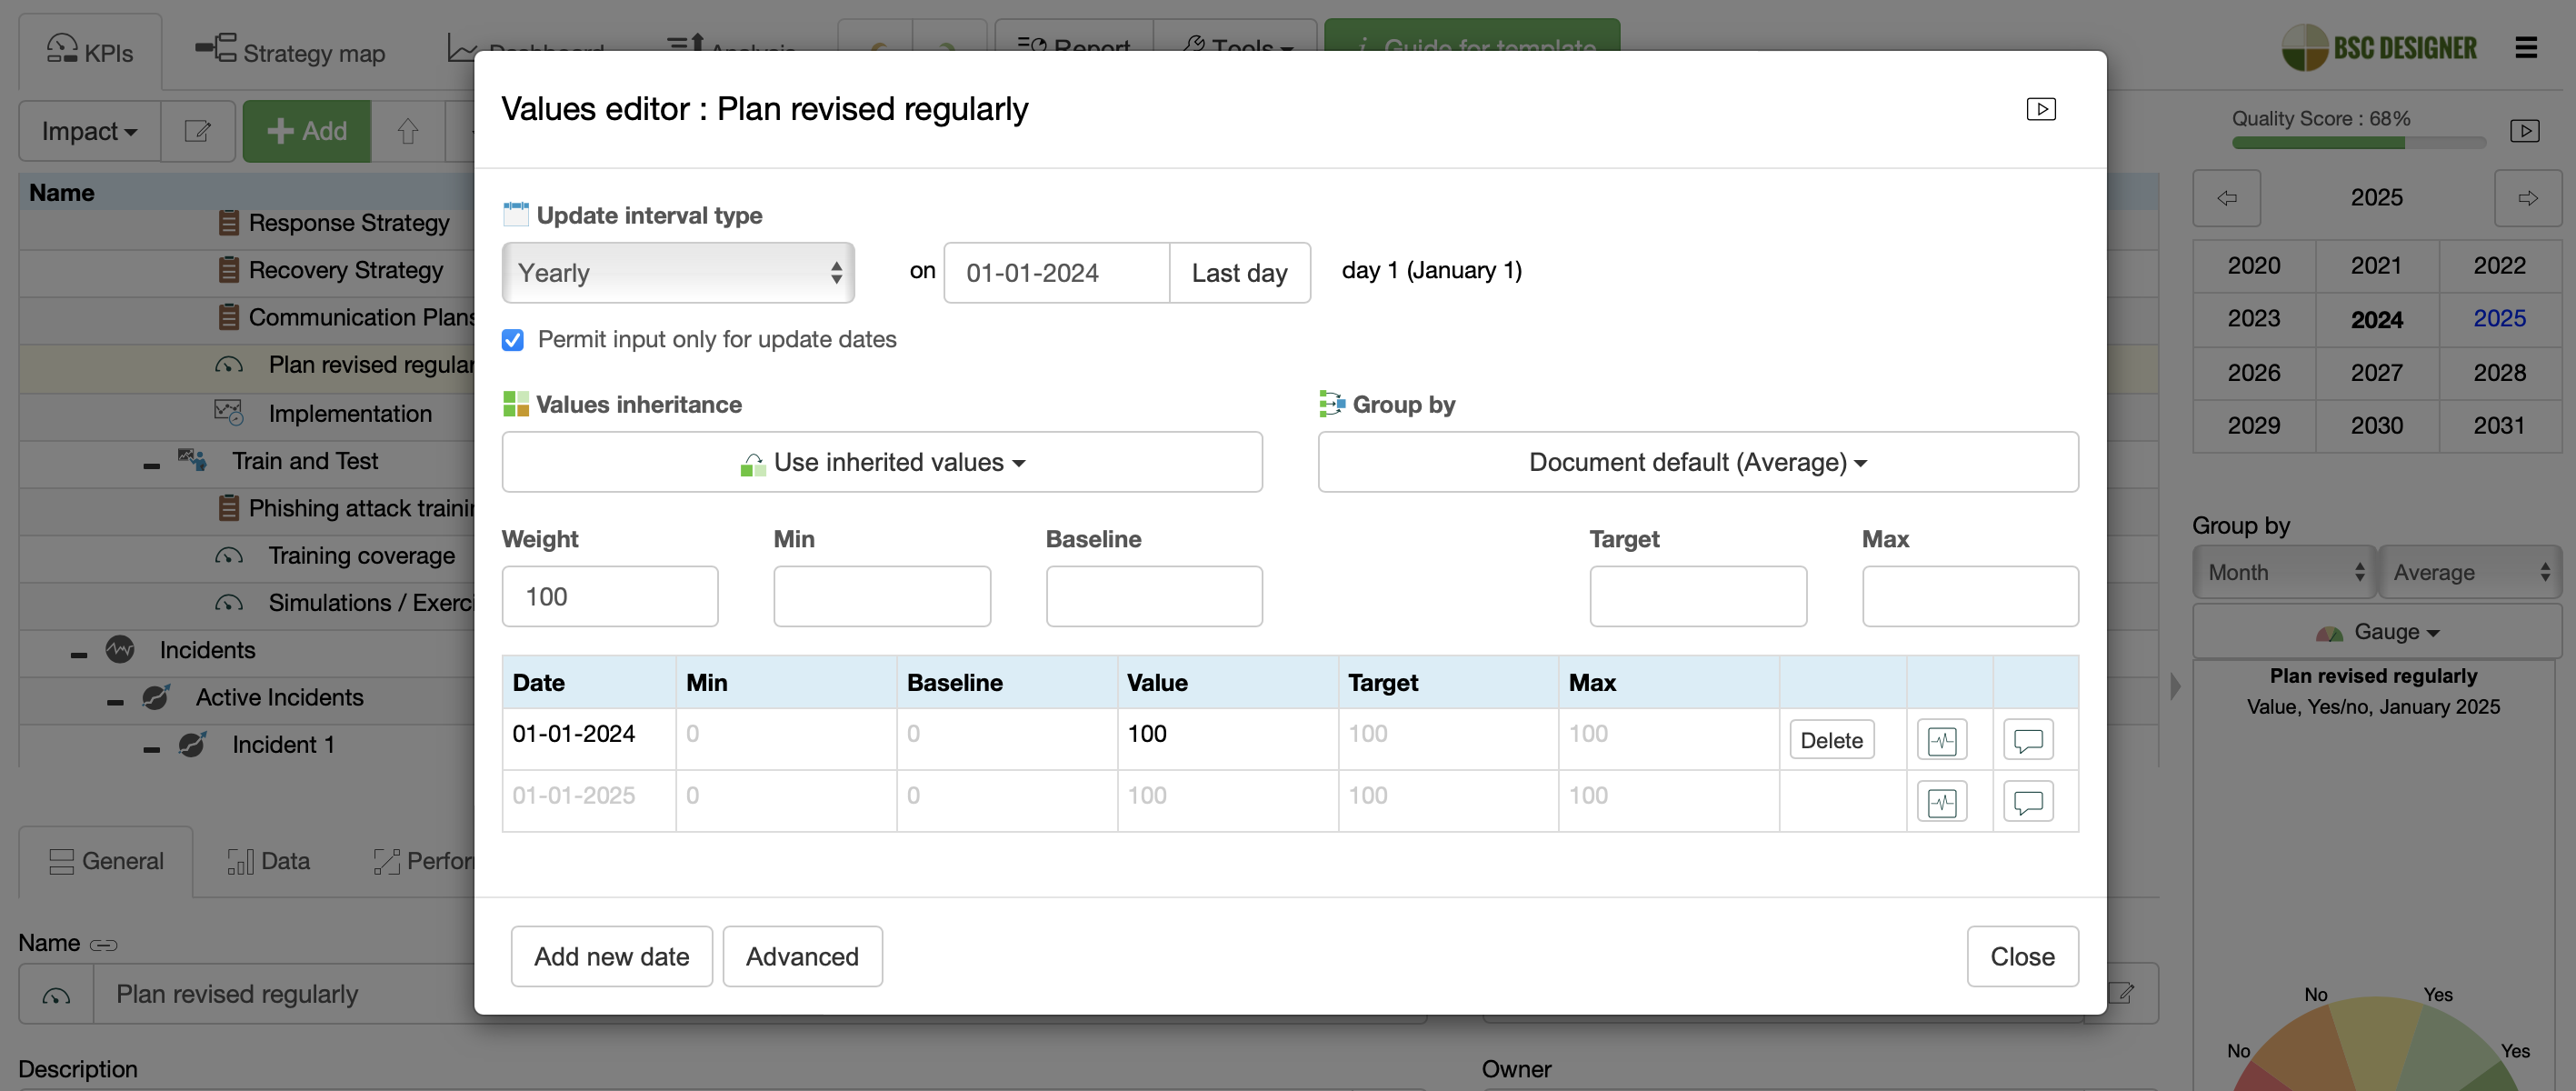
Metrics Not Reusing Previous Values (Entered Values)
Metrics used to quantify business continuity plans, such as ‘plans revised regularly,’ ‘training coverage,’ and ‘simulation exercises,’ are configured for quarterly or annual update intervals. The inheritance option in this case is configured as ‘Use entered values,‘ meaning that we do not reuse the previous value for the next period.
For instance, if plans are marked as revised for the current year, for the next year, we would need to revise plans again and update the state of the corresponding metric.
Metrics with No Scheduled Update
Finally, the update interval of metrics used for impact assessment of incidents is configured as ‘Never,’ indicating that we are interested in capturing only the current state of the indicator with no intention to monitor its evolution over time.
Linking by Context and Data
The fundamental concept of business continuity management involves establishing connections among:
- Critical business elements
- Threats and risks
- Scenarios
- Actual incidents
By creating these connections, we equip our team with all the necessary details to effectively respond to threats and learn from incidents.
To implement this concept in strategic planning, we link all the mentioned elements by context. This way, we can navigate from actual incidents to the corresponding scenarios and, if necessary, explore threats and risk analysis.
To establish context in BSC Designer:
- Copy the source item (e.g., relevant scenario) to the clipboard.
- Select the destination item (e.g., incident covered by the scenario).
- Paste from the clipboard and choose between ‘Link by Context’ or ‘Link by Data.’
Contextual connections will be available on the ‘Context’ tab for both items.
To navigate between items, double-click on the relevant connection.
Applying the same logic, response strategies with dedicated strategy scorecards can be aligned with incidents, risk assessments, and critical business elements.
What's next?- Follow our
 Strategy Implementation System to align stakeholders, strategic ambitions, and business frameworks into a comprehensive strategy.
 - Automate strategic planning with BSC Designer by organizing goals, initiatives, risks, and KPIs into scorecards.
More About Strategic Planning


![]() CEO | Author | Speaker
CEO | Author | Speaker
BSC Designer is strategy execution software that enhances strategy formulation and execution through tangible KPIs. Our proprietary strategy implementation system reflects our practical experience in the strategy domain.