There are a number of business frameworks that can be applied during the strategic planning process. Let’s analyse the differences between them, their advantages and application areas.
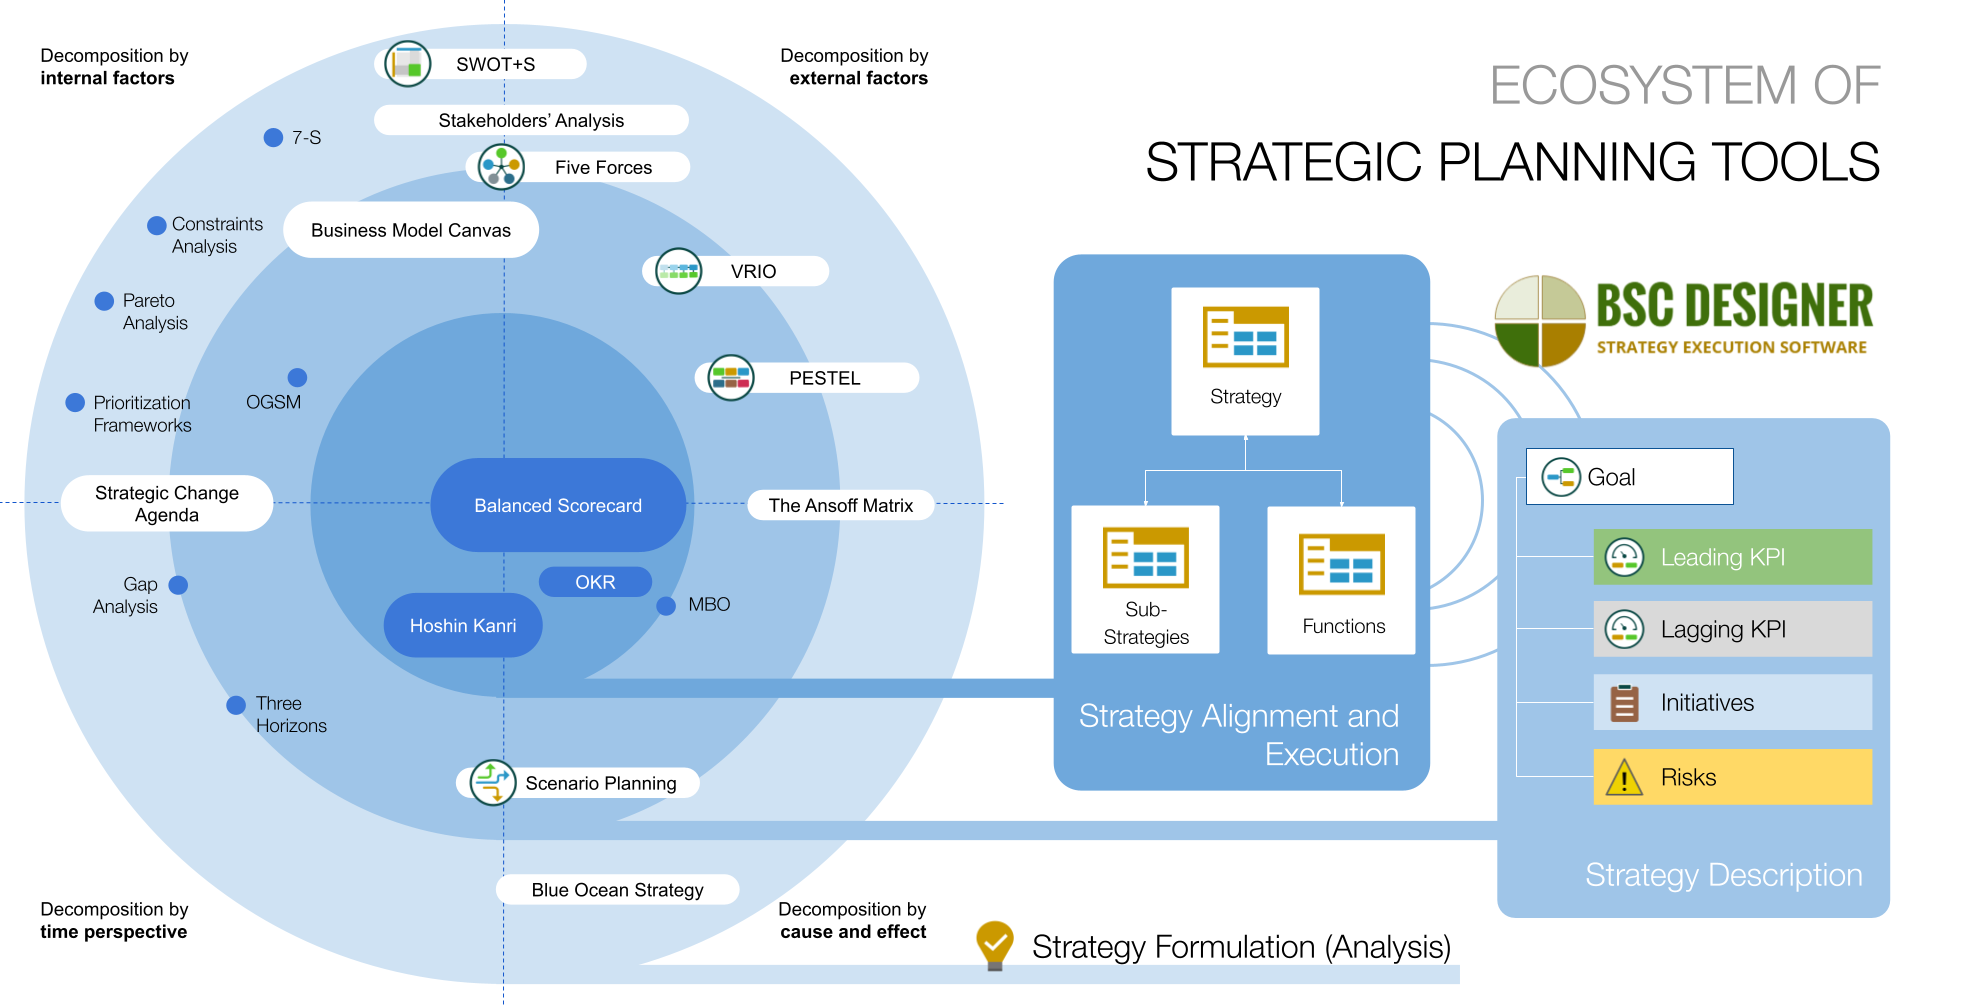
Key topics of the article:
- Understanding Strategic Planning
- First Principles Thinking about Business Frameworks
- Strategy Execution Frameworks
- Strategy Formulation and Description Frameworks
- Strategy Planning Software
Strategy Execution and Description Frameworks (cause-and-effect decomposition):
Strategy Execution and Description Frameworks (decomposition by time perspective):
- Porter’s Five Forces
- VRIO and Blue Ocean Strategy in the cause-and-effect segment
- PESTEL
Strategy Formulation and Description Frameworks (mostly internal factors):
Strategy Formulation Frameworks (mostly internal factors):
Understanding Strategic Planning
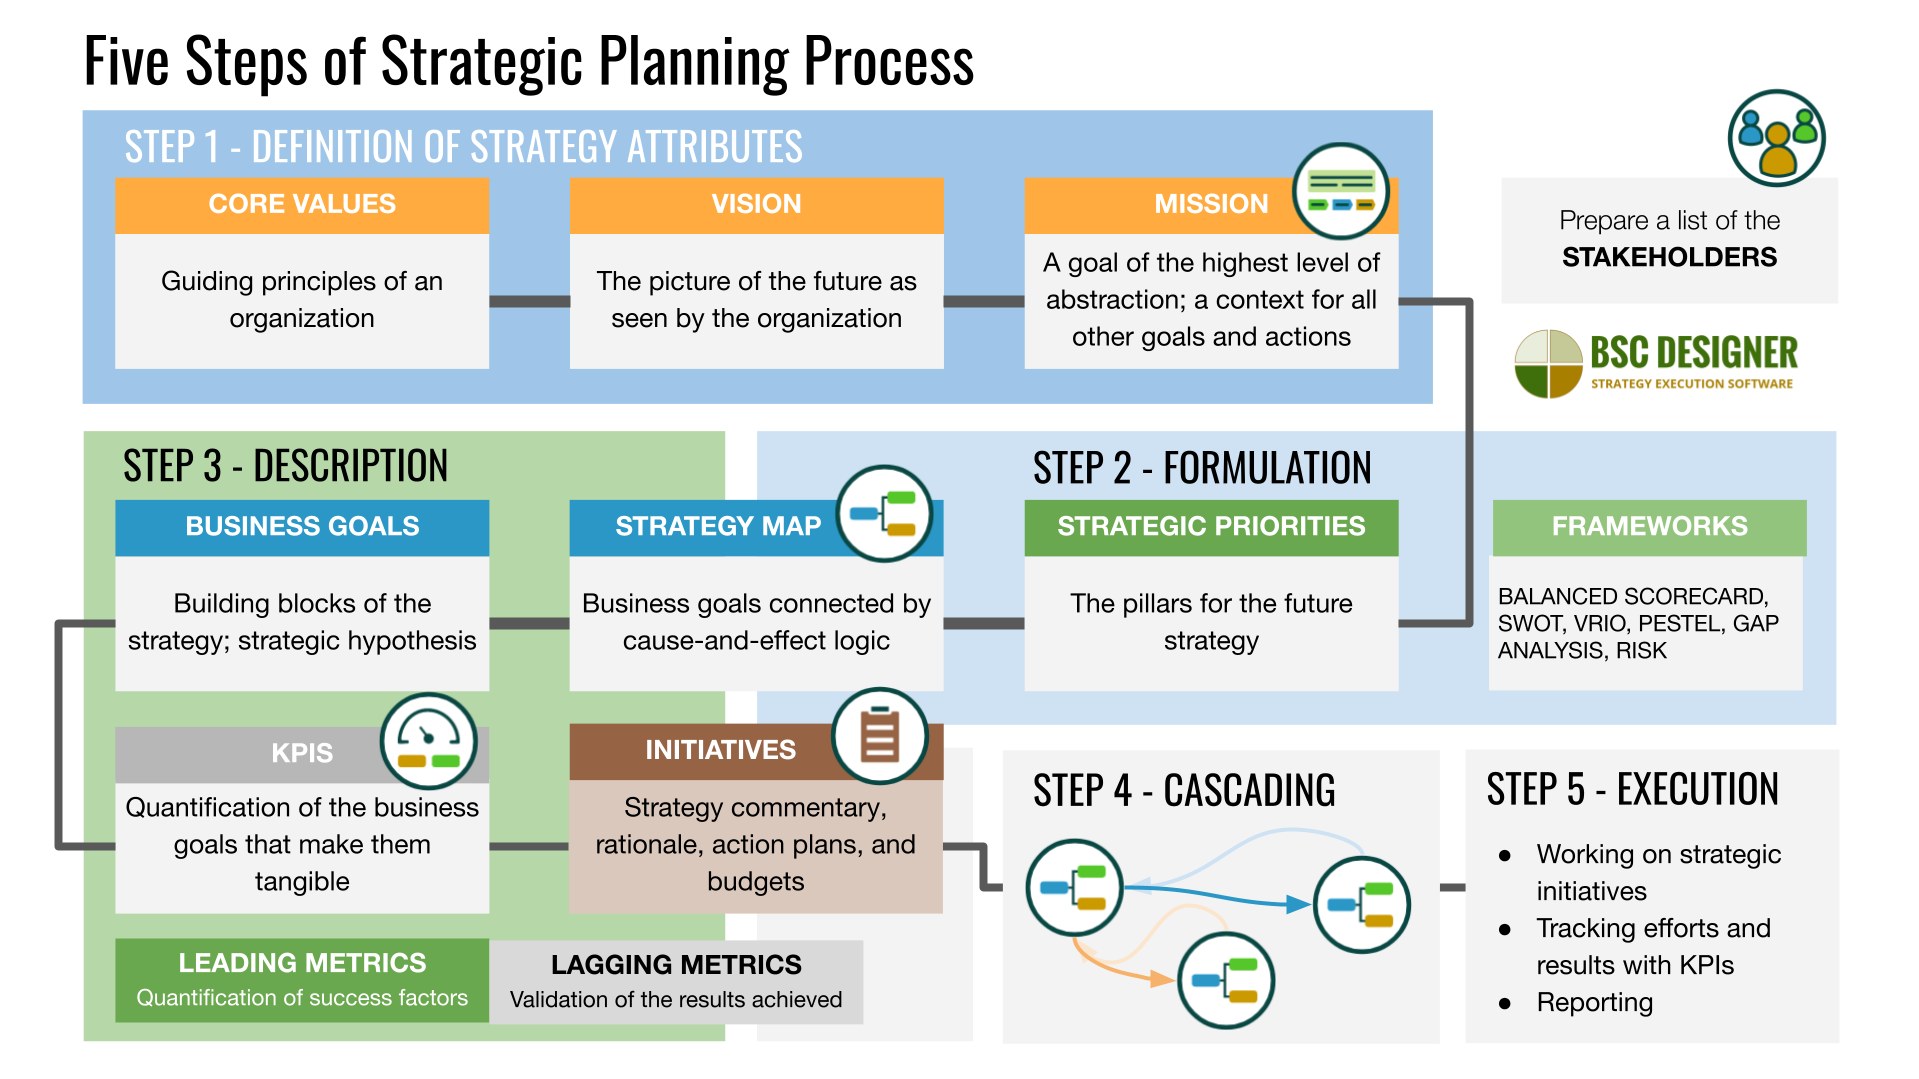
Each business framework has its own application area. In the previous article we discussed the typical steps of strategic planning, we are going to get back to these steps often, so let’s list them once again:
- Step 1. Define top-level goals. In this step, an organization defines its mission, vision, core values, strategic priorities.
- Step 2. Formulating business hypothesis. Following the ideas formulated in step 1, we can now focus on more specific goals that would help us to achieve the vision.
- Step 3. Strategy description. Any strategy is better when it is written down in some form. In this step, we use strategy maps and similar techniques to articulate strategy.
- Step 4. Strategy cascading. Having a single top-level strategy is not enough. We need to find ways to explain it to all business units, teams, and individuals.
- Step 5. Strategy execution. In this step, our focus is on action plans and performance indicators. We also learn during execution and will use those insights in step 2.

First Principles Thinking about Business Frameworks
In the previous article, we introduced an idea of value-based strategy decomposition that helps convert high-level ambitions of the stakeholders into quantified goals and action plans.
As explained in the Practical Implementation Guide, decomposition is not something algorithmic; there is no specific criteria of effective decomposition. For this reason, any business framework suggests its own tailor-made approach to decomposition of strategic ambitions of stakeholders.
For example:
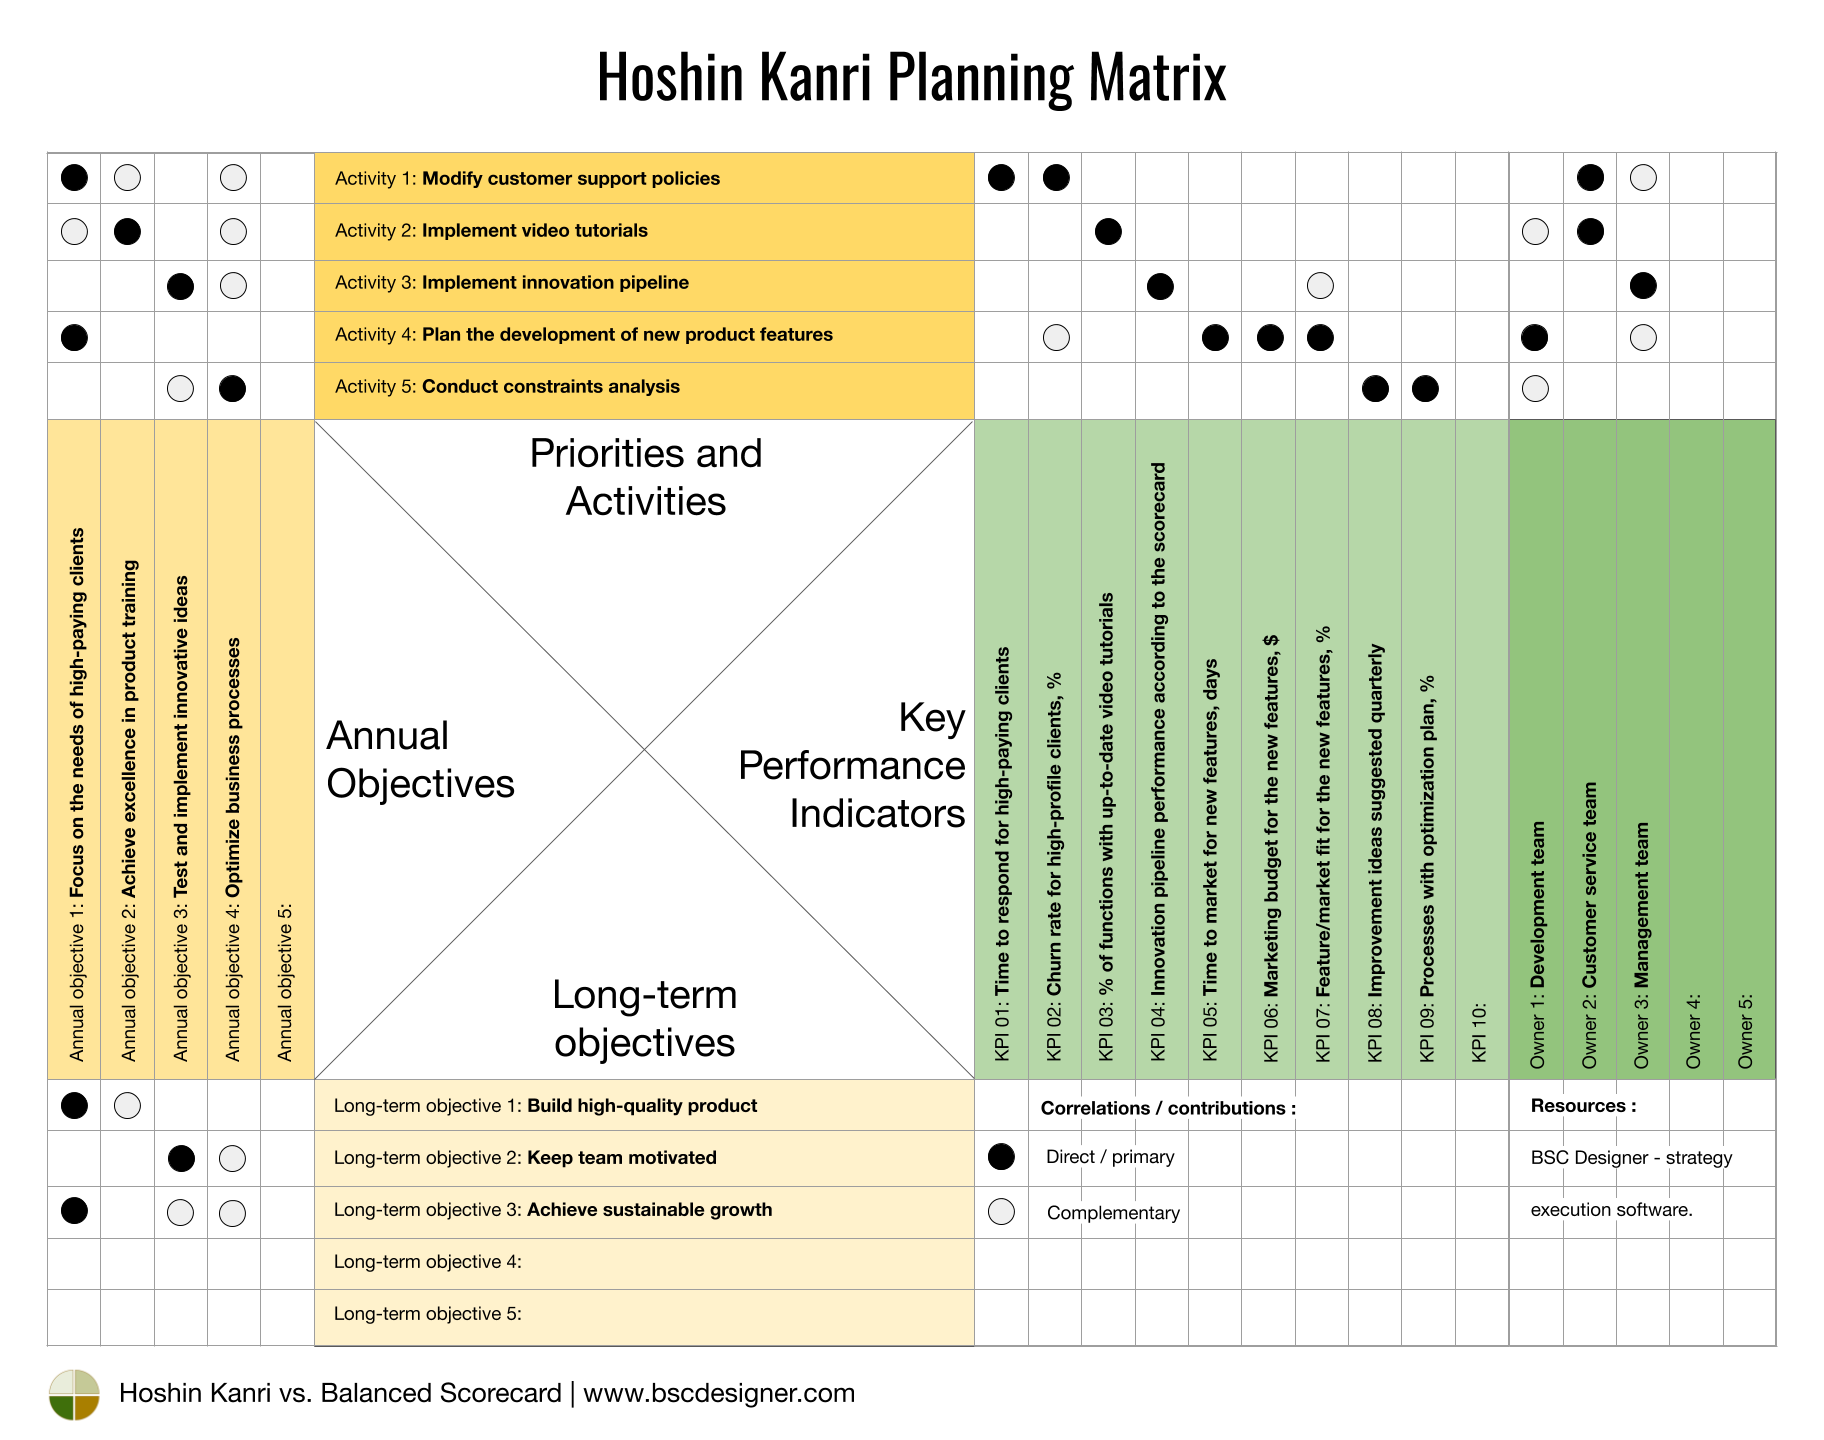
- The decomposition suggested by Hoshin-Kanri is based on the time scale: Learn-term objectives, Annual objectives, Short-term objectives (priorities and activities).
- The decomposition of the Balanced Scorecard is based on drivers of the strategy (Internal Perspective and Learning & Growth perspective) and the expected outcomes (Stakeholders and Customer perspective).
- The decomposition principles of the OKR framework are less specific as key idea is to find “inspirational” goals.
- The frameworks like PESTEL and 7-S give specific categories for the decomposition.
Beside the decomposition, the practical implementation of most of the framework is based on the triangle Goal-KPI-Initiative, where:
- Goal is a representation of certain part of interests of the stakeholders
- Initiative is an action plan, and
- KPI is a quantification for the goal and initiative
Another way to think about the frameworks is focusing on their application area according to strategic planning process:
- Strategy formulation frameworks. SWOT, Three Horizons, Constraints Analysis, PESTEL, etc. that help organizations to generate new ideas (step 2 of the strategic planning process).
- Strategy description frameworks. Most of strategy formulation frameworks also help to describe new ideas on certain diagrams (step 3 of strategic planning).
- Strategy execution frameworks. Such as the Balanced Scorecard for the overall strategy and the more lightweight OKR framework for specific challenges.
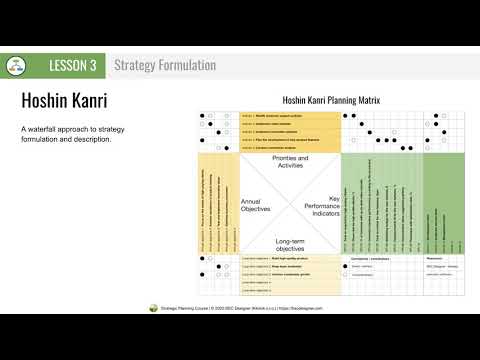
The lesson 3 of the free strategic planning course is focused on using different business frameworks for strategy definition. Here is a full video of the lesson:
Strategy Execution Frameworks
Strategy execution frameworks address a wide range of strategy-related challenges, from strategy formulation and description to strategy cascading and execution.
Balanced Scorecard Framework
This is one of the most used business tools in general, specifically for strategic planning. The concept evolved from a measurement system (“balancing” indicators across the perspectives) to the recognized strategy execution framework.
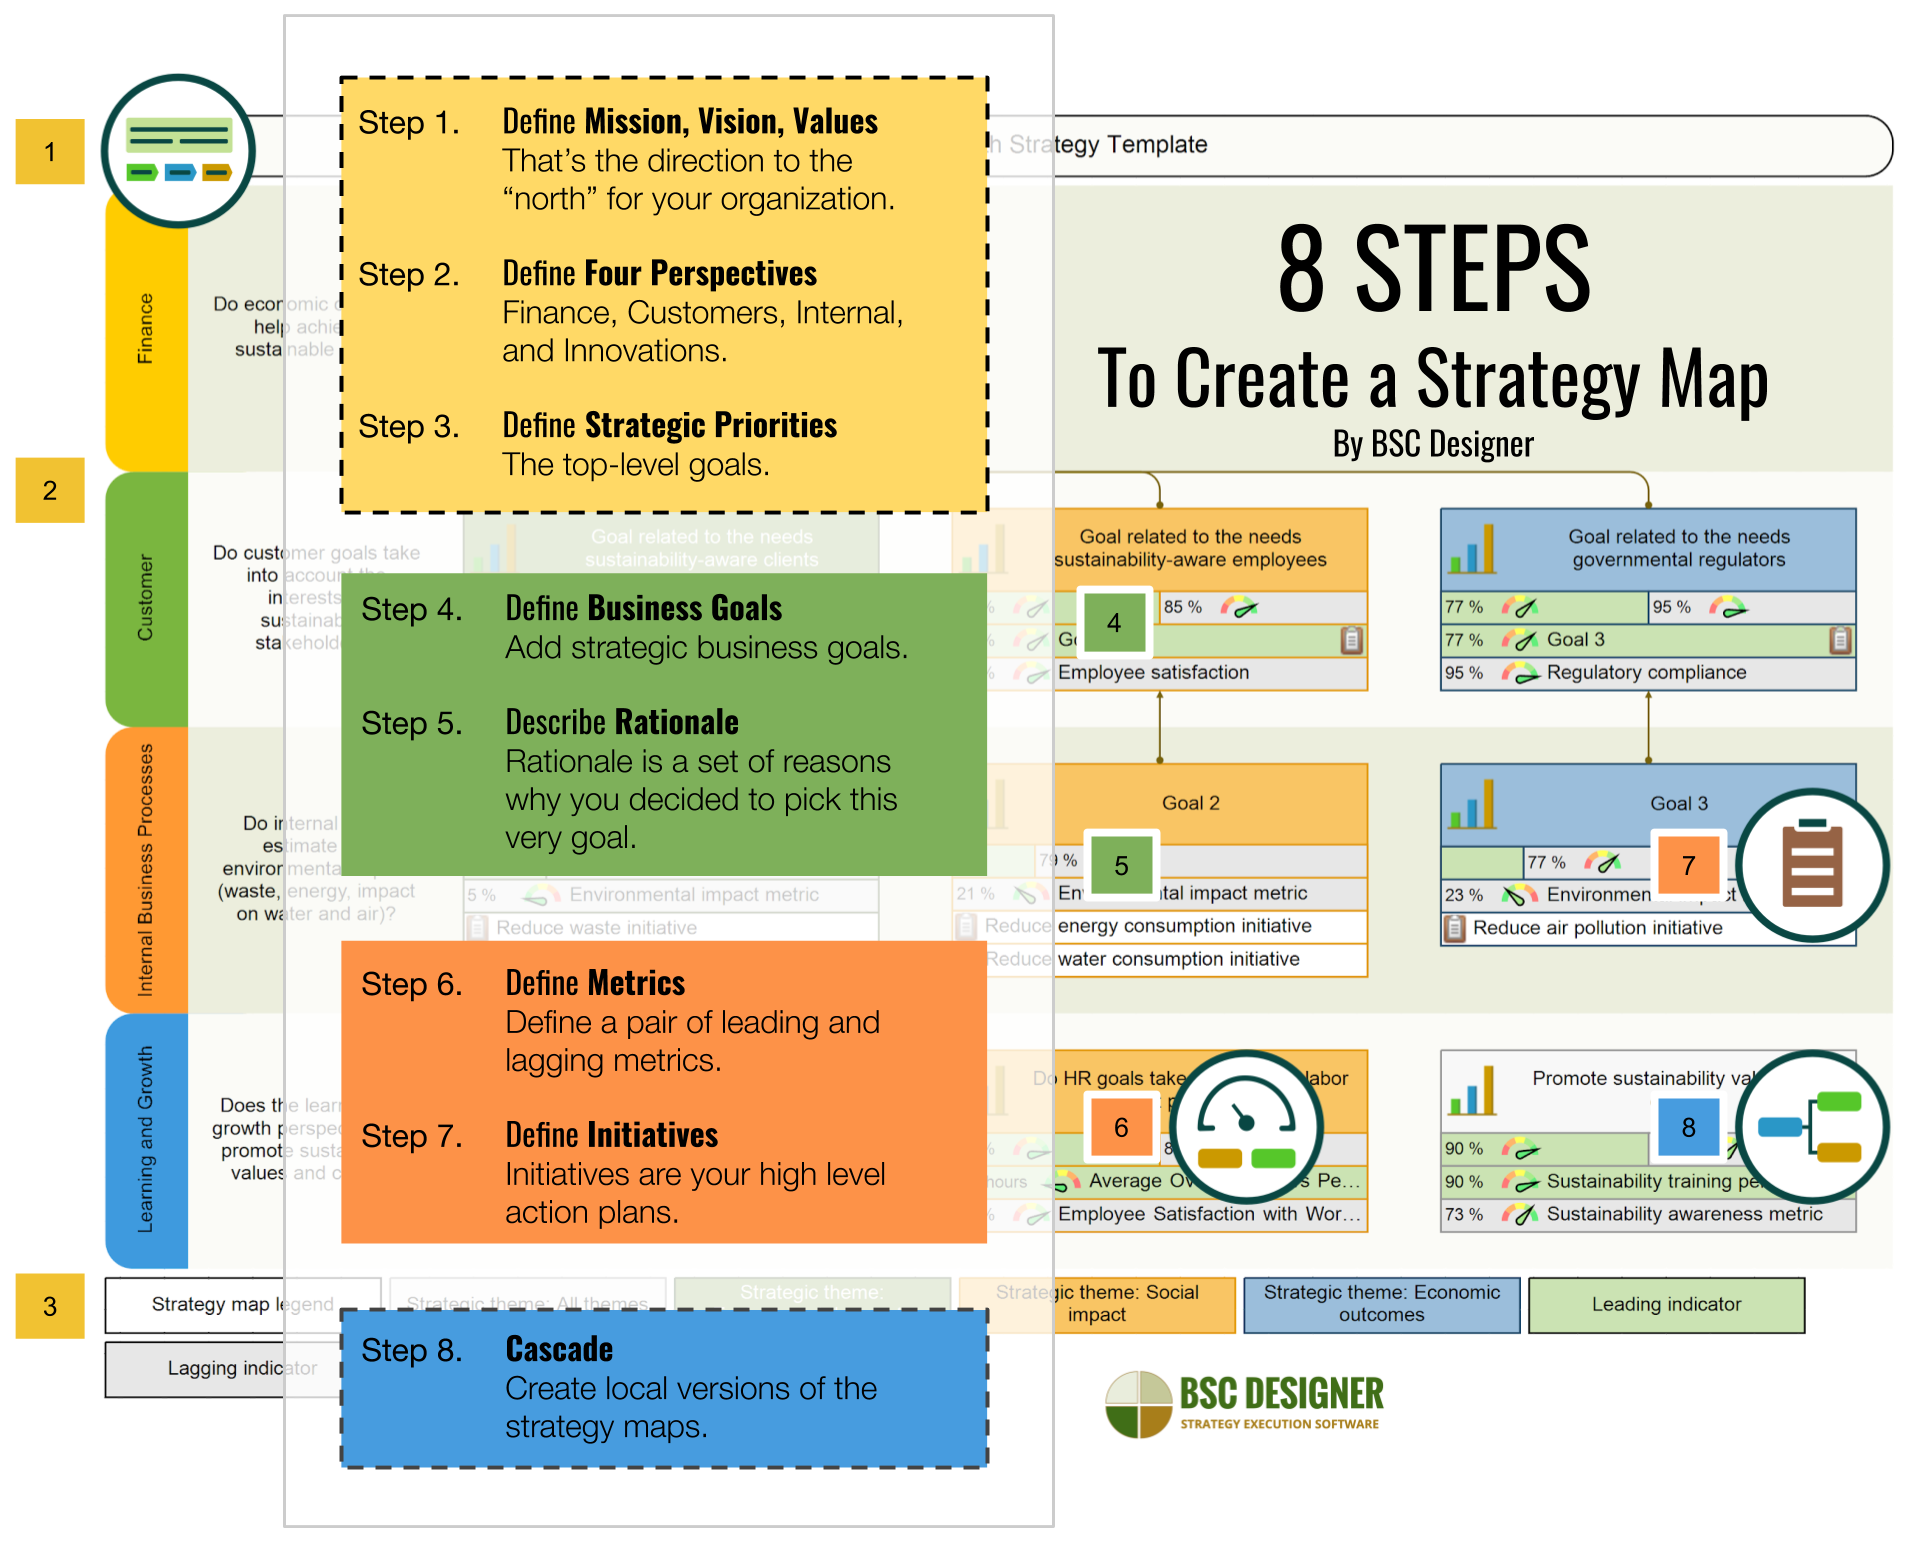
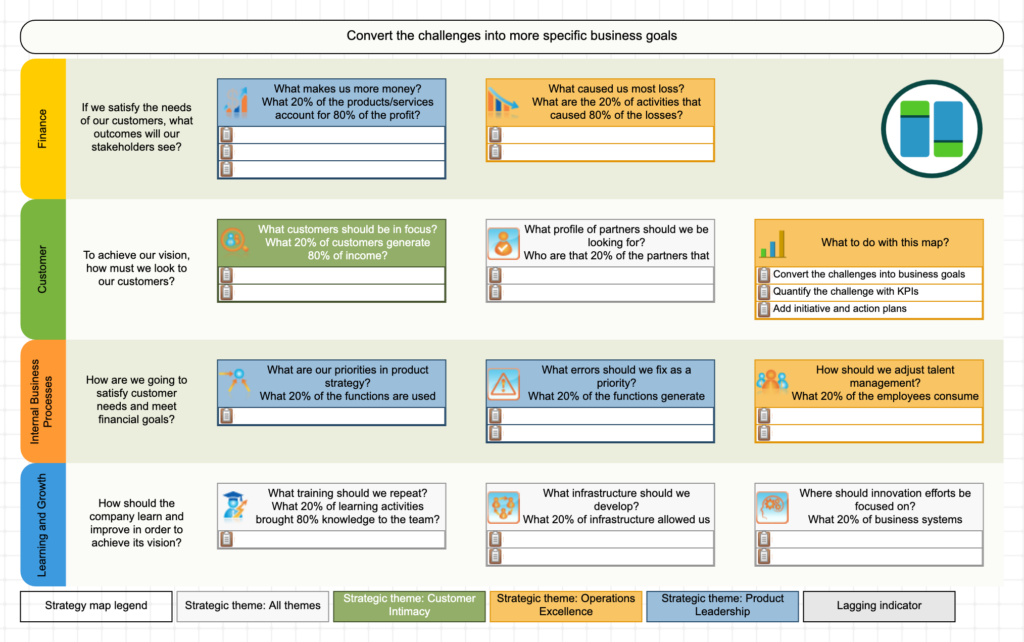
- The main part of a properly designed Balanced Scorecard is a strategy map
- A strategy map includes strategic themes and four categories (perspectives)
- Goals on the strategy map are connected by cause and effect logic
- Leading and lagging performance indicators are aligned with the goals
- Action plans or initiatives explain how exactly the goal will be executed
- The strategy is cascaded (aligned) across the organization
Like any business tool, in the wrong hands, it might not work as expected. Before starting the Balanced Scorecard project, it makes sense to understand its advantages and possible drawbacks.

OKR Framework
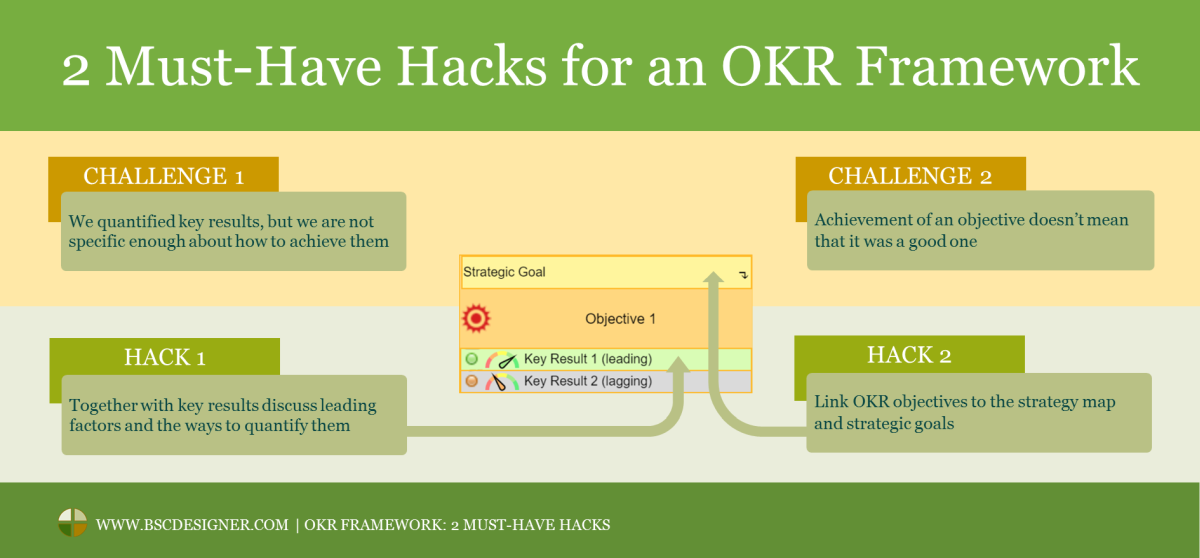
Starting as a lightweight goal setting framework, it was adopted by many tech companies. OKR is now getting the fame of agile strategy execution tool.
- OKR framework suggests focusing on a few important goals (“Objectives”) and tracking their execution with several lagging indicators (“Key Results”)
- The OKR process consists of four steps that end with a results review
- The recommended process cycle time is one quarter
The comparison of BSC and OKR frameworks indicates that the frameworks solve similar business challenges on different levels. BSC is more suitable for overall strategic planning, while OKR works better on the lower levels and during the execution stage.

Hoshin Kanri
Hoshin Kanri framework is similar to OKR and BSC:
- The framework focuses on continuous improvement (Plan-Do-Check-Act cycle)
- Underlines the importance of strategy alignment and discussion (Catchball)
- Suggests tracking an individual’s performance
The Hoshin Kanri Matrix provides an alternative tool for strategy description by giving a one-page overview of the top-level strategic priorities and their connection to the specific improvement goals and targets.
In the case of Hoshin Kanri, strategic planning and cascading come under the term “strategy deployment.” The strategy deployment process is similar to the classical steps of strategy planning.
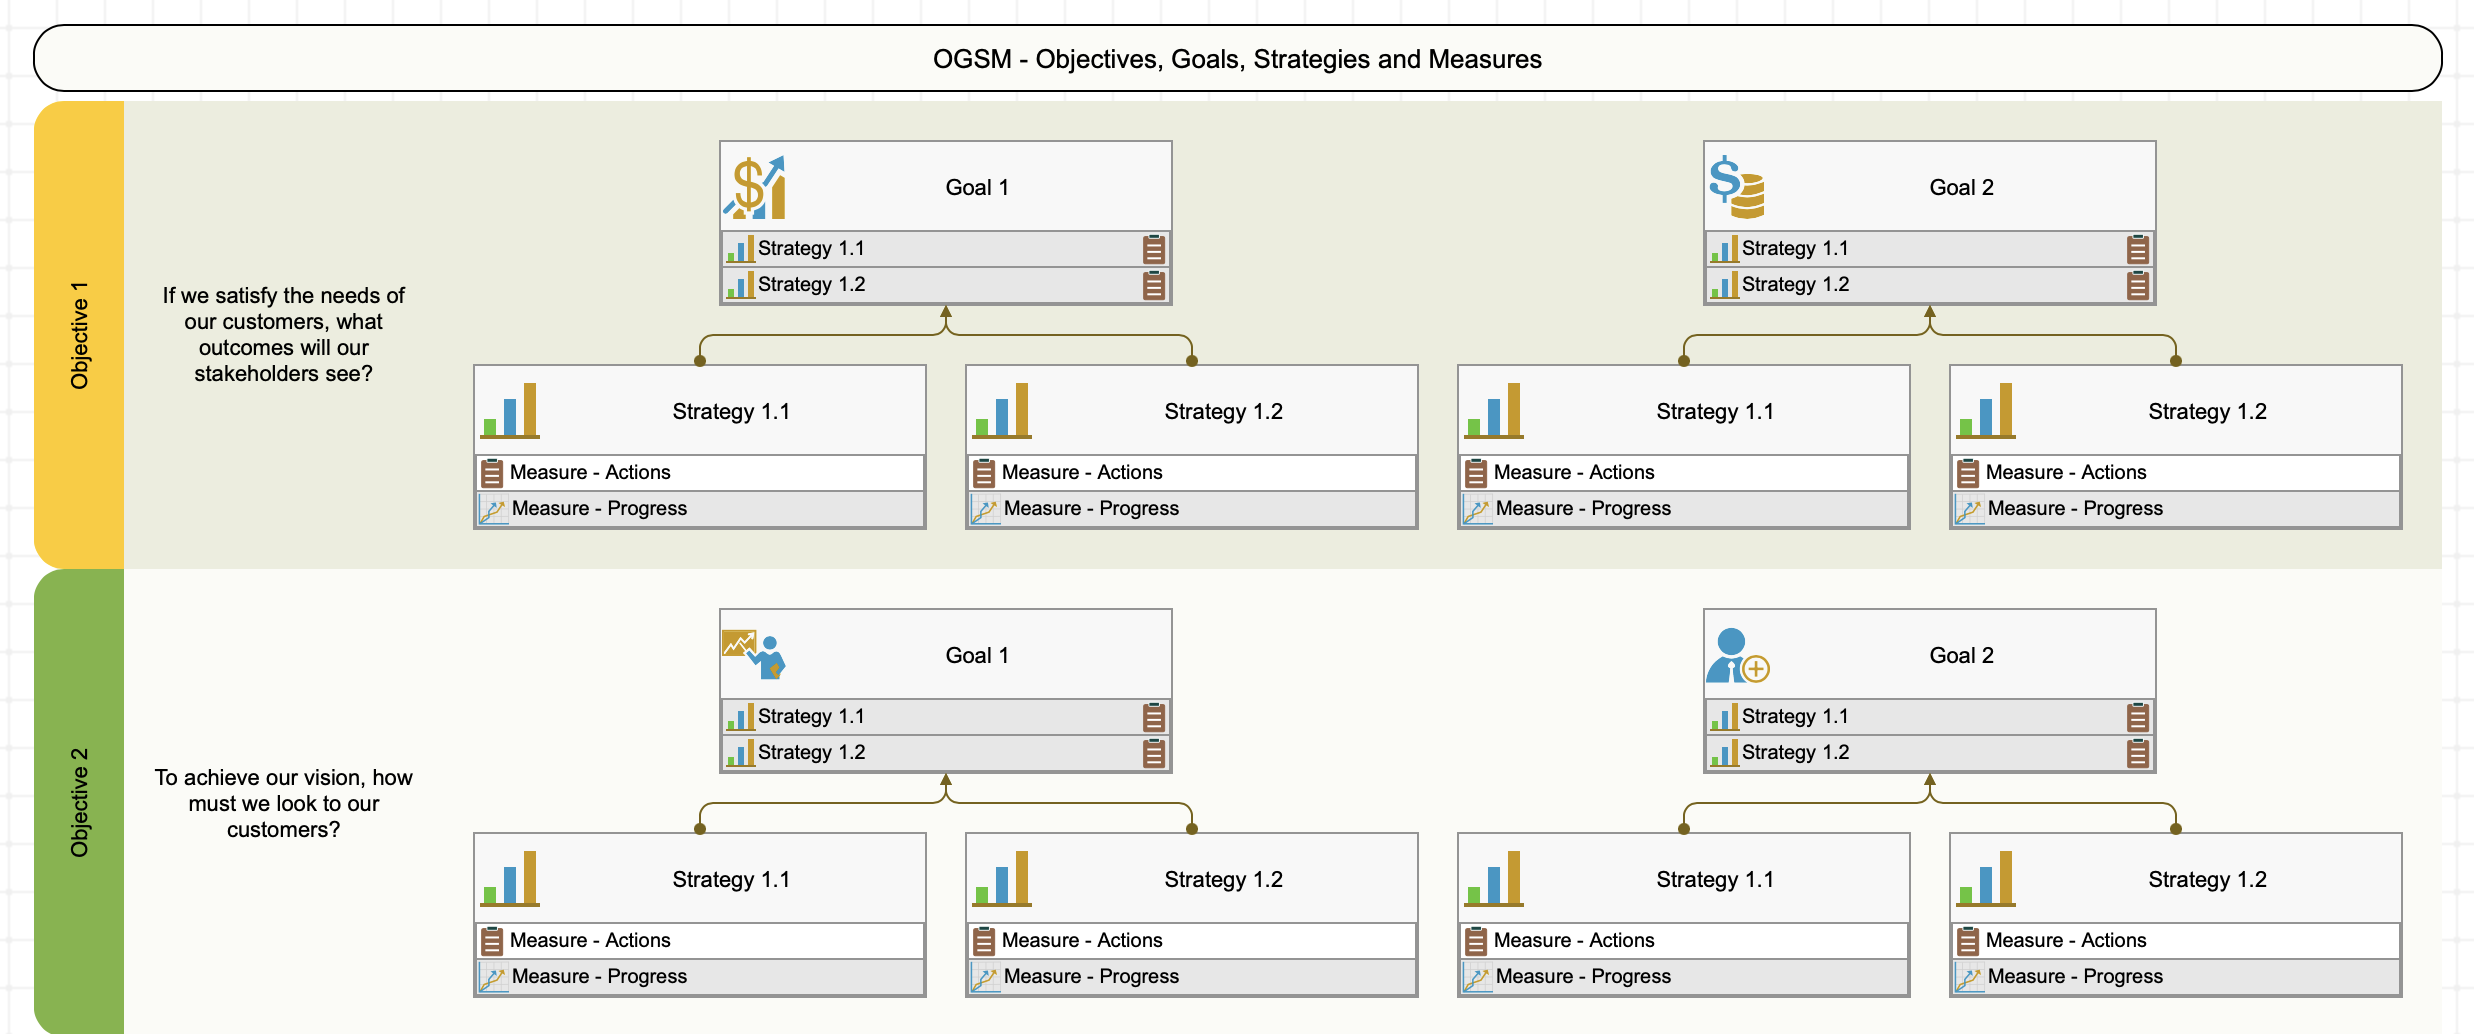
OGSM Model – Objectives, Goals, Strategies, Measures
The OGSM model looks very similar to the Hoshin Kanri framework. Both models appeared in Japan in the 1950s; both models suggest looking at strategy from the four different levels of abstraction. Similar to Hoshin Kanri, OGSM is a one-page document, but there is no X-matrix.
Here is a comparison table of the models’ vocabulary:
| OGSM | Hoshin Kanri |
|---|---|
| Objectives | Long-term objectives |
| Goals | Annual objectives |
| Strategies | Priorities and activities |
| Measures | Measures/KPIs |
While the OGSM model is simple, there are certain problems that each organization solves in its own way:
- Goals vs. Objectives. Even in the same organization, there is no clear agreement about the difference between goals and objectives. Time horizon is no longer a reliable differentiator. Are the objectives strategic in their nature and goals operational?
- Strategies. The term might be confusing. As we discussed before, there are at least 10 different schools of strategy. Most agree that strategy is a hypothesis, and it should give a clear context for future actions. In the paradigm of OGSM, the strategies look more like simple action plans.
- Measures. There is no agreement about what should be quantified by the measures – the strategies, the goals, or the objectives. Or should we have the measures on all these levels?
- Leading vs. Lagging Measures. Similar to Hoshin Kanri, OGSM doesn’t make any specific difference between leading measures and lagging measures. We can only imagine that most of the strategies will be quantified by the leading measures, while goals and objectives will be validated by the lagging metrics.

MBO
The MBO framework was one of the first strategy execution frameworks that suggested an effective way to cascade objectives from the top level to the level of individuals.It shares a lot of ideas with BSC and OKR frameworks. MBO established certain requirements for the objectives:
- They should be ordered according to their importance
- They have to be quantitative
- They have to be realistic
- They have to be in line with organizational policies
- They have to be compatible with each other
The framework is not as sophisticated on the strategy description step as BSC or Hoshin Kanri, but on the level of strategy execution, its simple approach adds value.
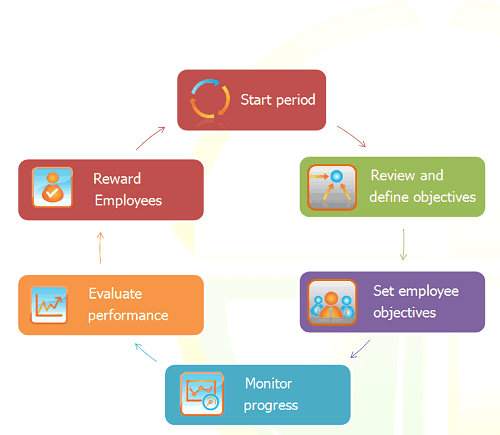

Strategy Formulation and Description Frameworks
As the comparative table shows, many popular business frameworks are excellent tools for formulating business strategy. Those frameworks help to have a different perspective when looking at the challenges of the organization.
Business Model Canvas
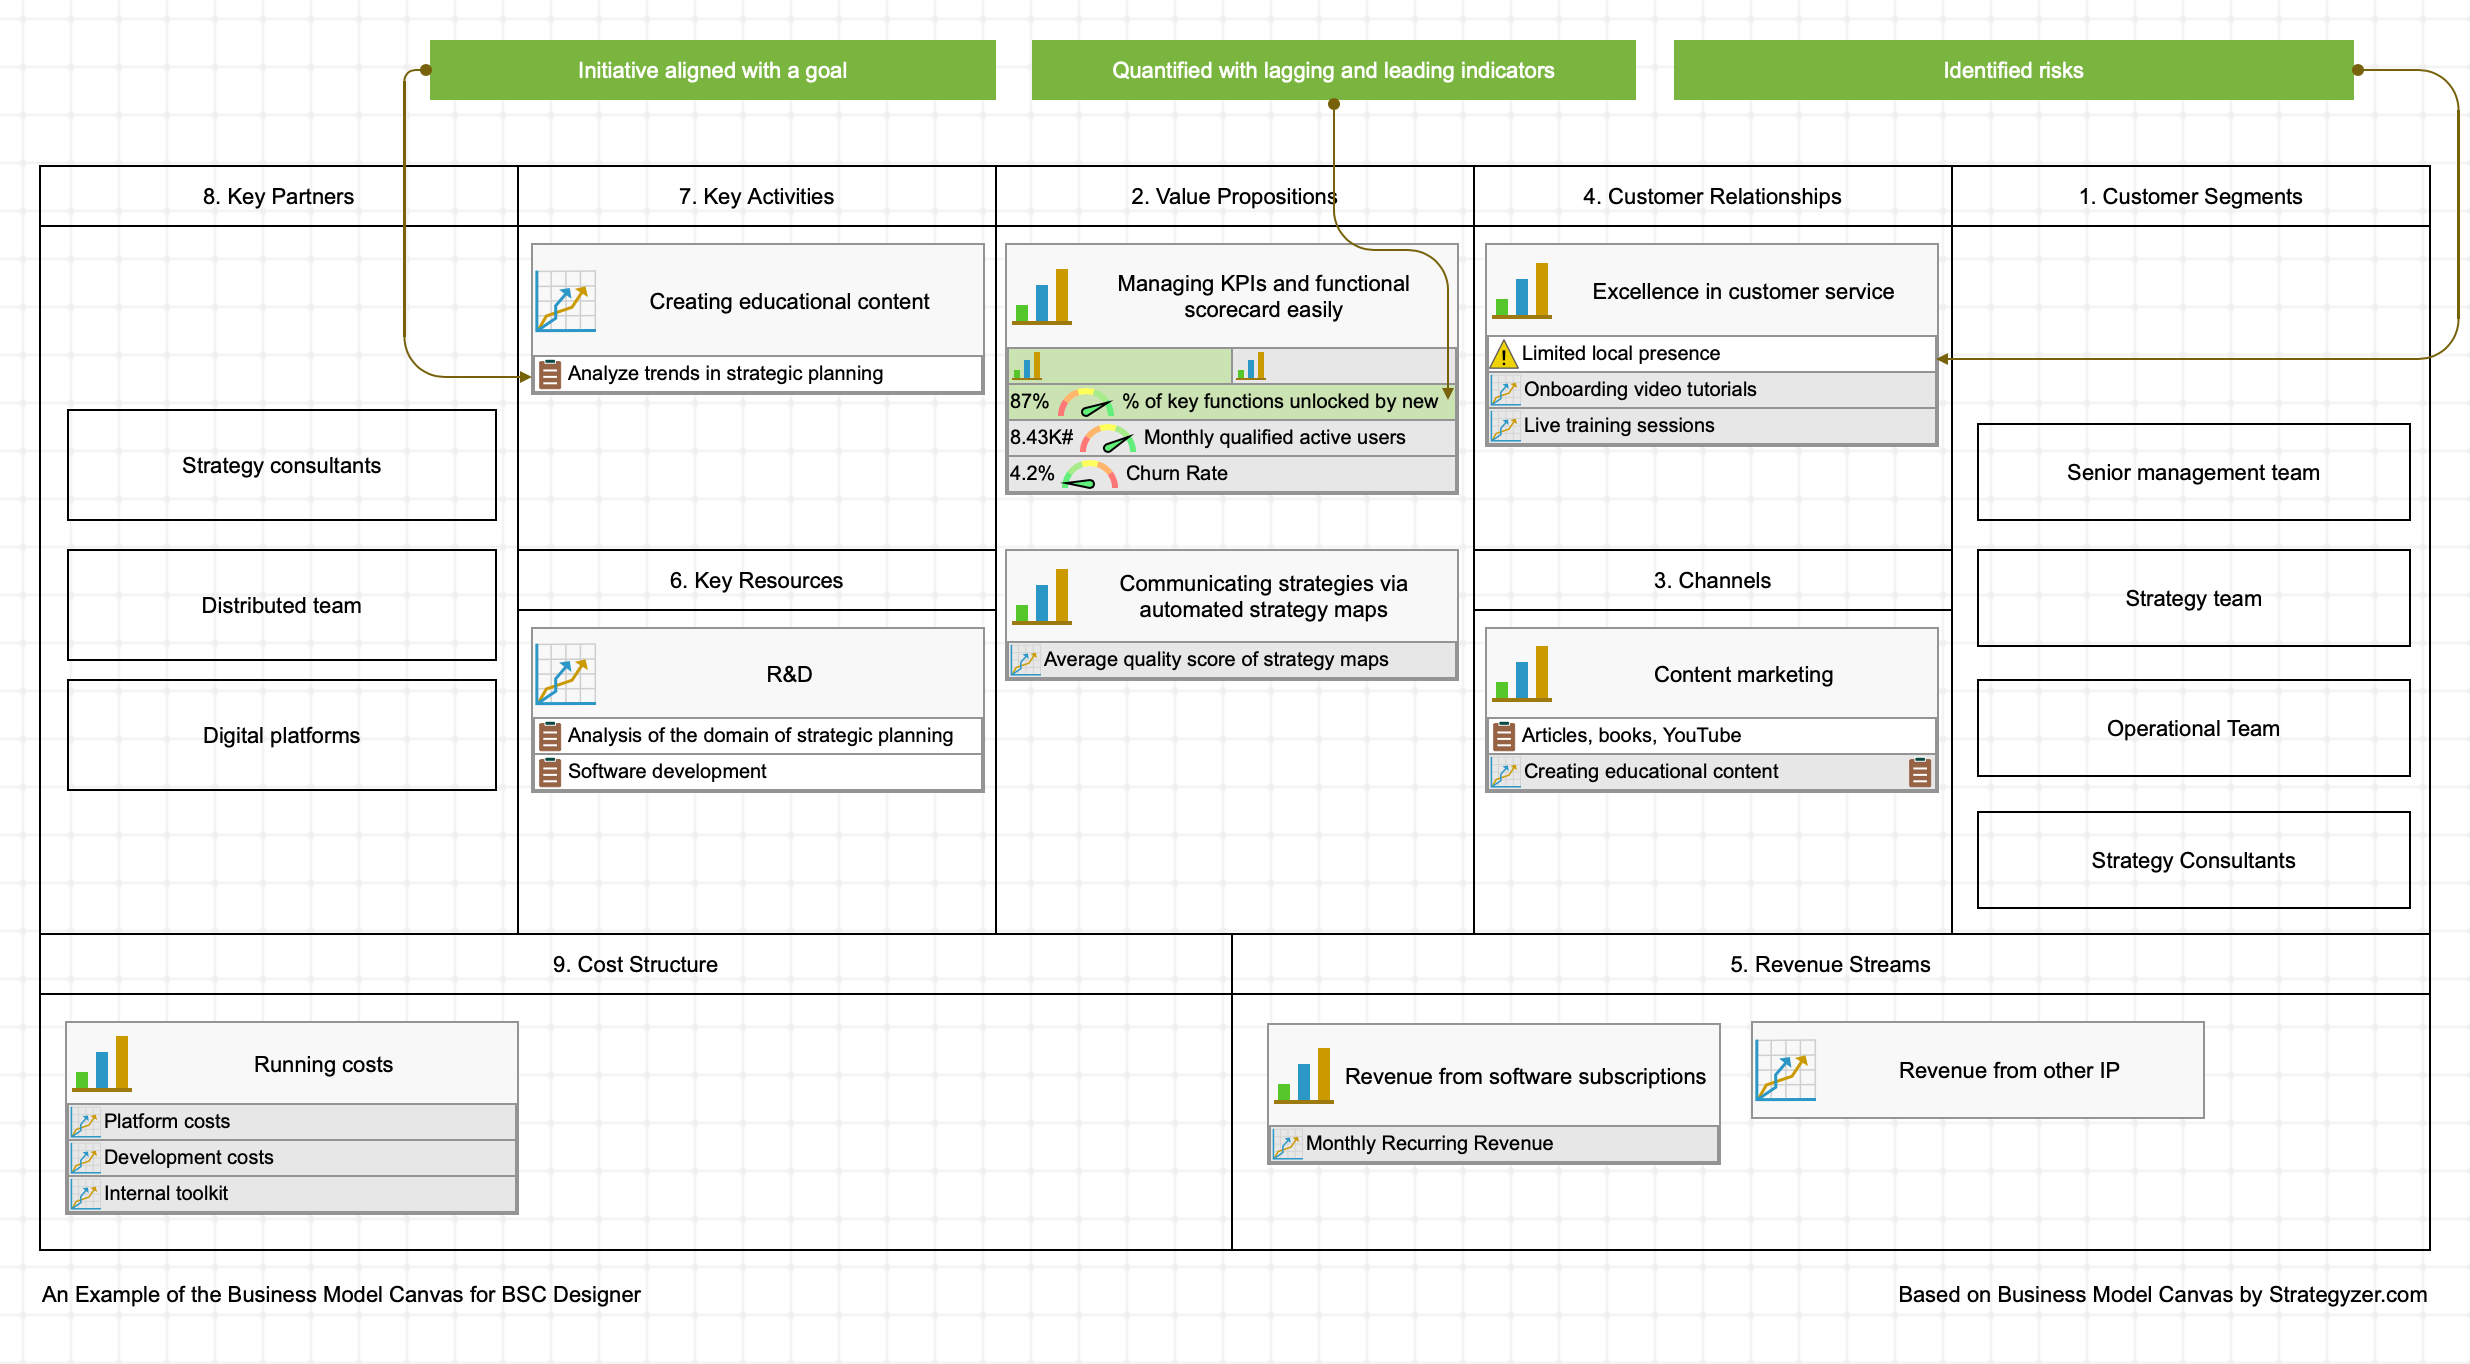
The 9-sector diagram suggested by Strategyzer, is a popular way to describe business models.
The logical order of the diagram explains how the needs of the customers (segment 1) are addressed via the value proposition (segment 2) supported by other segments:
- (3) Channels
- (4) Customer Relationship
- (5) Revenue Streams
- (6) Key Resources
- (7) Key Activities
- (8) Key Partners
- (9) Cost Structure
The standardized approach of the Business Model Canvas makes the visualization and comparison of the business models easier.
The similarity of the sectors of the Business Model Canvas and the Balanced Scorecard framework makes it possible to use the business model presented on the canvas as a starting point for designing a comprehensive strategy with quantified goals and initiatives.
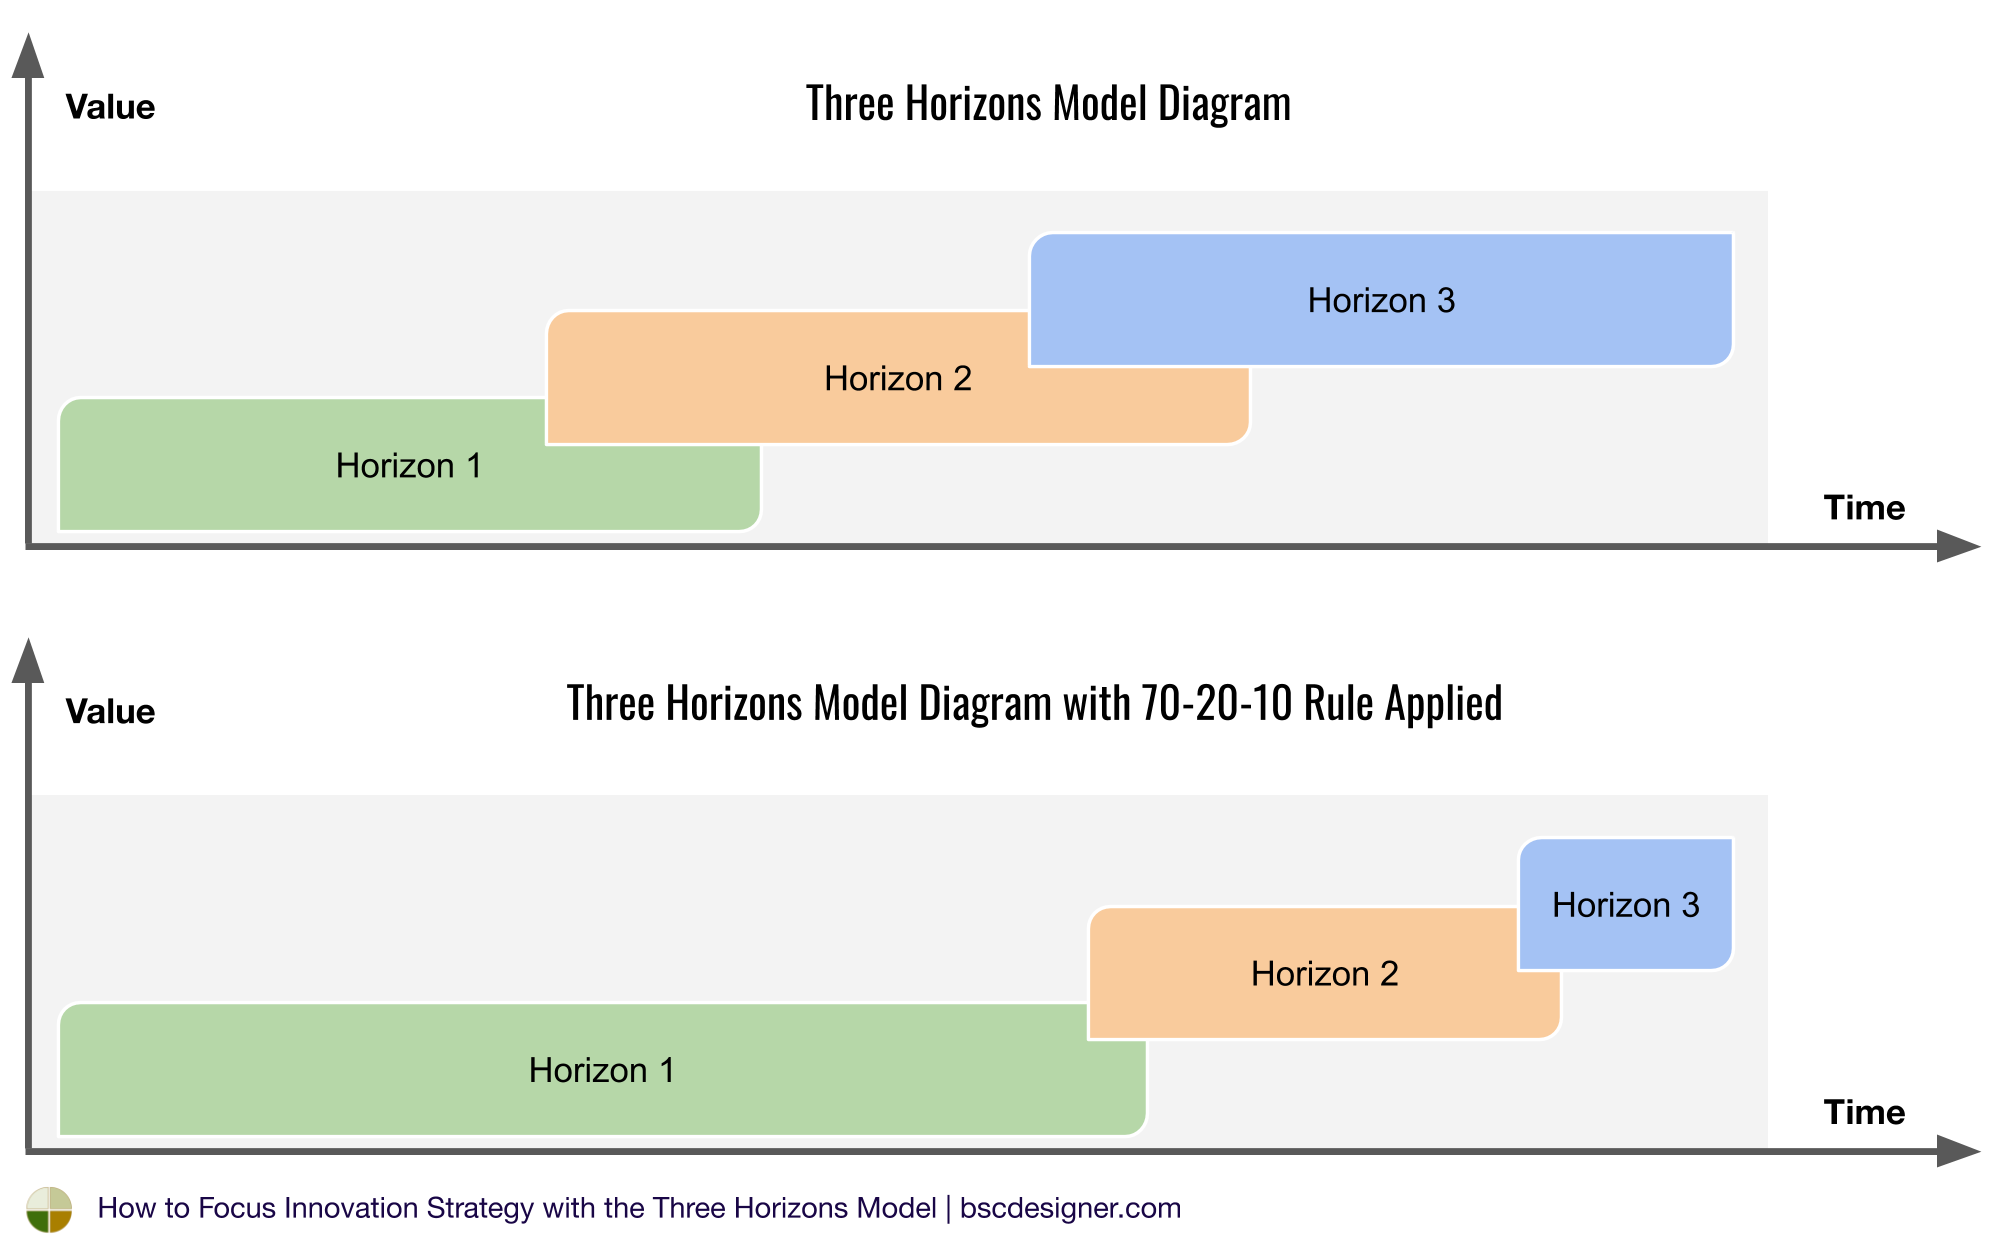
McKinsey’s Three Horizons
McKinsey’s Three Horizons framework addresses innovation planning challenge. It suggests to prioritize innovation efforts according to three time-frames (horizons):
- Now. Something that an organization needs to do today, e.g. innovating its core business
- Near-term future. Innovations that address the challenges in the comfort zone.
- Future. Focusing on trends that might soon become disruptive.
The framework is strong in the context of strategy formulation, especially when we are talking about innovation strategy.

Strategic Change Agenda
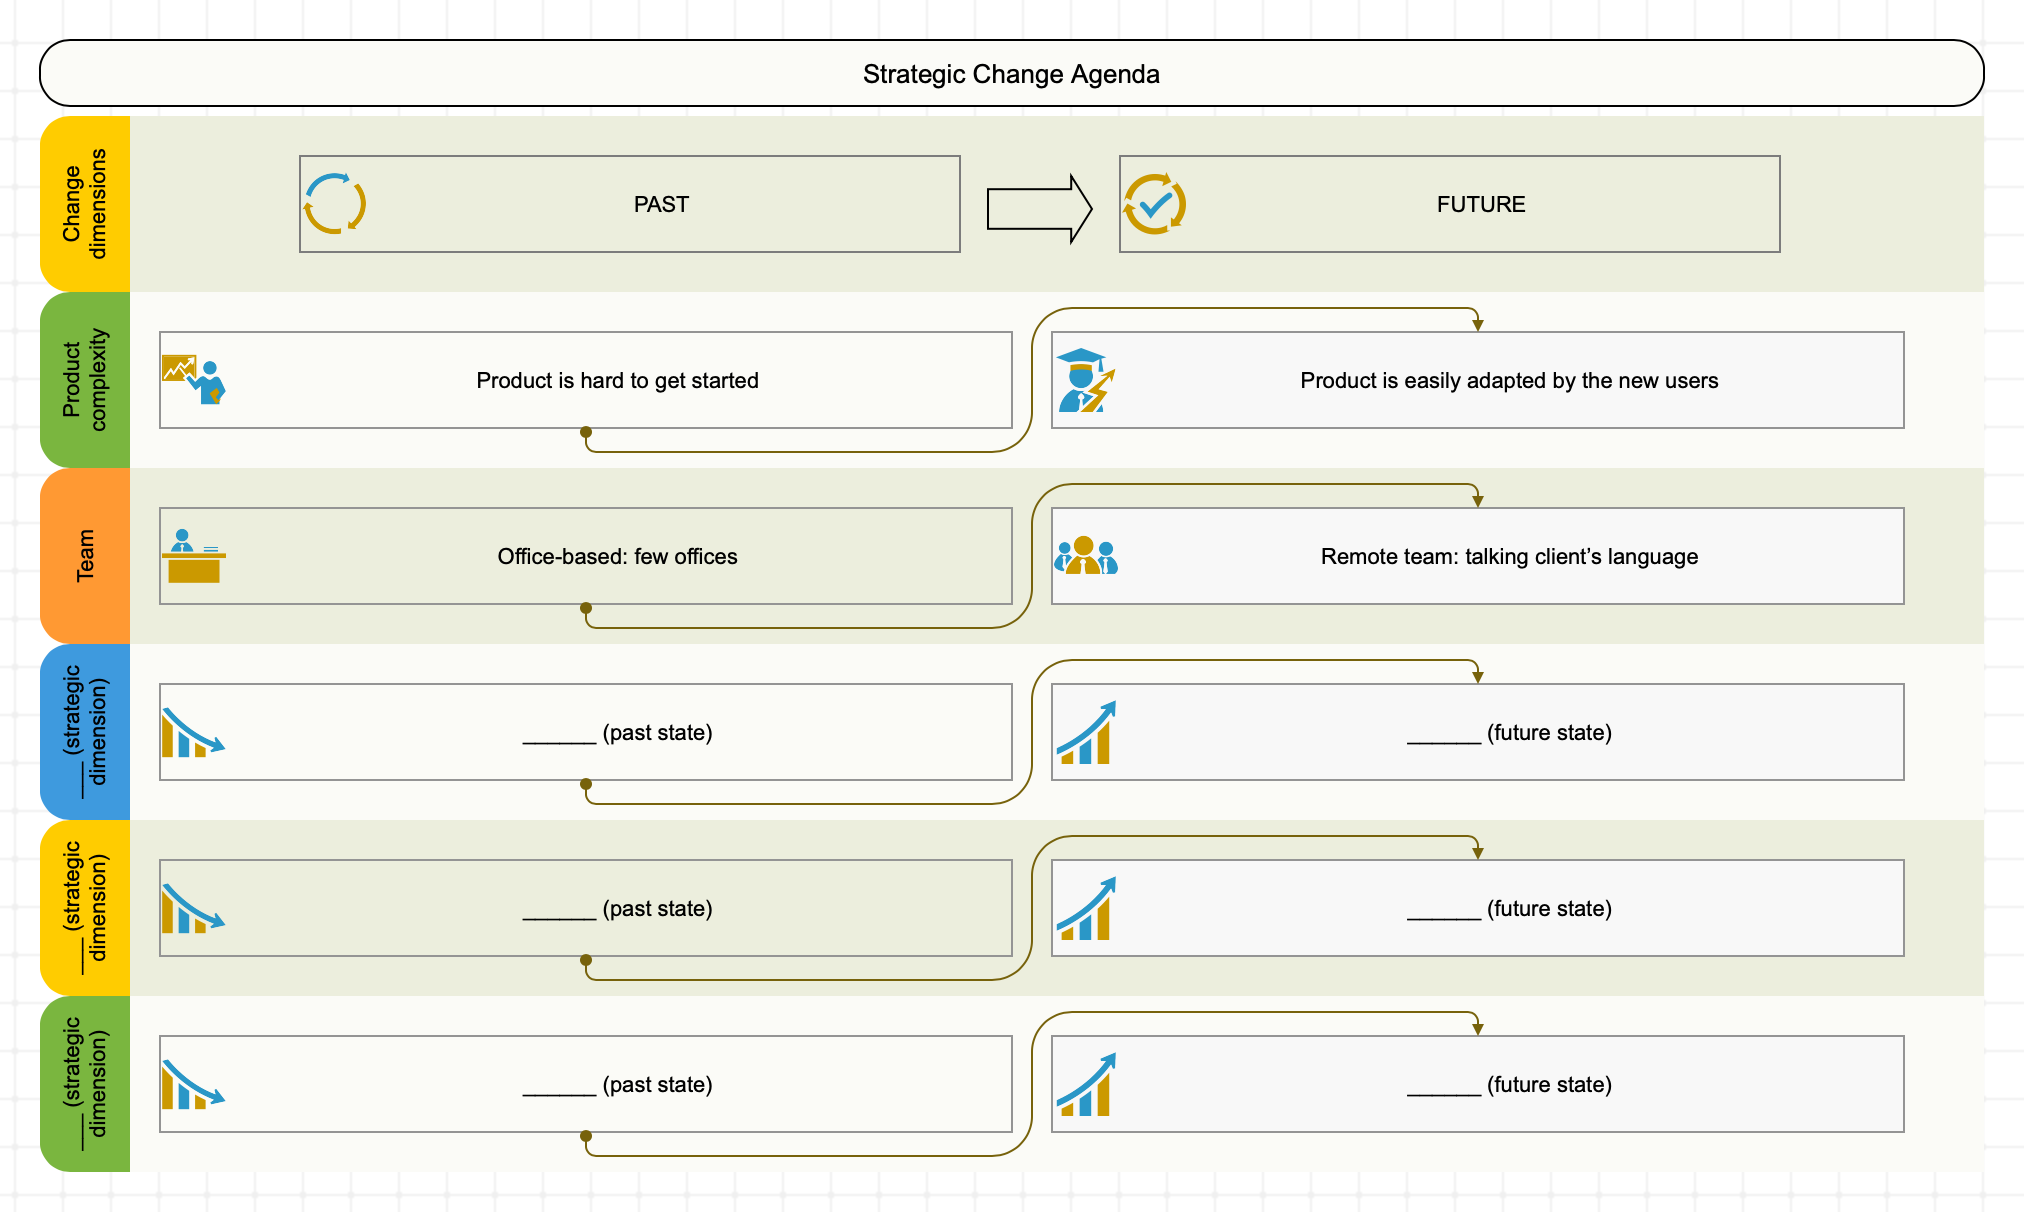
Understanding the reasoning behind the goal is critical for acceptance of strategy and successful strategy execution. Strategic Change Agenda is a powerful tool that helps organize the insights of strategic analysis and convert them into contextual goals on the strategy map.
Here is a typical process of using Strategic Change Agenda:
- Analyze the outputs of other strategy formulation frameworks like PESTEL, Five Forces, or VRIO to formulate possible change dimensions.
- Describe the current states (“Past”) and the desired states (“Future”) across the change dimensions.
- Formulate goals on the strategy map using the change dimensions and the past/future states as a context.
The framework solves two problems of strategy execution:
- Formulating goals is much easier when the expected change is explained in the context of a change dimension.
- Formulated goals have a rationale “by design,” making it easy for a strategy team to answer “why?” questions and update goals if needed.

SWOT+S
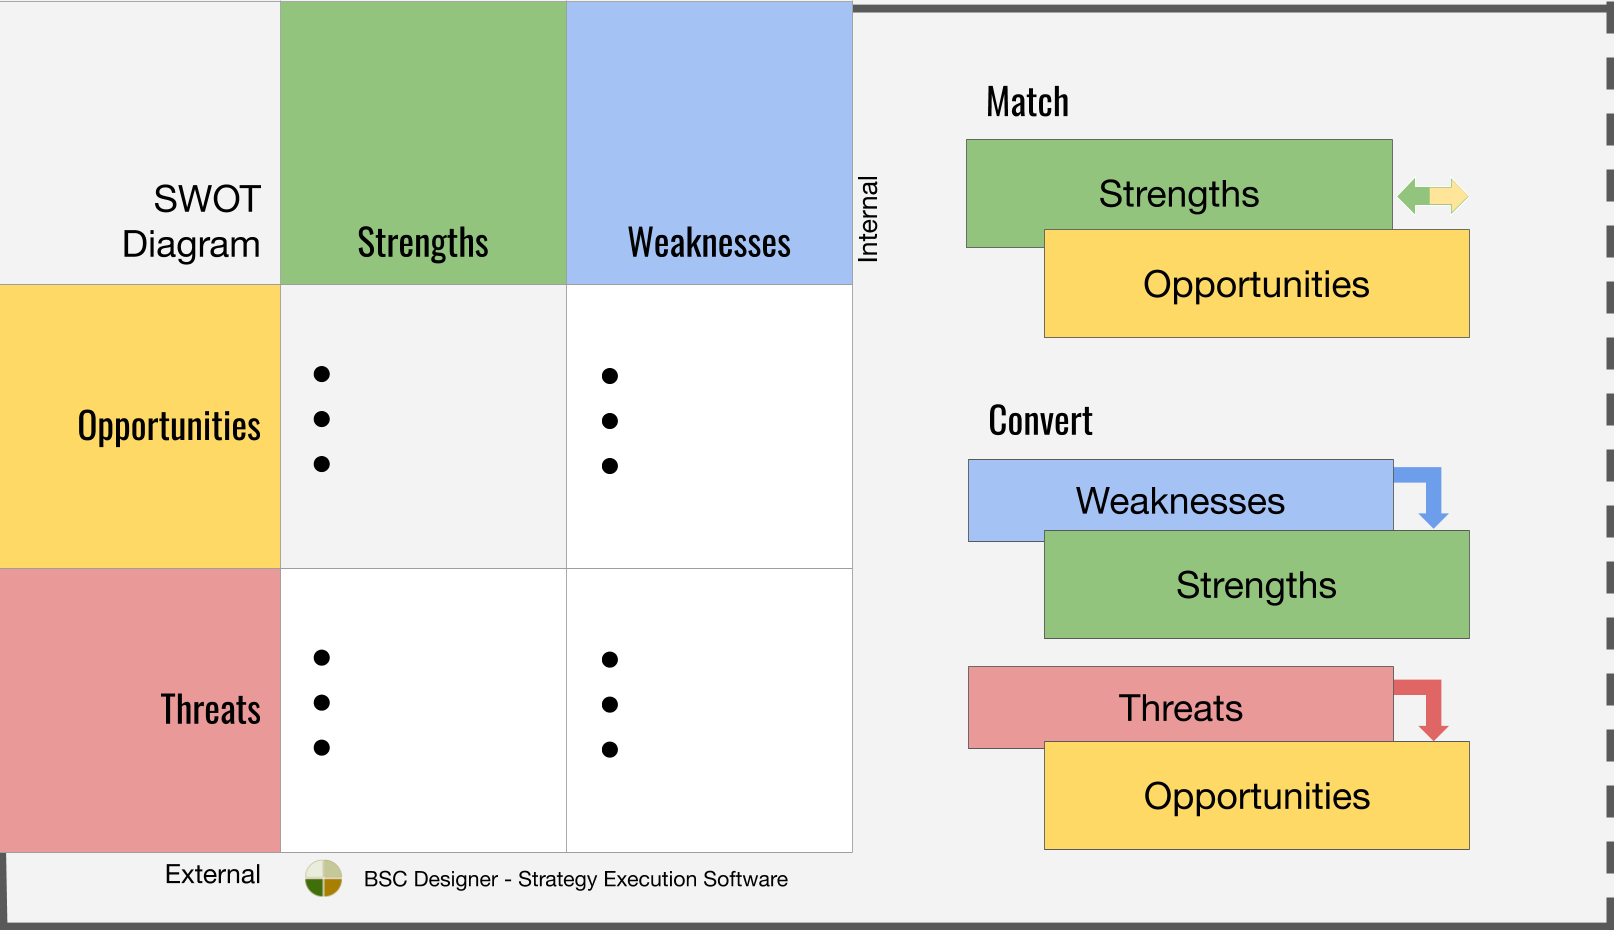
A classical SWOT framework helps to analyze the company’s position from the four perspectives – Strengths, Weaknesses, Opportunities, and Threats.The action plan for SWOT analysis is:
- Match strength and opportunities, or
- Convert weaknesses and threats into strengths or opportunities
With the SWOT+S framework, we make SWOT analysis more specific by focusing on different projections of its components. For example, instead of simply talking about strengths, we are looking at the strength from a customer, internal, innovation, and financial perspective.
Such an approach also makes it easier to use the results of SWOT analysis for further strategy description on a K&N strategy map.
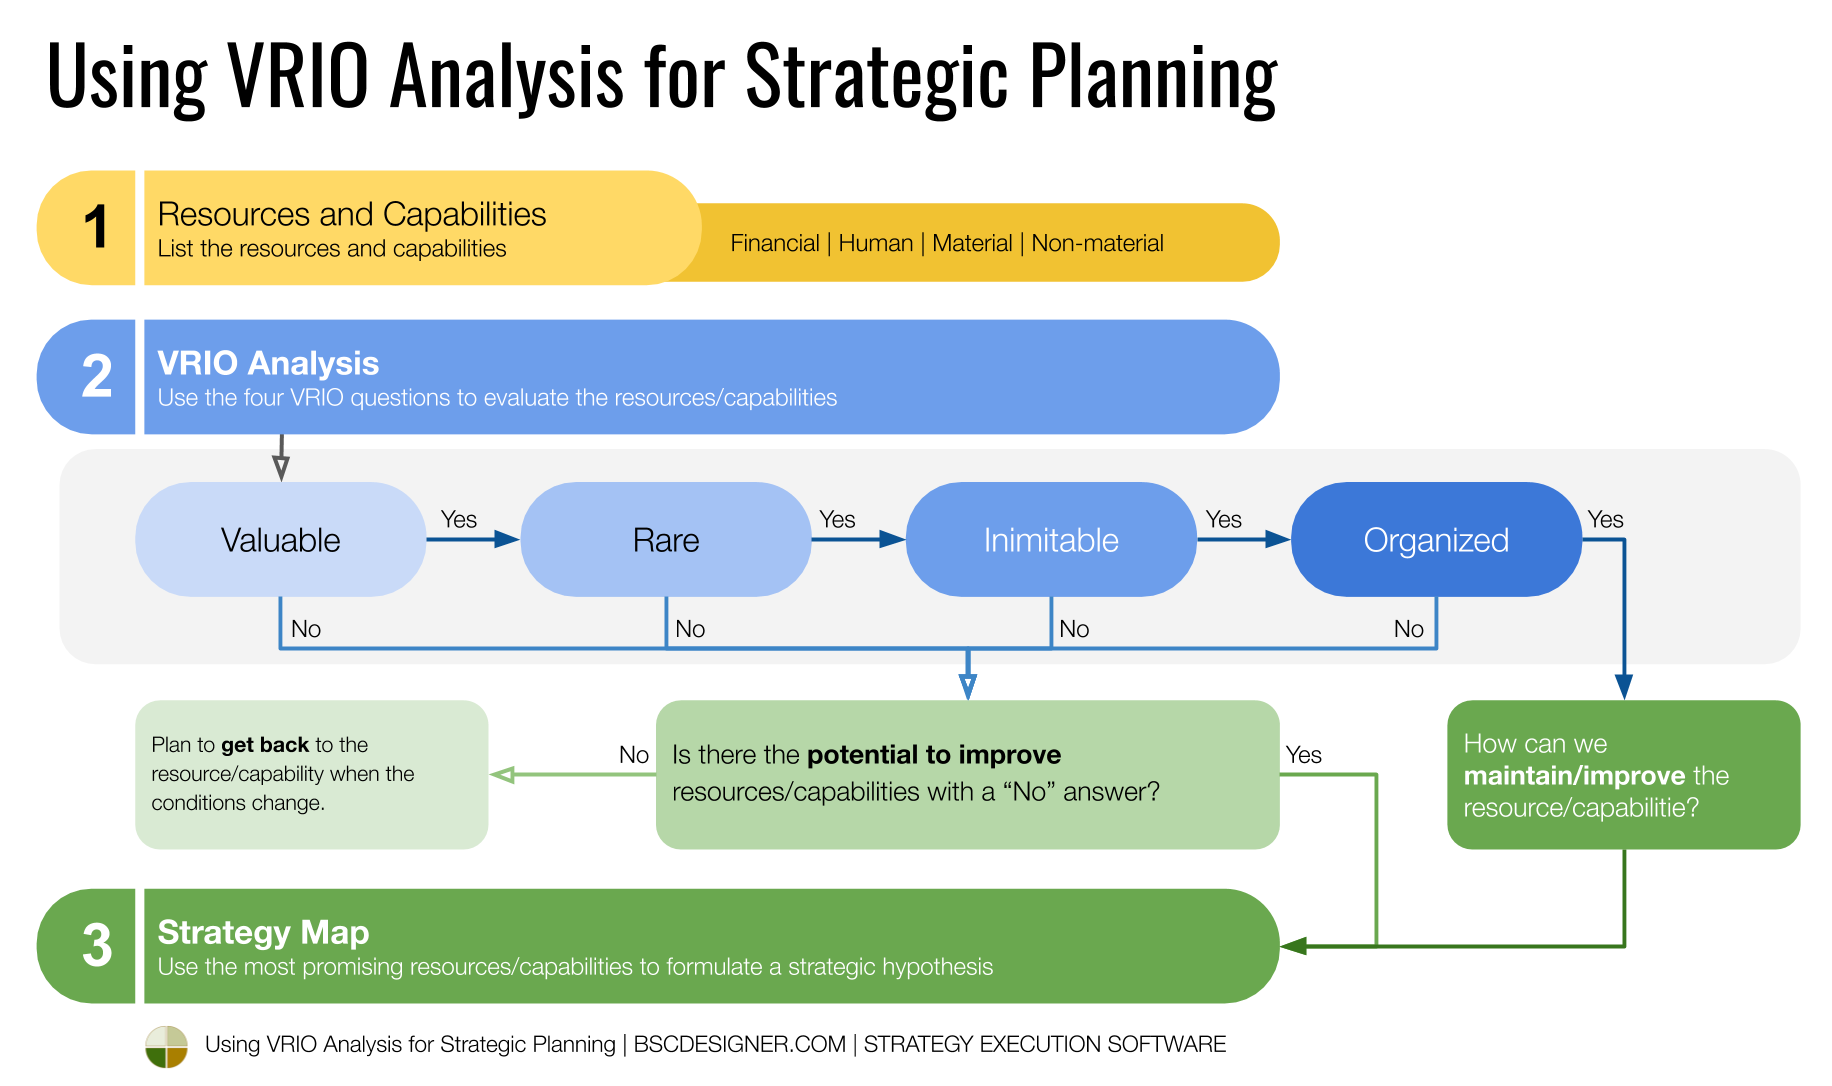
VRIO
The goal of VRIO analysis is to find a sustainable competitive advantage and the resources that are needed to achieve it. VRIO is often used to explain why certain companies are successful. In practice, VRIO analysis helps to look at the potential of certain “resources” to help achieve sustainable competitive advantage.
Formal VRIO analysis is thought-provoking on the stage of strategy formulation. Its potential to describe strategy is limited by a simple table diagram that could point to improvement directions but won’t provide a space for specific action plans or performance indicators.

7-S Framework
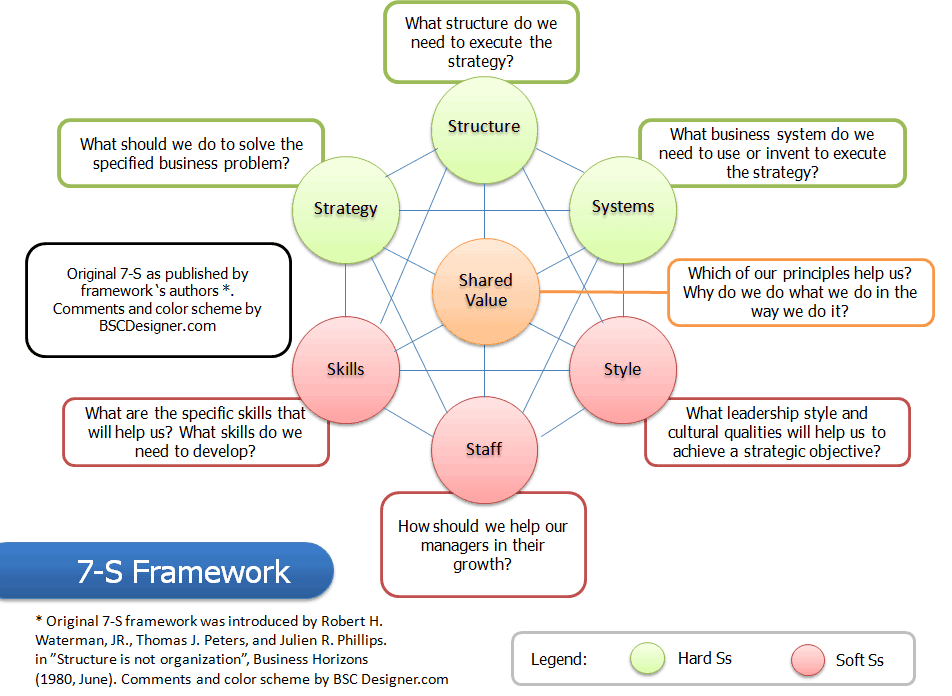
The 7-S framework is another strategy formulation framework. In this case, a business challenge is analyzed from the perspective of 7 factors (the Ss). These 7 factors are divided into:
- Hard Ss – Strategy, Structure, System, and
- Soft Ss – Shared Values, Skills, Style, Staff
Can a 7-S framework be used together with BSC? The findings of 7-S can organically form the business goals that are mapped on the strategy map. Here is what Robert Kaplan, one of the authors of the BSC framework, said on the topic:
I believe that the BSC is not only fully consistent with the 7-S framework, but that it can also enhance it in use.
Robert Kaplan in “How the Balanced Scorecard complements the McKinsey 7-S model” [1]

PESTEL
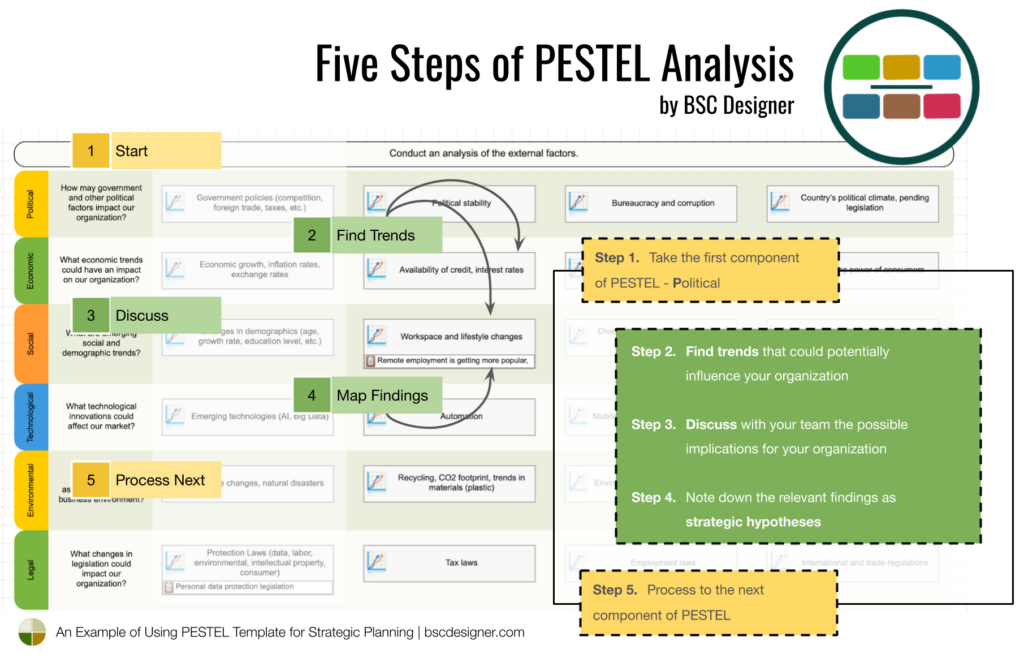
PEST or PESTEL analysis refers to the analysis of the external factors. What are those factors?
- Political
- Economic
- Social
- Technological
- Environmental
- Legal
The findings of PESTEL analysis can be used on the strategy formulation step of strategic planning process either as an input to other business tools, like, for example, SWOT or directly, as strategy map goals that address specific challenges.

Scenario Planning
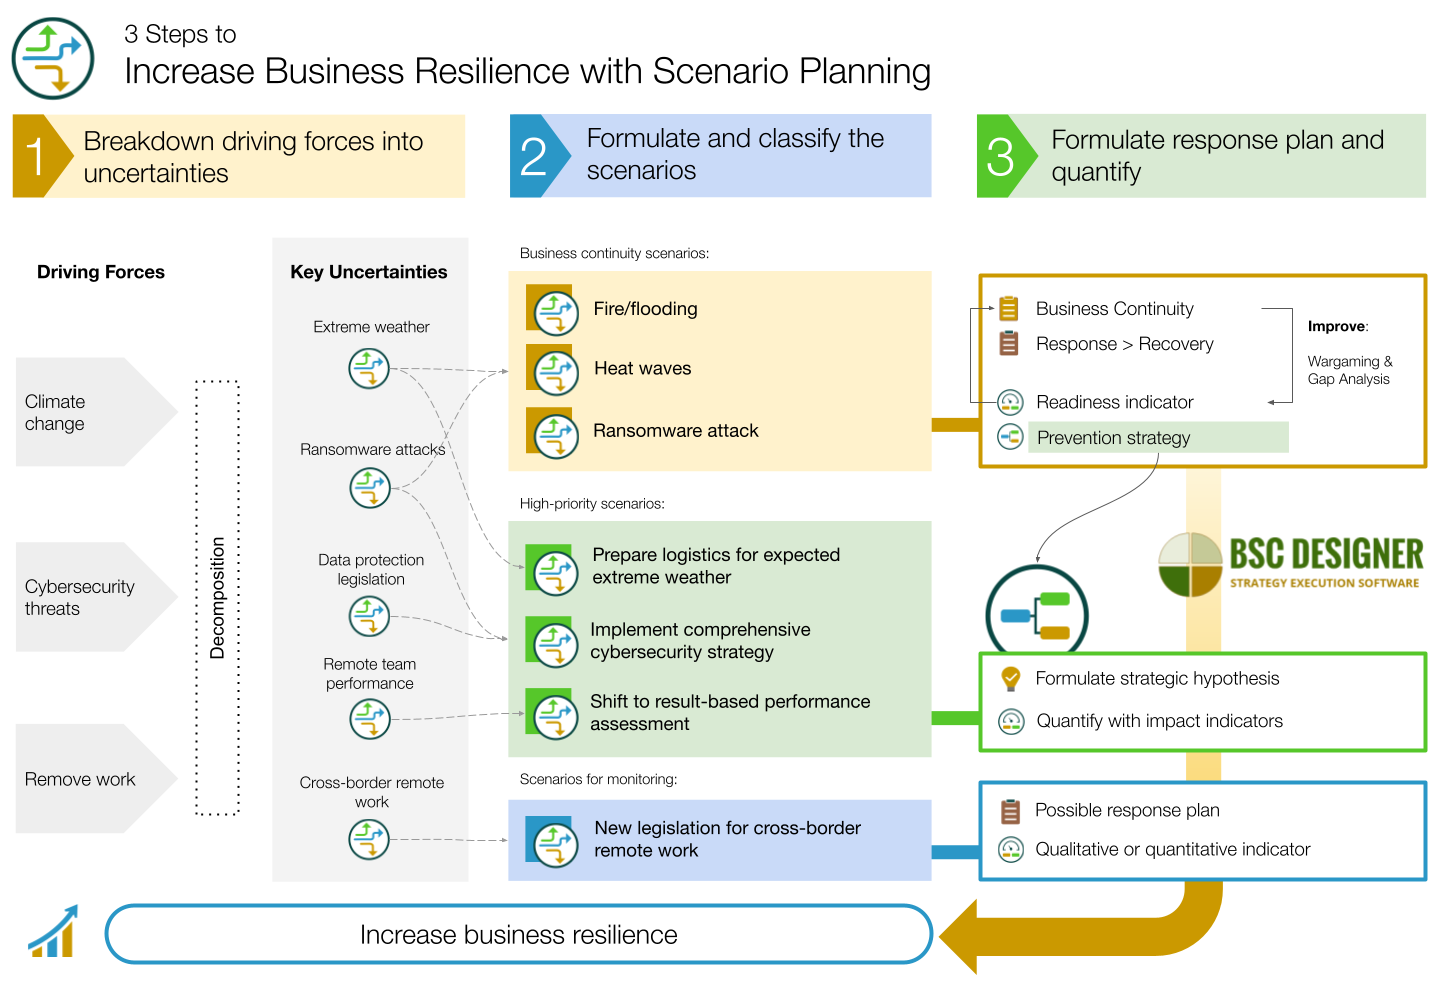
Scenario planning is a disciplined approach to converting driving forces and their uncertainties into strategic hypotheses. The analysis of driving forces can be performed with PESTEL, Five Forces or other relevant frameworks. The found uncertainties can be classified according to their estimated business impact. Respectively, we can have:
- Scenarios related to the business continuity planning
- High-priority scenarios that can be aligned with existing strategy as a strategic hypothesis
- Scenarios for monitoring with possible response plan
Depending on the type of scenario, we can use different tools to quantify them:
- Business continuity scenarios can be validated with wargaming exercise and quantified with readiness indicators
- The high-priority scenarios are quantified with relevant impact indicators
- The scenarios for monitoring are quantified with early sign indicators
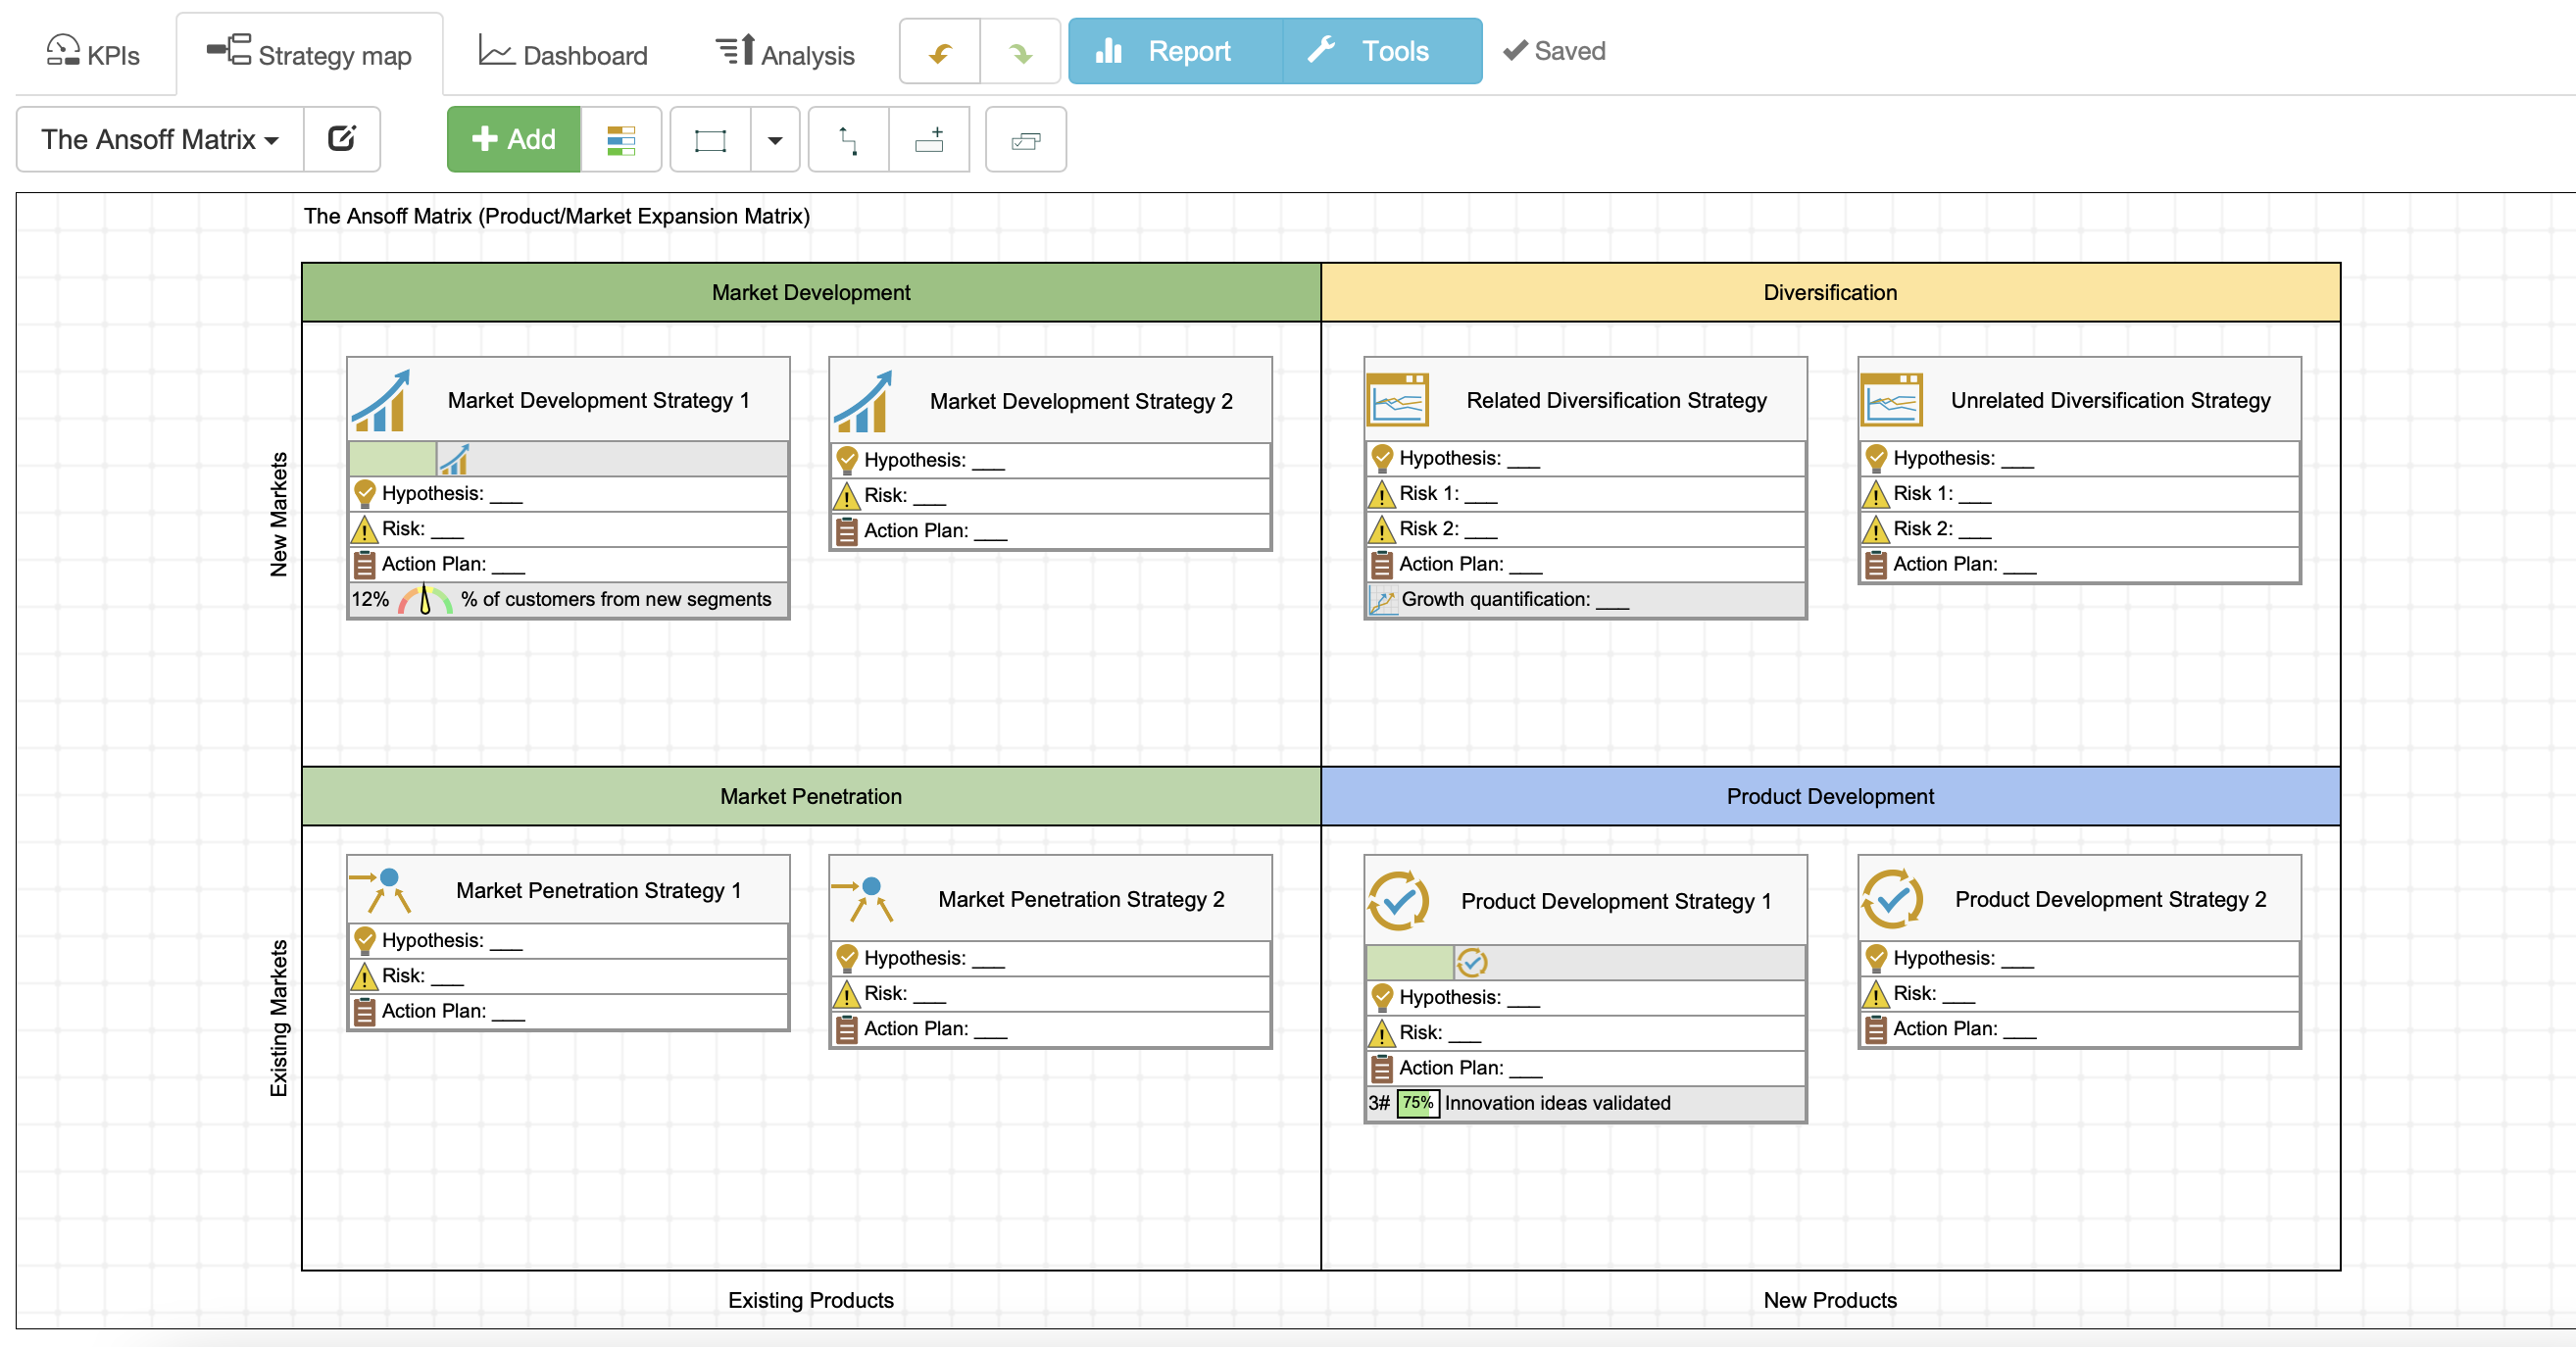
The Ansoff Matrix
- Market Penetration
- Market Development
- Product Development
- Diversification
The rationale of the Matrix is based on these principles:
- Growth via diversification is imperative for long-term survival and success
- Growth is the result of many diversification strategies executed simultaneously
- Quantitative estimation of stability and growth help to compare diversifications alternatives
- While diversification is risky by definition, the ultimate results of diversification are better distributed and controlled risks
- Diversification helps to improve readiness for unexpected events
Porter’s Five Forces
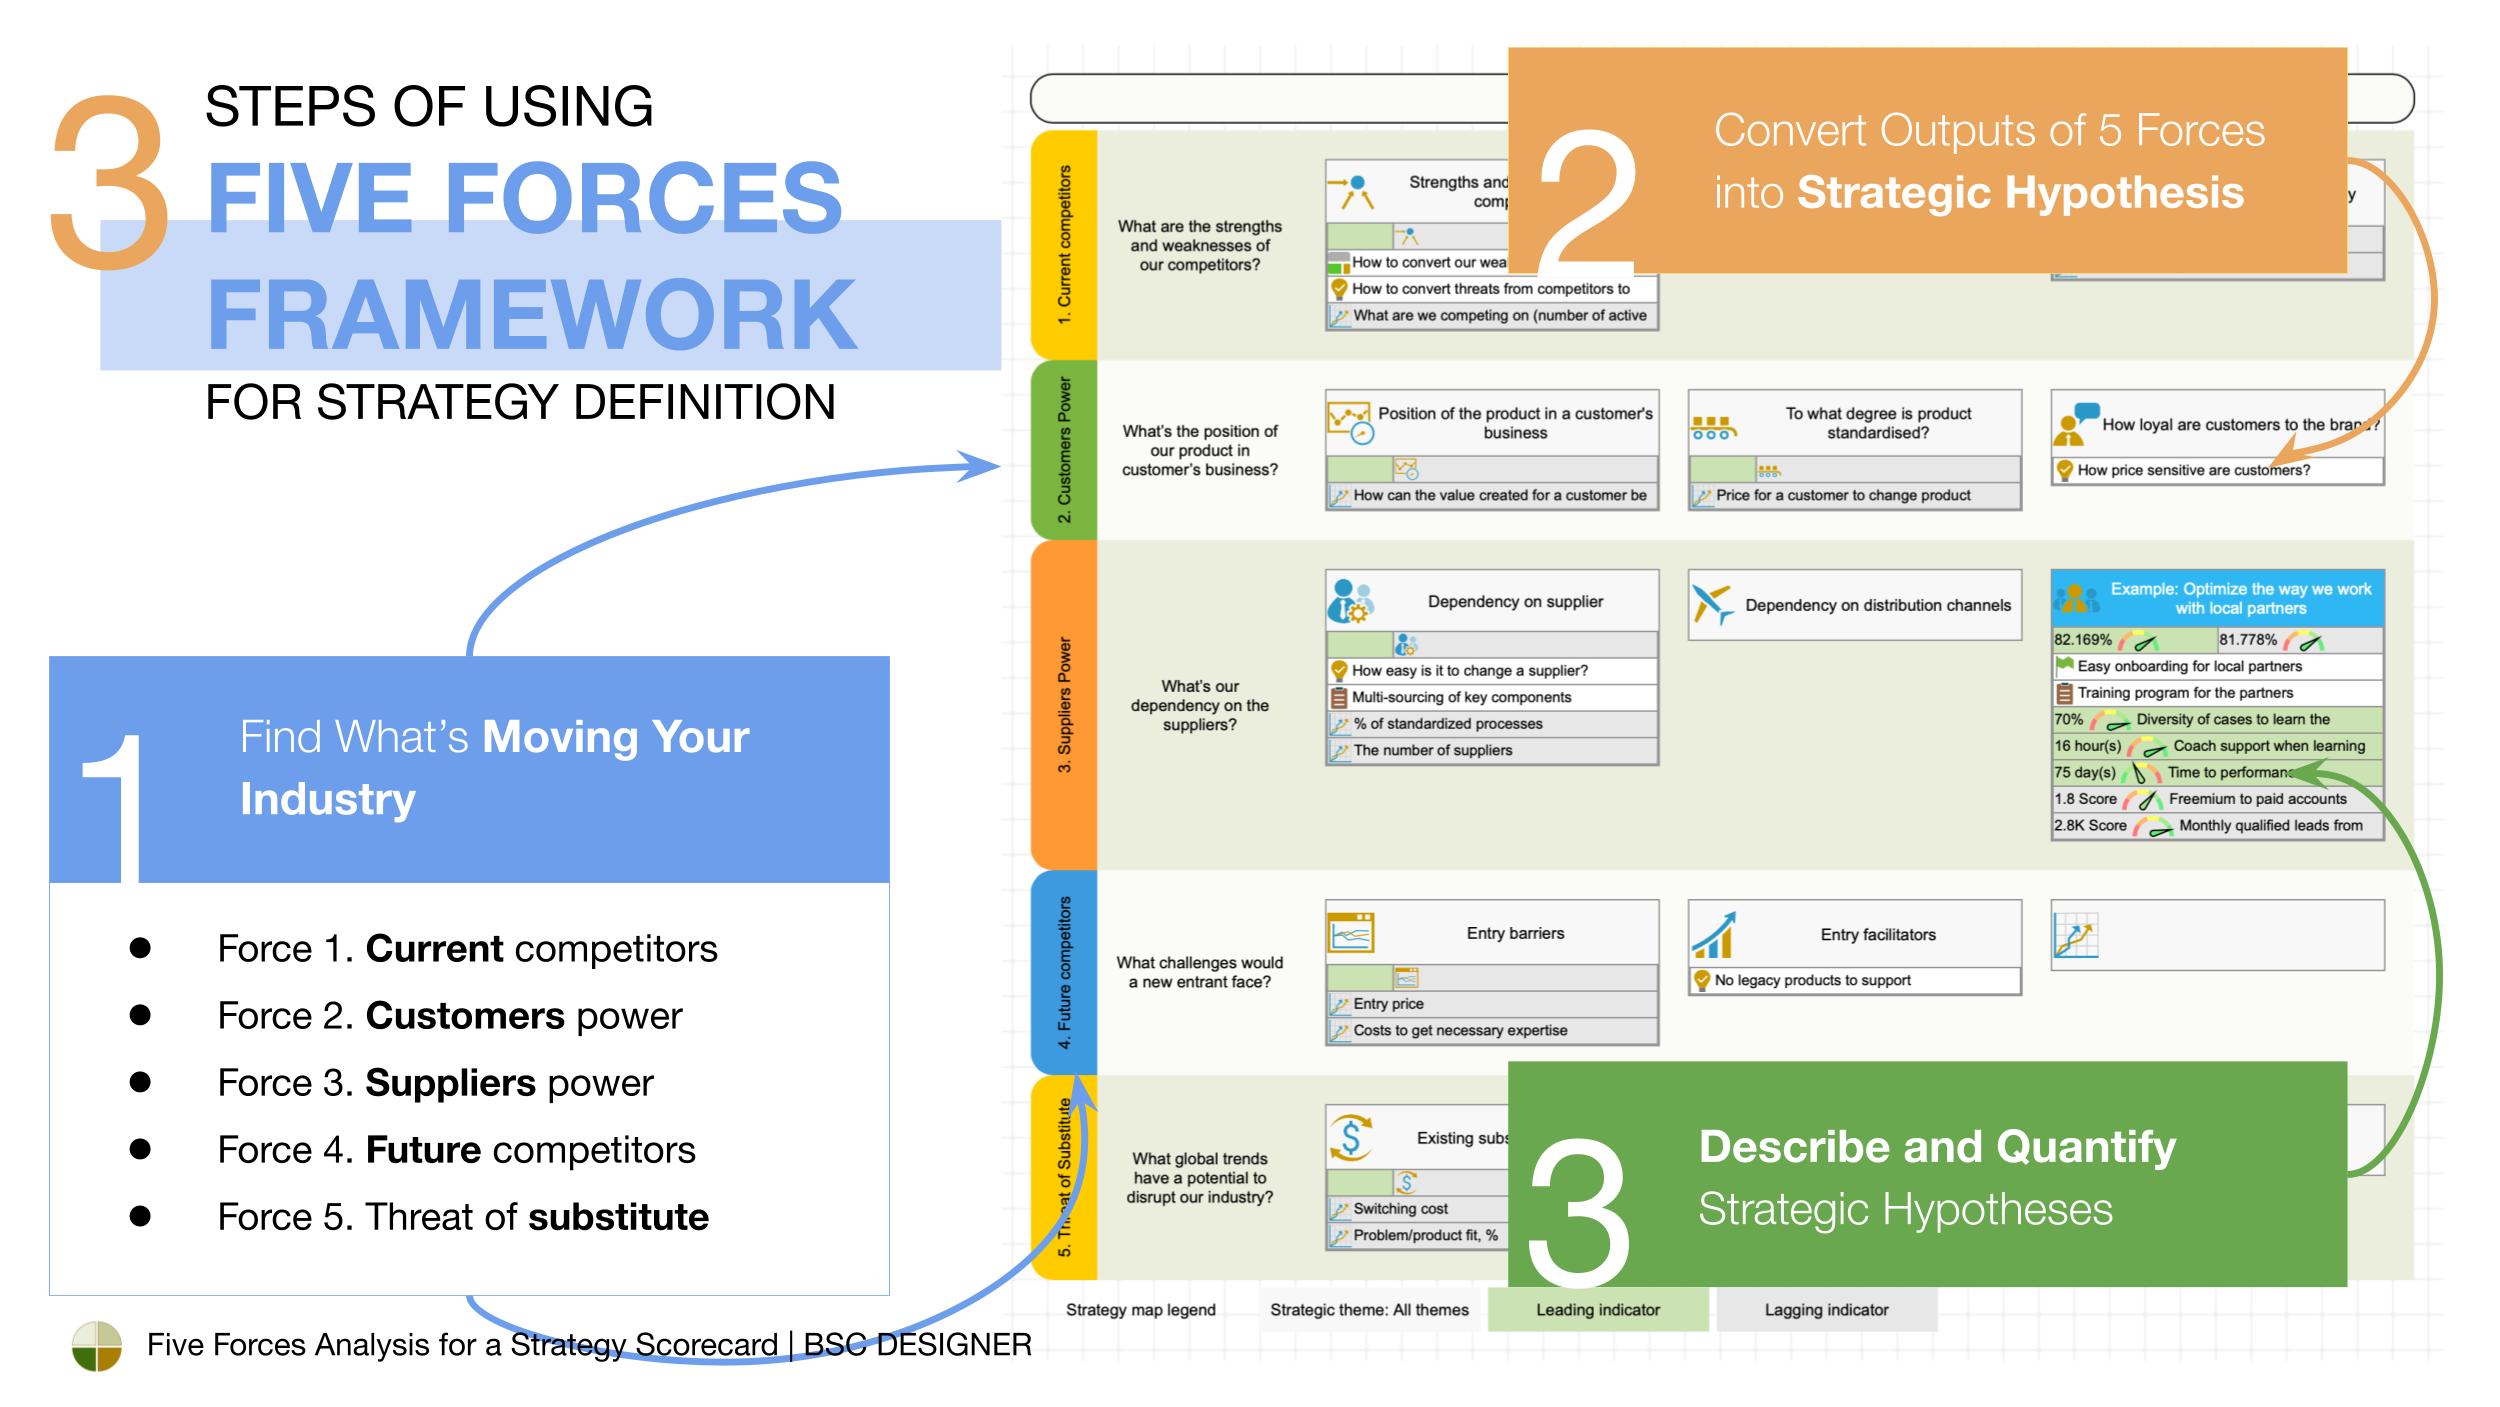
The Five Forces framework focuses on the challenges of competitive analysis. Instead of focusing on undifferentiated competition, the framework suggests building a competitive model first using the prism of five forces:
- Existing competition
- New entrants
- Customers power
- Suppliers power
- Substitutes
A strategist is supposed to find the factors of competition in the context of each of the forces and formulate the response strategy accordingly.
There are other strategic planning frameworks that will help with competitive analysis.
- Compared to SWOT, the Five Forces suggests a more disciplined approach to competitive analysis by providing a competitive model to start with.
- By default, there is no time perspective included in Five Forces; in this sense, it can be used together with Three Horizons.
- The Five Forces approach is from general to specific. In some cases, starting from specific and moving to general (VRIO framework) is more effective.
Check out a more detailed comparative analysis in the article about Five Forces.
Pareto Analysis
Different business frameworks could generate a lot of competing strategic hypotheses. Pareto analysis helps to pick the few to focus on right now.
The key idea of Pareto analysis in the context of strategic planning is to compare:
- Resources needed to try certain hypotheses versus
- Expected benefits from successful validation of the hypothesis (achieving business goals)
By focusing on the most promising hypothesis, an organization could achieve expected results with fewer resources.

Blue Ocean Strategy
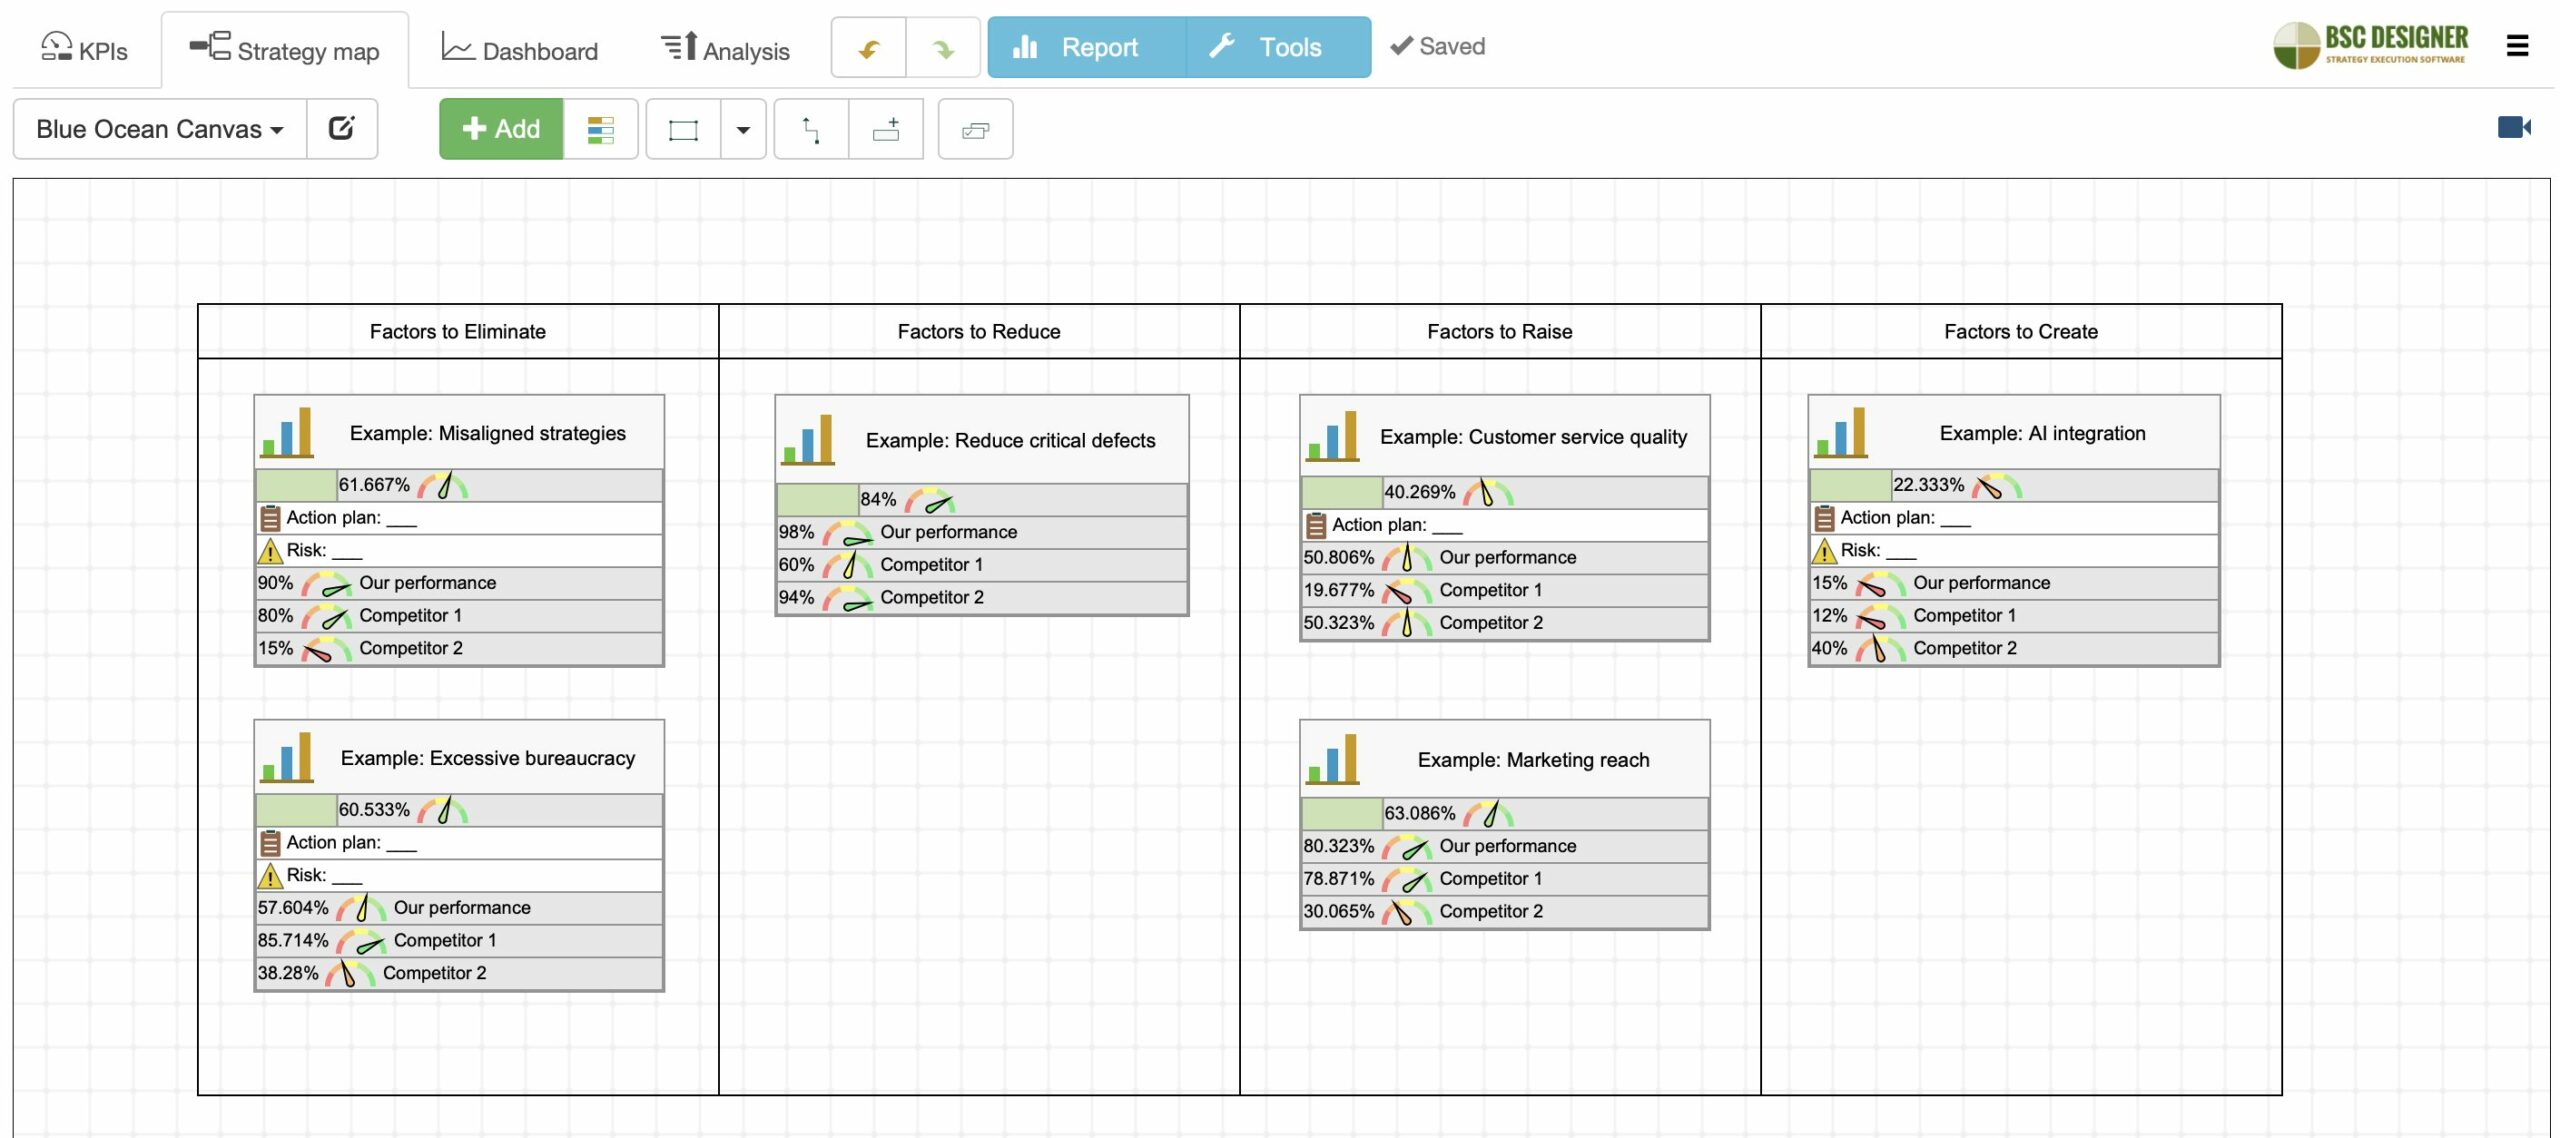
Introduced in 2004, the Blue Ocean Strategy promotes the idea of finding sustainable advantages by positioning in markets with low competition and high value creation potential. The decomposition method of the framework is to categorize the impact of the driving forces into four segments:
- To eliminate
- To reduce
- To improve
- To create
With these segments in mind, organizations can start focusing their competitive strategy towards the blue ocean markets. A similar approach was promoted by the VRIO framework, but in the Blue Ocean Strategy, we can trace more causality between addressing the driving forces and shifting to the preferred market position.
Constraints Analysis
Constraints Analysis or TOC theory was formally introduced in “The Goal” book by Dr. Goldratt with some good examples from manufacturing.
This analysis helps to determine the constraints (bottlenecks) of the system and optimize performance following these five steps:
- Analysing constraints
- Response plan in the context of constraint
- System update to fulfil response plan
- Updating constraints
- Getting back to step 1
Shifting from manufacturing to a technological economy, we are still facing constraints, but their number increases and their impact is often not clear. Similar to Pareto Analysis, the main focus area of constraints analysis in the context of strategic planning is step 2 – strategy formulation.
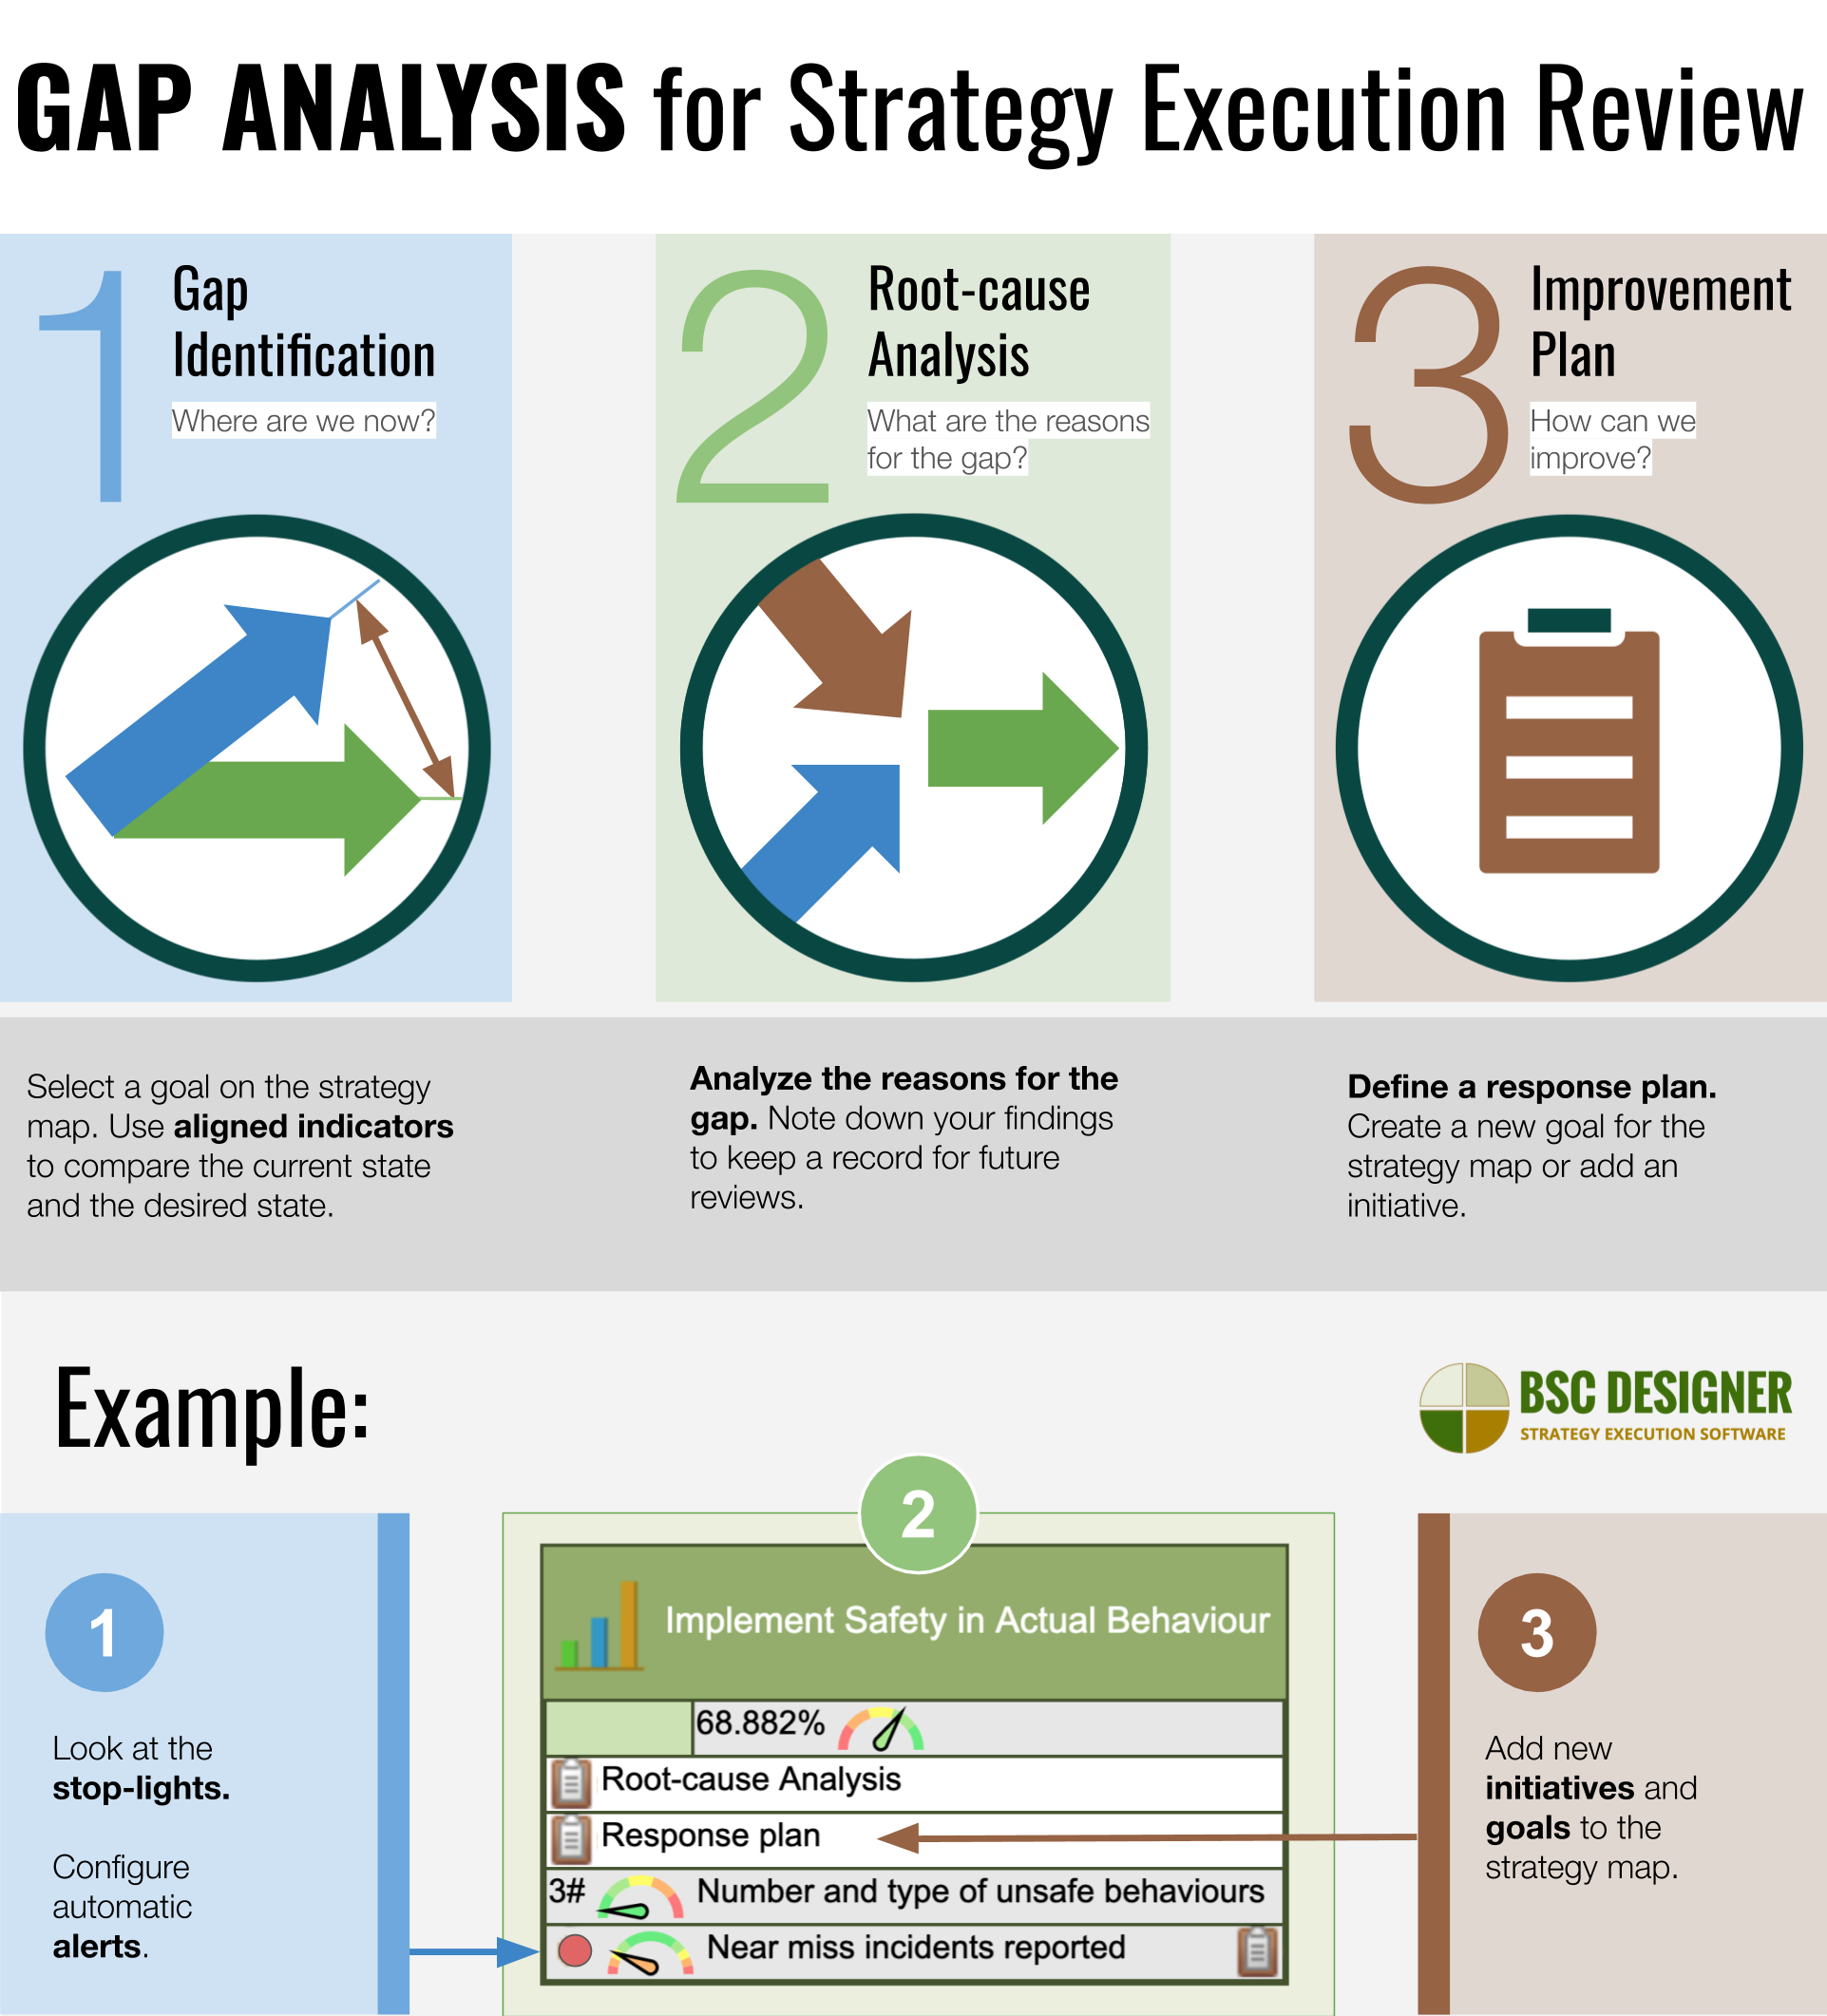
Gap Analysis
The gap analysis is another business tool that helps in finding improvement points by comparing expected performance with actual results. The steps of gap analysis are the following:
- Gap Identification. Understanding where the organization is now and how its actual performance is compared to the expected performance.
- Root-cause Analysis. Understanding the reasons of gap.
- Improvement Plan. Developing the improvement plan.
Here is how Gap analysis helps in the different steps of the strategic planning process:
- On the strategy formulation step, gap analysis will help to come up with improvement direction based on historical results
- During strategy description, the results of gap analysis are presented in the form of indicators and the gap (the difference between the indicator’s current value and target value)
- On the strategy execution step, understanding where the gap is (based on indicators’ data) helps to introduce corrective actions quickly
Prioritization Frameworks
Strategy is about making choices, and choices are about analyzing alternatives and defining their priorities.
- How are these priorities calculated?
In strategic planning, basic prioritization is done by such tools as:
- SWOT Analysis – the priority goals are the result of matching strength and opportunities or converting weaknesses and threats into strengths or opportunities
- Gap Analysis – the priority is on the goals with higher absolute weight and biggest performance gaps
- Pareto Analysis – suggests to focus the efforts on 20% of the most promising goals; however, not giving a specific way to spot those goals
- Strategic Themes of the Balanced Scorecard – that work as high-level priorities for the rest of the strategic goals
Mentioned frameworks are a starting point for prioritization on a strategic level. When we move to operational level (think about product development, for example), we need different tools that could calculate a specific priority score.
We have discussed some popular prioritization frameworks in a separate article with some specific examples for the users of BSC Designer.
In the context of strategic planning, those frameworks might be considered as part of a strategy formulation toolkit, respectively. In the comparison table, we can put them into the Step 2 column.
Strategy Planning Software
Depending on the strategic planning model, the need for automation software change. Here are some thoughts about the effective use of automation tools.
General Principles
- Understand the concept first. Automating wrong things will do more harm than good. Give a new framework a try on paper before moving to automation software.
- Write down rationale. In many cases, we get the results from the strategy formulation framework (for example SWOT or Three Horizons) and add it as a goal to the strategic plan. What is important is to write down the reasoning behind those findings. It will be helpful in the review stage.
- Focus on one tool. If we look at strategic planning tools from an abstract perspective, then everything rotates about three artefacts – goals, indicators, and supporting documentation. Your organization will benefit if it uses one tool to manage all the artefacts related to strategic planning instead of supporting various software that approach the same problem from different sides. Learn more about procurement for strategic planning software.
Where Strategy Planning Software Can Help
| Step of Strategic Planning | Software Solution Helps To… |
|---|---|
| Step 1. Mission, Vision, Values |
|
| Step 2. Strategy Formulation |
|
| Step 3. Strategy Description |
|
| Step 4. Strategy Cascading |
|
| Step 5. Strategy Execution |
|
BSC Designer Software
Where BSC Designer can help in the context of automation:
- Our main focus is Balanced Scorecard framework and its strategy map
- We do excellent support for Key Performance Indicators
- In the templates section, you will also find some examples that will help you to get started with other business frameworks easier.
BSC Designer is strategy execution software that enhances strategy formulation and execution through tangible KPIs. Our proprietary strategy implementation system reflects our practical experience in the strategy domain.
Excellent Aleksey !!!!!