Managing Key Performance Indicators (KPIs) in BSC Designer
Create new KPIs, adjust their settings, input KPI data, specify measurement scale, and optimization function.
For more information about KPIs, check out this article.
Creating a New KPI
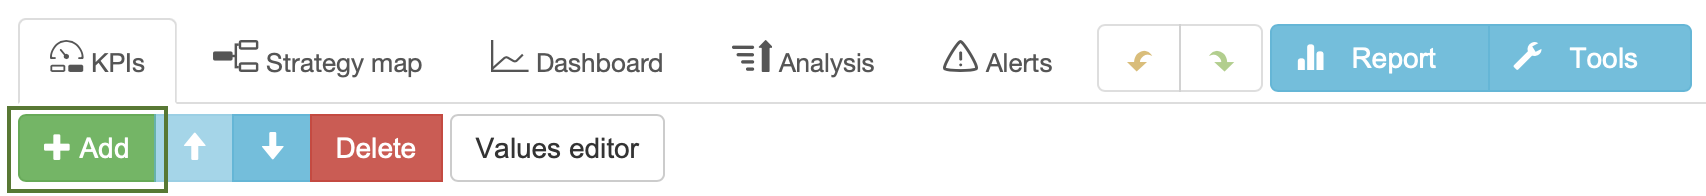
- Select an indicator that will be a container for a new KPI
- Use Add button
Manual Data Entry
To enter data manually follow these steps:
- Select or create any indicator
- If needed change an update interval
- Select appropriate date in the calendar
- Enter a new numeric value into the Value field
Alternatively, you can select any indicator and click onto the Values Editor button on the toolbar.
The Properties of an Indicator
Select any indicator in the list of KPIs. The software will display properties of the indicator below.
General Tab
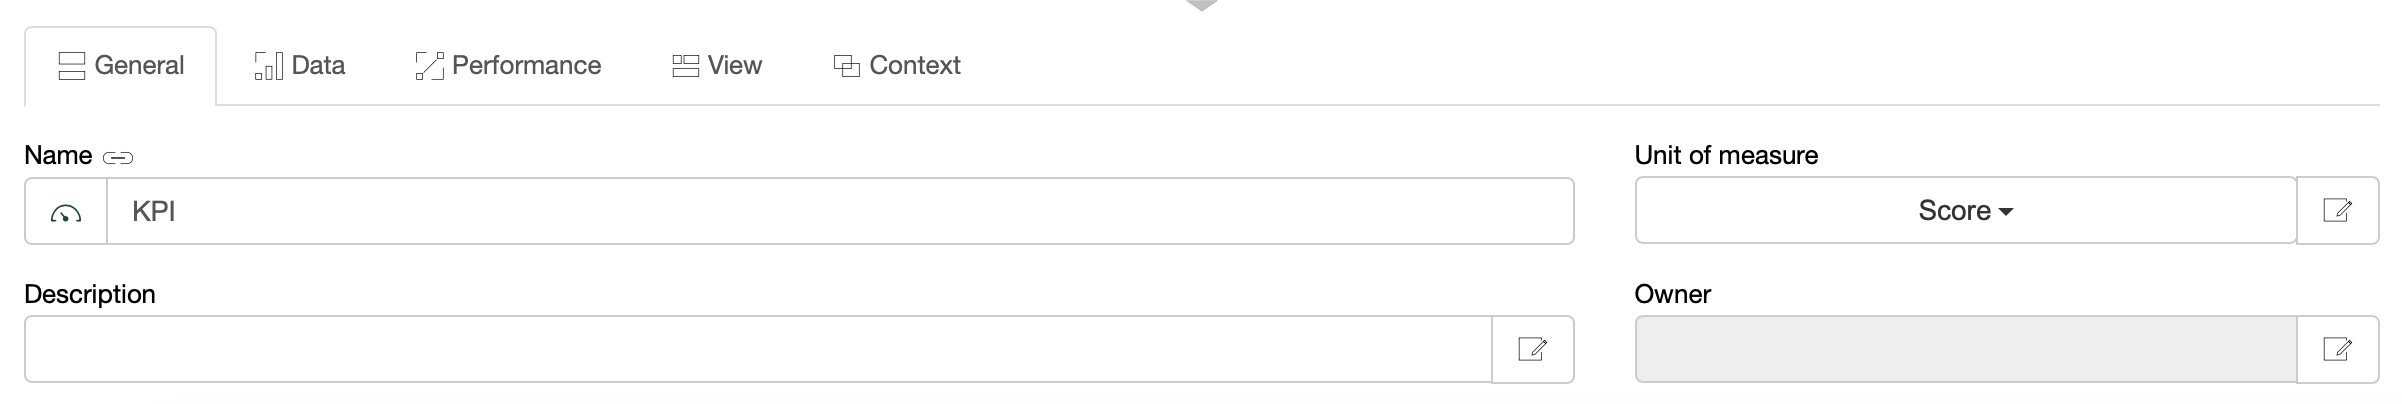
- Name. The name of the KPI. Try to keep it short and meaningful, don't overload it with details, and put the details into the description field.
- Icon. Next to the Name field there is KPI's icon. You can change it by clicking on the icon image.
- Description. The description field is for additional information about the KPI, such as information about the measurement method. Click on the Details button to provide more information using custom KPI files or by uploading relevant documents.
- Measure. Use this list to choose one of measurement units that is applicable to the KPI. If there is no measure that fits your needs click the button on the right from the Measure drop list to add a new measure.
- Owner. The users responsible for this business goal or indicator.
Data Tab
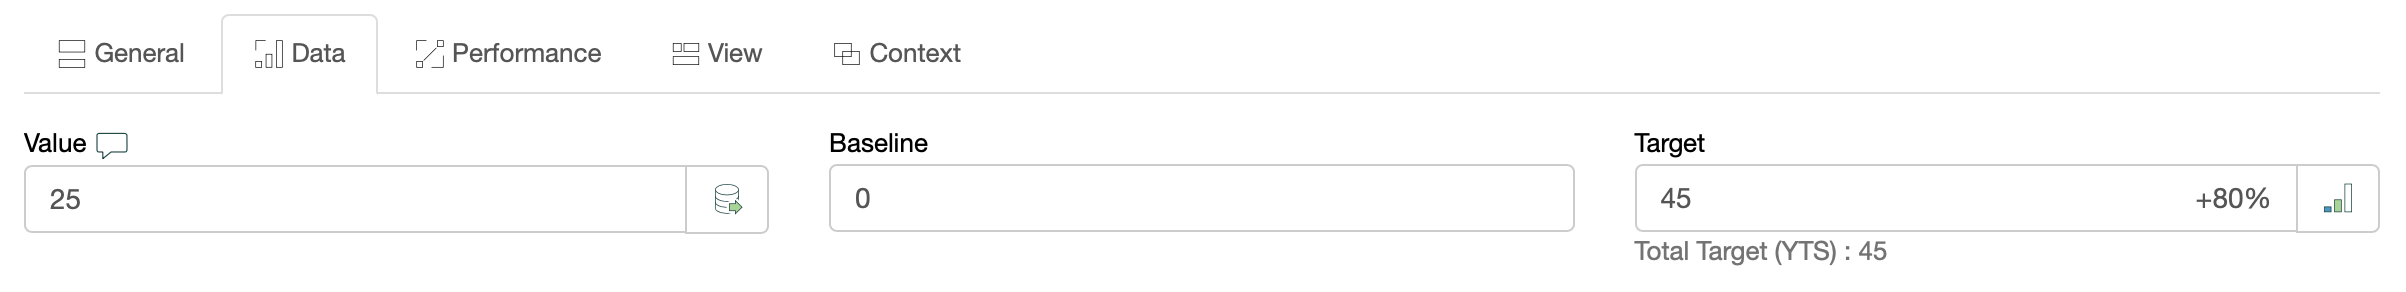
- Value. The value field displays the current value of the KPI for the date selected in the calendar. The button next to the "Value" field allows to create indicators with custom formulas.
- Max and Min values determine the minimum and maximum possible range for a value. Whereas baseline and target values show your working interval. Normally a baseline is a starting value and the target is a value that you wish to achieve.
- Simple input mode. For some indicators the Baseline is always equal to Min value and the Target is always equal to Max value. Check this checkbox and the software will show only the baseline and target fields.
Performance Tab
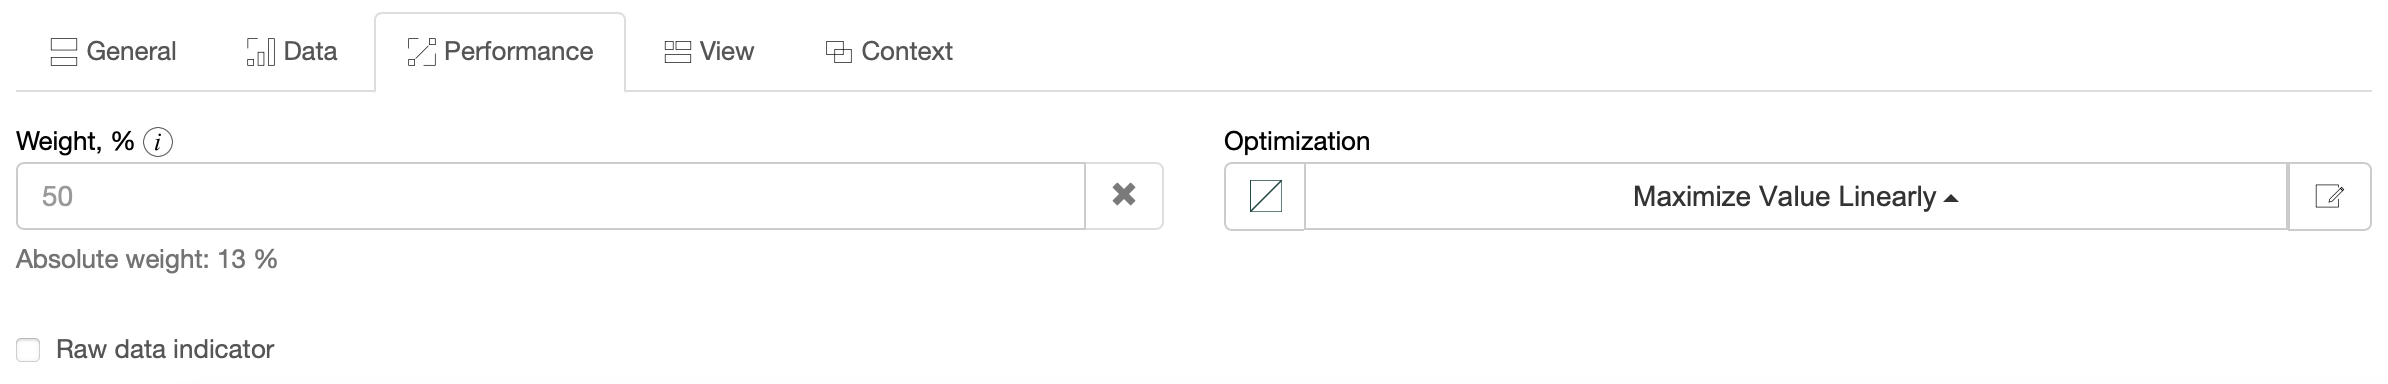
- Weight, %. The relative weight of the indicator shows how this indicator is important compared to other indicators in the same container. The absolute weight shows how this indicator is important compared to all indicators in the scorecard. The weight is taken into account when the performance of the container is calculated. Learn more about indicator's weight.
- Optimization. What do you want to do with the value of a KPI? Would you like to minimize it (for example like a turnover of employees in a company) or you'd like to maximize it (for example profit value). Choose the appropriate optimization. If the dependency is not as simple as just a line function, you can enter a custom formula into BSC Designer that the program will use to calculate your performance and progress. To do this, click on the Edit button next to the Optimization drop list.
- Raw data indicator. Some indicators on the scorecard are just data storages that are not supposed to have a performance or progress. Check this checkbox and BSC Designer won't take this indicator into account when calculating the performance of the scorecard.
View Tab
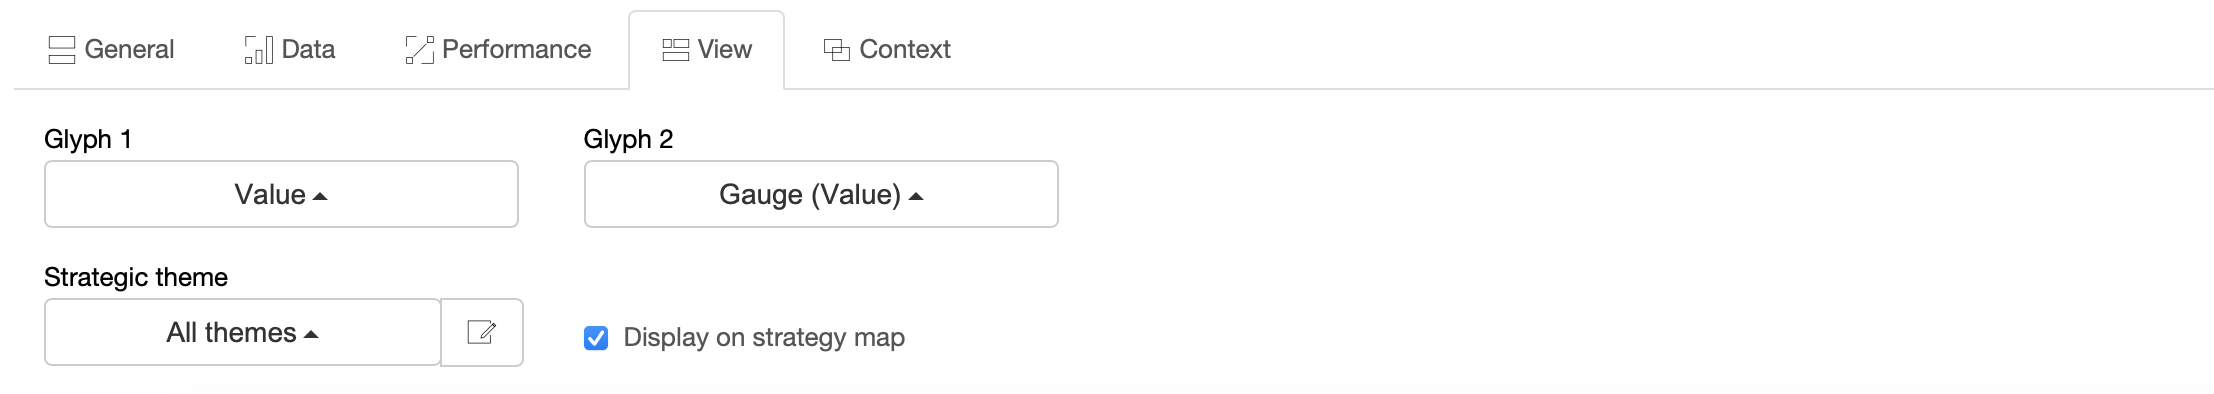
- Glyph 1 and Glyph 2. Glyph settings for the indicator on the strategy map.
- Strategic theme. Select a strategic theme for the item.
- Display on strategy map. Defines whether this item should be displayed on a strategy map.
Context Tab
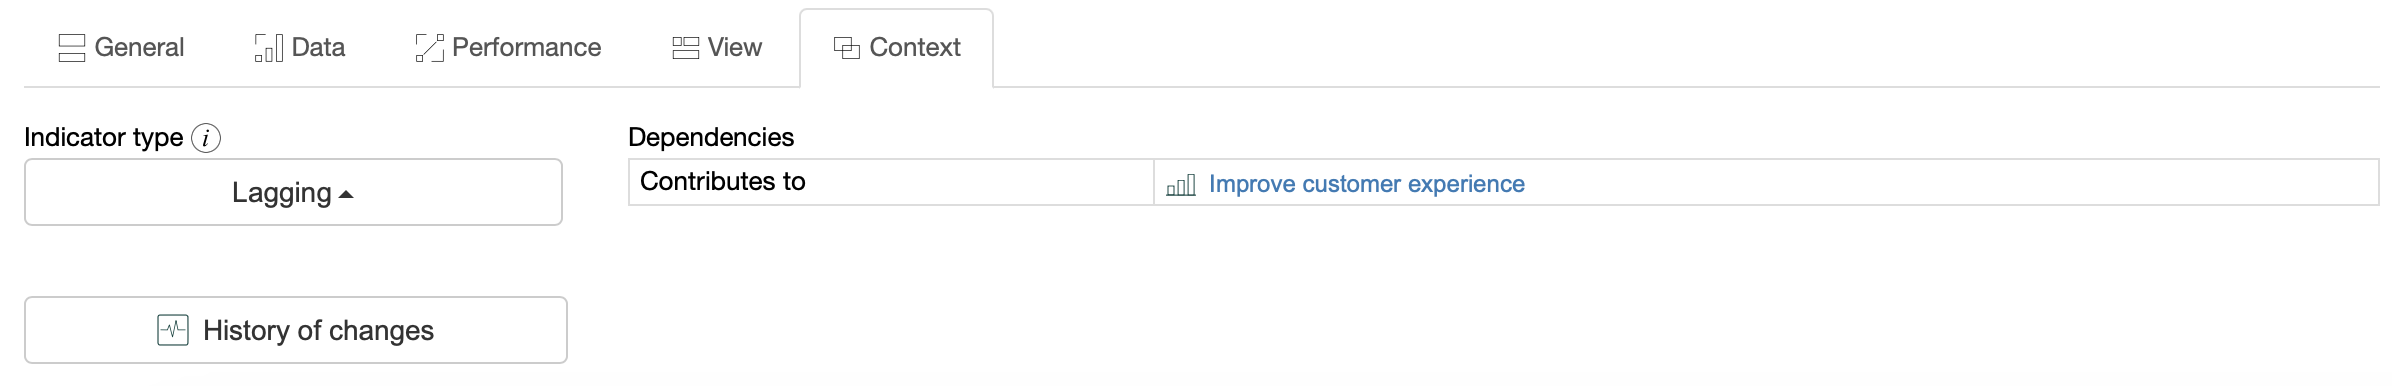
- Indicator type. The type of indicator is defined in the context of its container. Lagging indicators contribute to the calculation of higher level items. Leading indicators are used for local calculations only.
- History of changes. Detailed change log for the item.
- Dependencies. The items that affect or are affected by the selected item.
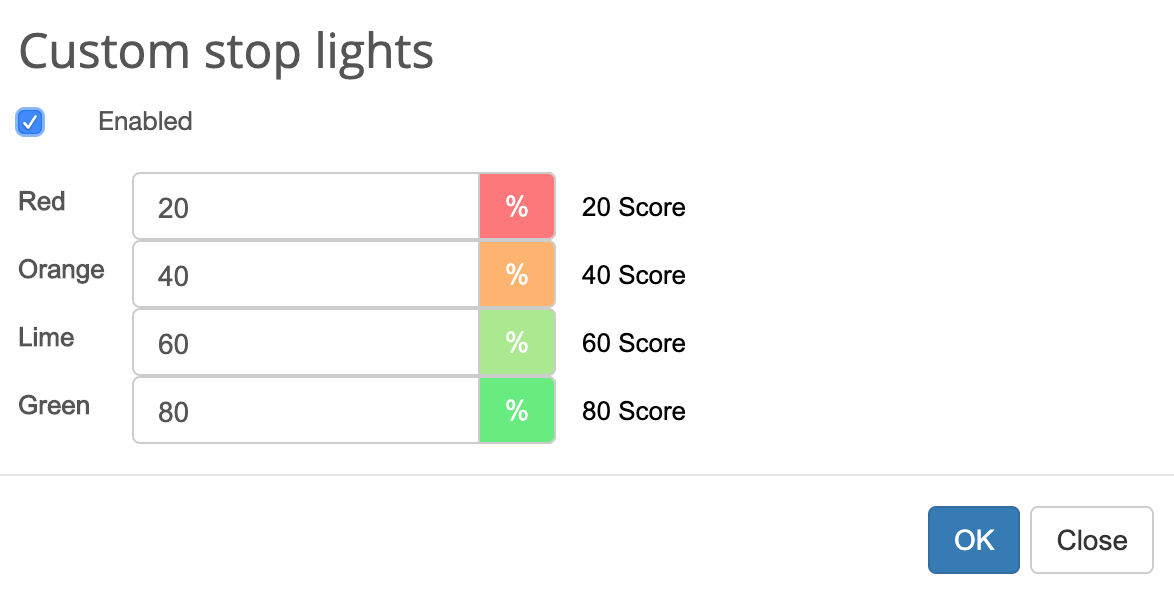
Stop-Lights
Stop-lights are cycles of different colors that are displayed next to the performance and progress values. The stop-lights help to quickly identify the state of the indicators. Stop-light colors can be customized for an indicator:
- Open a scorecard in BSC Designer
- Go to the KPIs tab and select an indicator
- Select Stop-lights settings in Tools menu
- Enter new values for the stop-lights, check the Enabled checkbox and click OK: