What procurement KPIs should the board of directors monitor? What metrics should be on the dashboard of the procurement department to measure and improve their performance?
Part 1. Introduction to procurement
Part 2. Strategy scorecard for procurement
- Financial KPIs and ROI
- Metrics for internal customers
- KPIs for procurement process
- Skills and infrastructure perspective
Procurement Process, Stakeholders, and Goals
Procurement has become an important part of any organization. Not only does it ensure acquisition at a reasonable price and quality, but it also supports risk management and compliance.
In this article, we discuss various Key Performance Indicators (KPIs) for procurement. If you prefer, you can switch to the KPIs part right away, but I would suggest spending a few minutes thinking about the context for those KPIs.
The Stakeholders of Procurement
Let’s start the analysis of the context for procurement KPIs with the stakeholders involved. On the side of organization, those are:
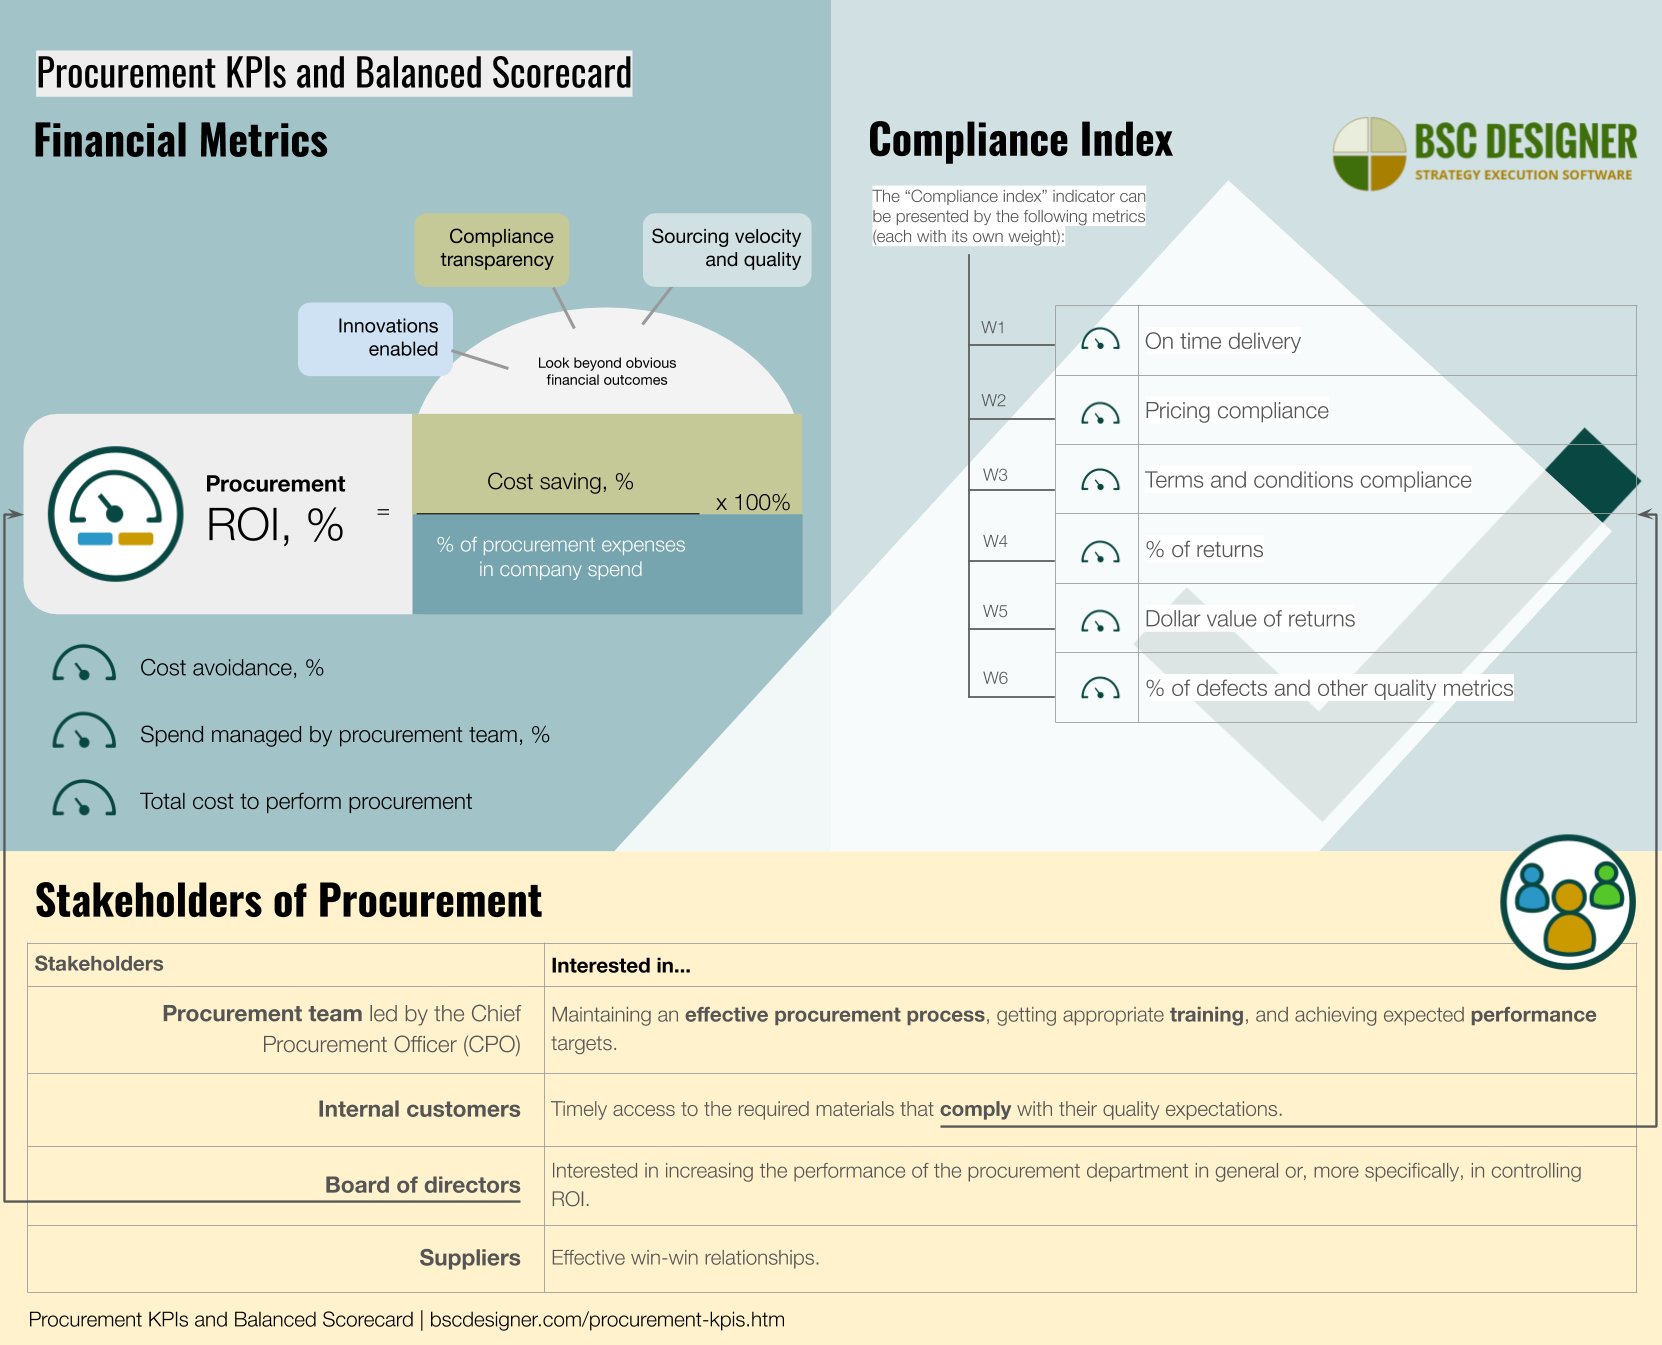
- Procurement team led by the CPO (Chief Procurement Officer). They are interested in maintaining an effective procurement process, getting appropriate training, and achieving expected performance targets.
- Internal customers. Internal customers of procurement are interested in timely access to the required materials that comply with their quality expectations.
- Board of directors. Interested in increasing the performance of the procurement department in general or, more specifically, in controlling ROI. Legal compliance is also among their topics of interest.
Procurement staff manages relationships with suppliers. In some cases, supply chains are under the control of external regulators. Respectively, we need to add two more stakeholders:
- Suppliers. Interested in effective win-win relationships.
- Regulators. Interested in legal compliance.
All these stakeholders have different points of view about what effective procurement should be. Respectively, those ideas can be quantified and measured by different performance indicators.
Procurement Process
Let’s look at the procurement from the viewpoint of the procurement team. What’s a typical process of procurement? It depends on the organization. Normally, we are talking about these five steps:
- Requirements analysis
- Market analysis
- Supplier identification and communication
- Negotiation and contracting
- Performance management (logistics and quality management)
If your main challenge is operational efficiency of procurement, then it’s a good idea to define KPIs around these process steps.
Five “Rights” of Procurement
Another popular perspective to look at procurement is suggested by the Chartered Institute of Procurement and Supply (CIPS). It is called Fiver “Rights.” Those “rights” give us 5 specific control points:
- The Right Quality
- The Right Quantity
- The Right Price
- The Right Place
- At the Right Time
We can use these five attributes of procurement to build a compliance index below.
Challenges of Procurement
Finally, we can look at the procurement from the management’s viewpoints (the board of directors and CPO). What should a procurement strategy be about? What are the key challenges that the procurement department should focus on?
Let’s list the most important goals/challenges:
- Manage company’s acquisition
- Optimize costs, quality, timing
- Manage relationship with suppliers
- Manage risks, for example, by establishing a diverse profile of suppliers (see the coronavirus case as an example).
- Predict spend, identifying anomalies and report
According to the Deloitte report, procurement also plays an active role in:
- New products/market development
- Supporting “make vs. buy” decisions
It’s good practice to build a procurement scorecard around these goals, instead of just copying a long list of KPIs.
Procurement Scorecard
Now, let’s put together the goals, processes, and stakeholders discussed above to build a strategy scorecard for procurement. For this purpose, we’ll follow the four perspectives model of the classical Balanced Scorecard:
- Financial perspective
- Customer perspective
- Internal processes perspective
- Skills and architecture perspective
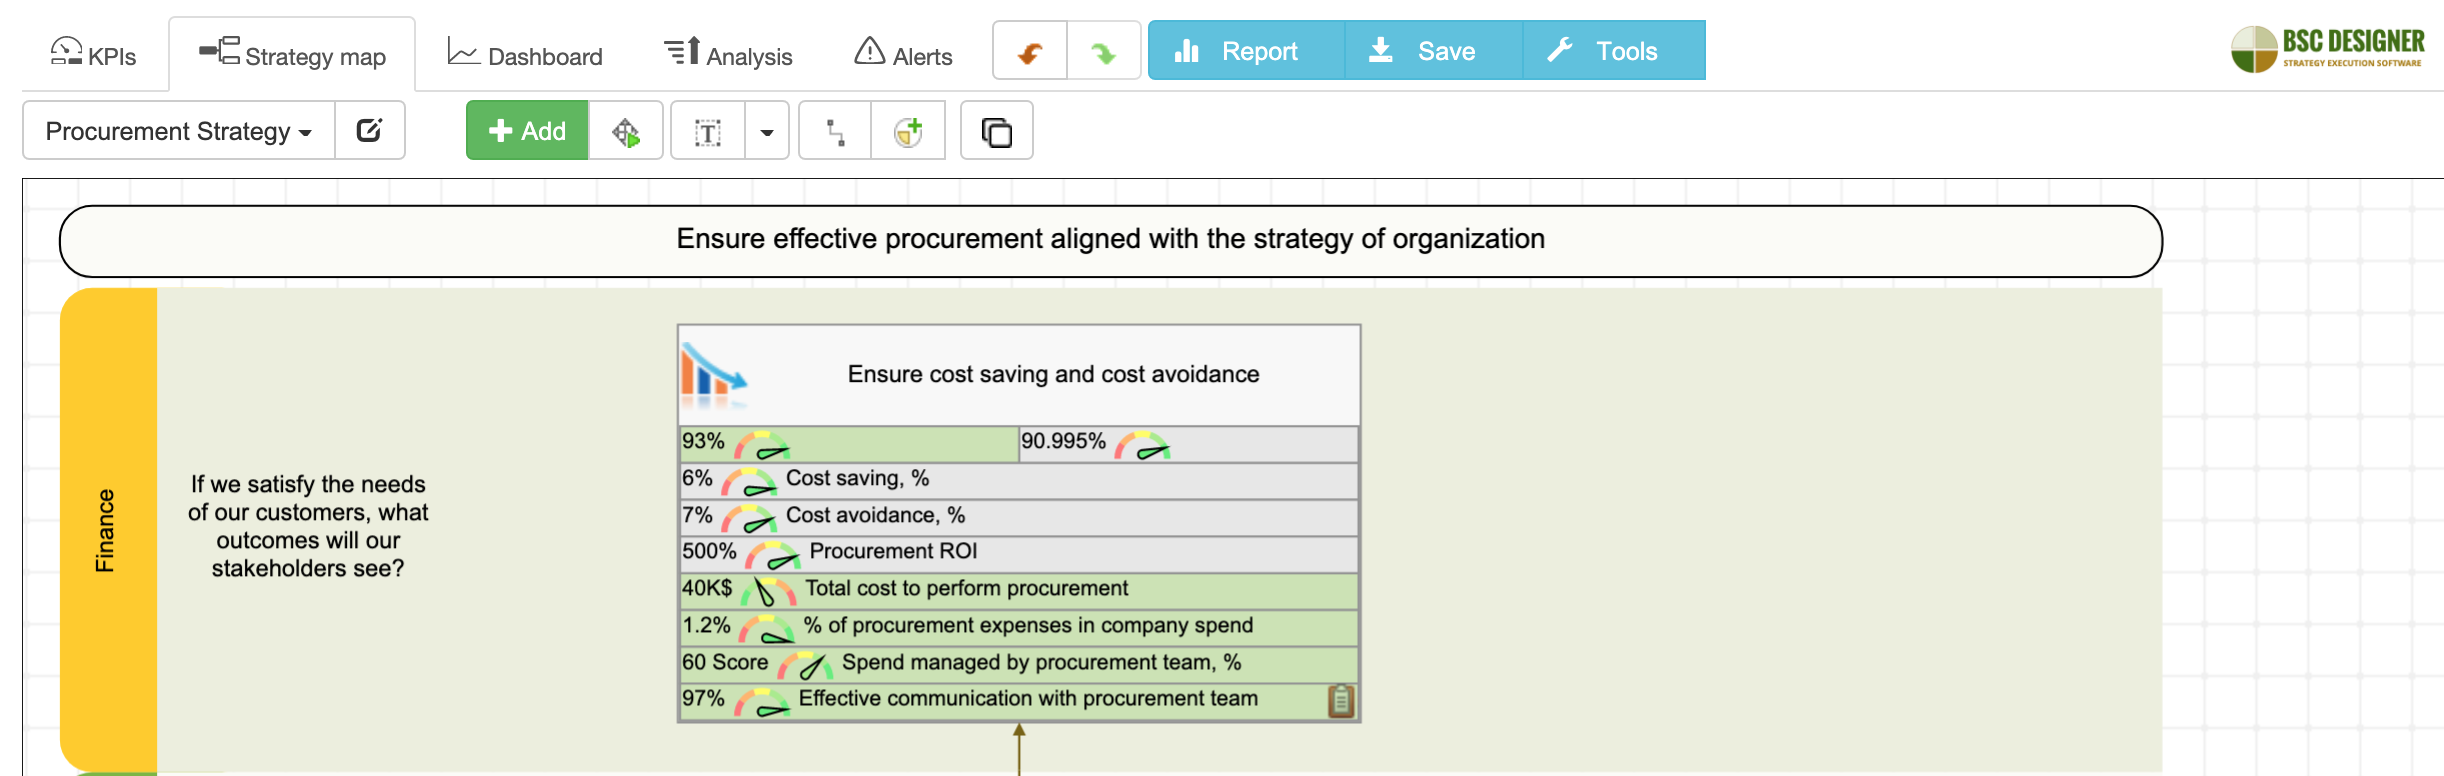
I’ll use BSC Designer software to automate this scorecard. Users of BSC Designer will find the procurement template available in their accounts. If you are not a user yet, you can sign up with a free plan.
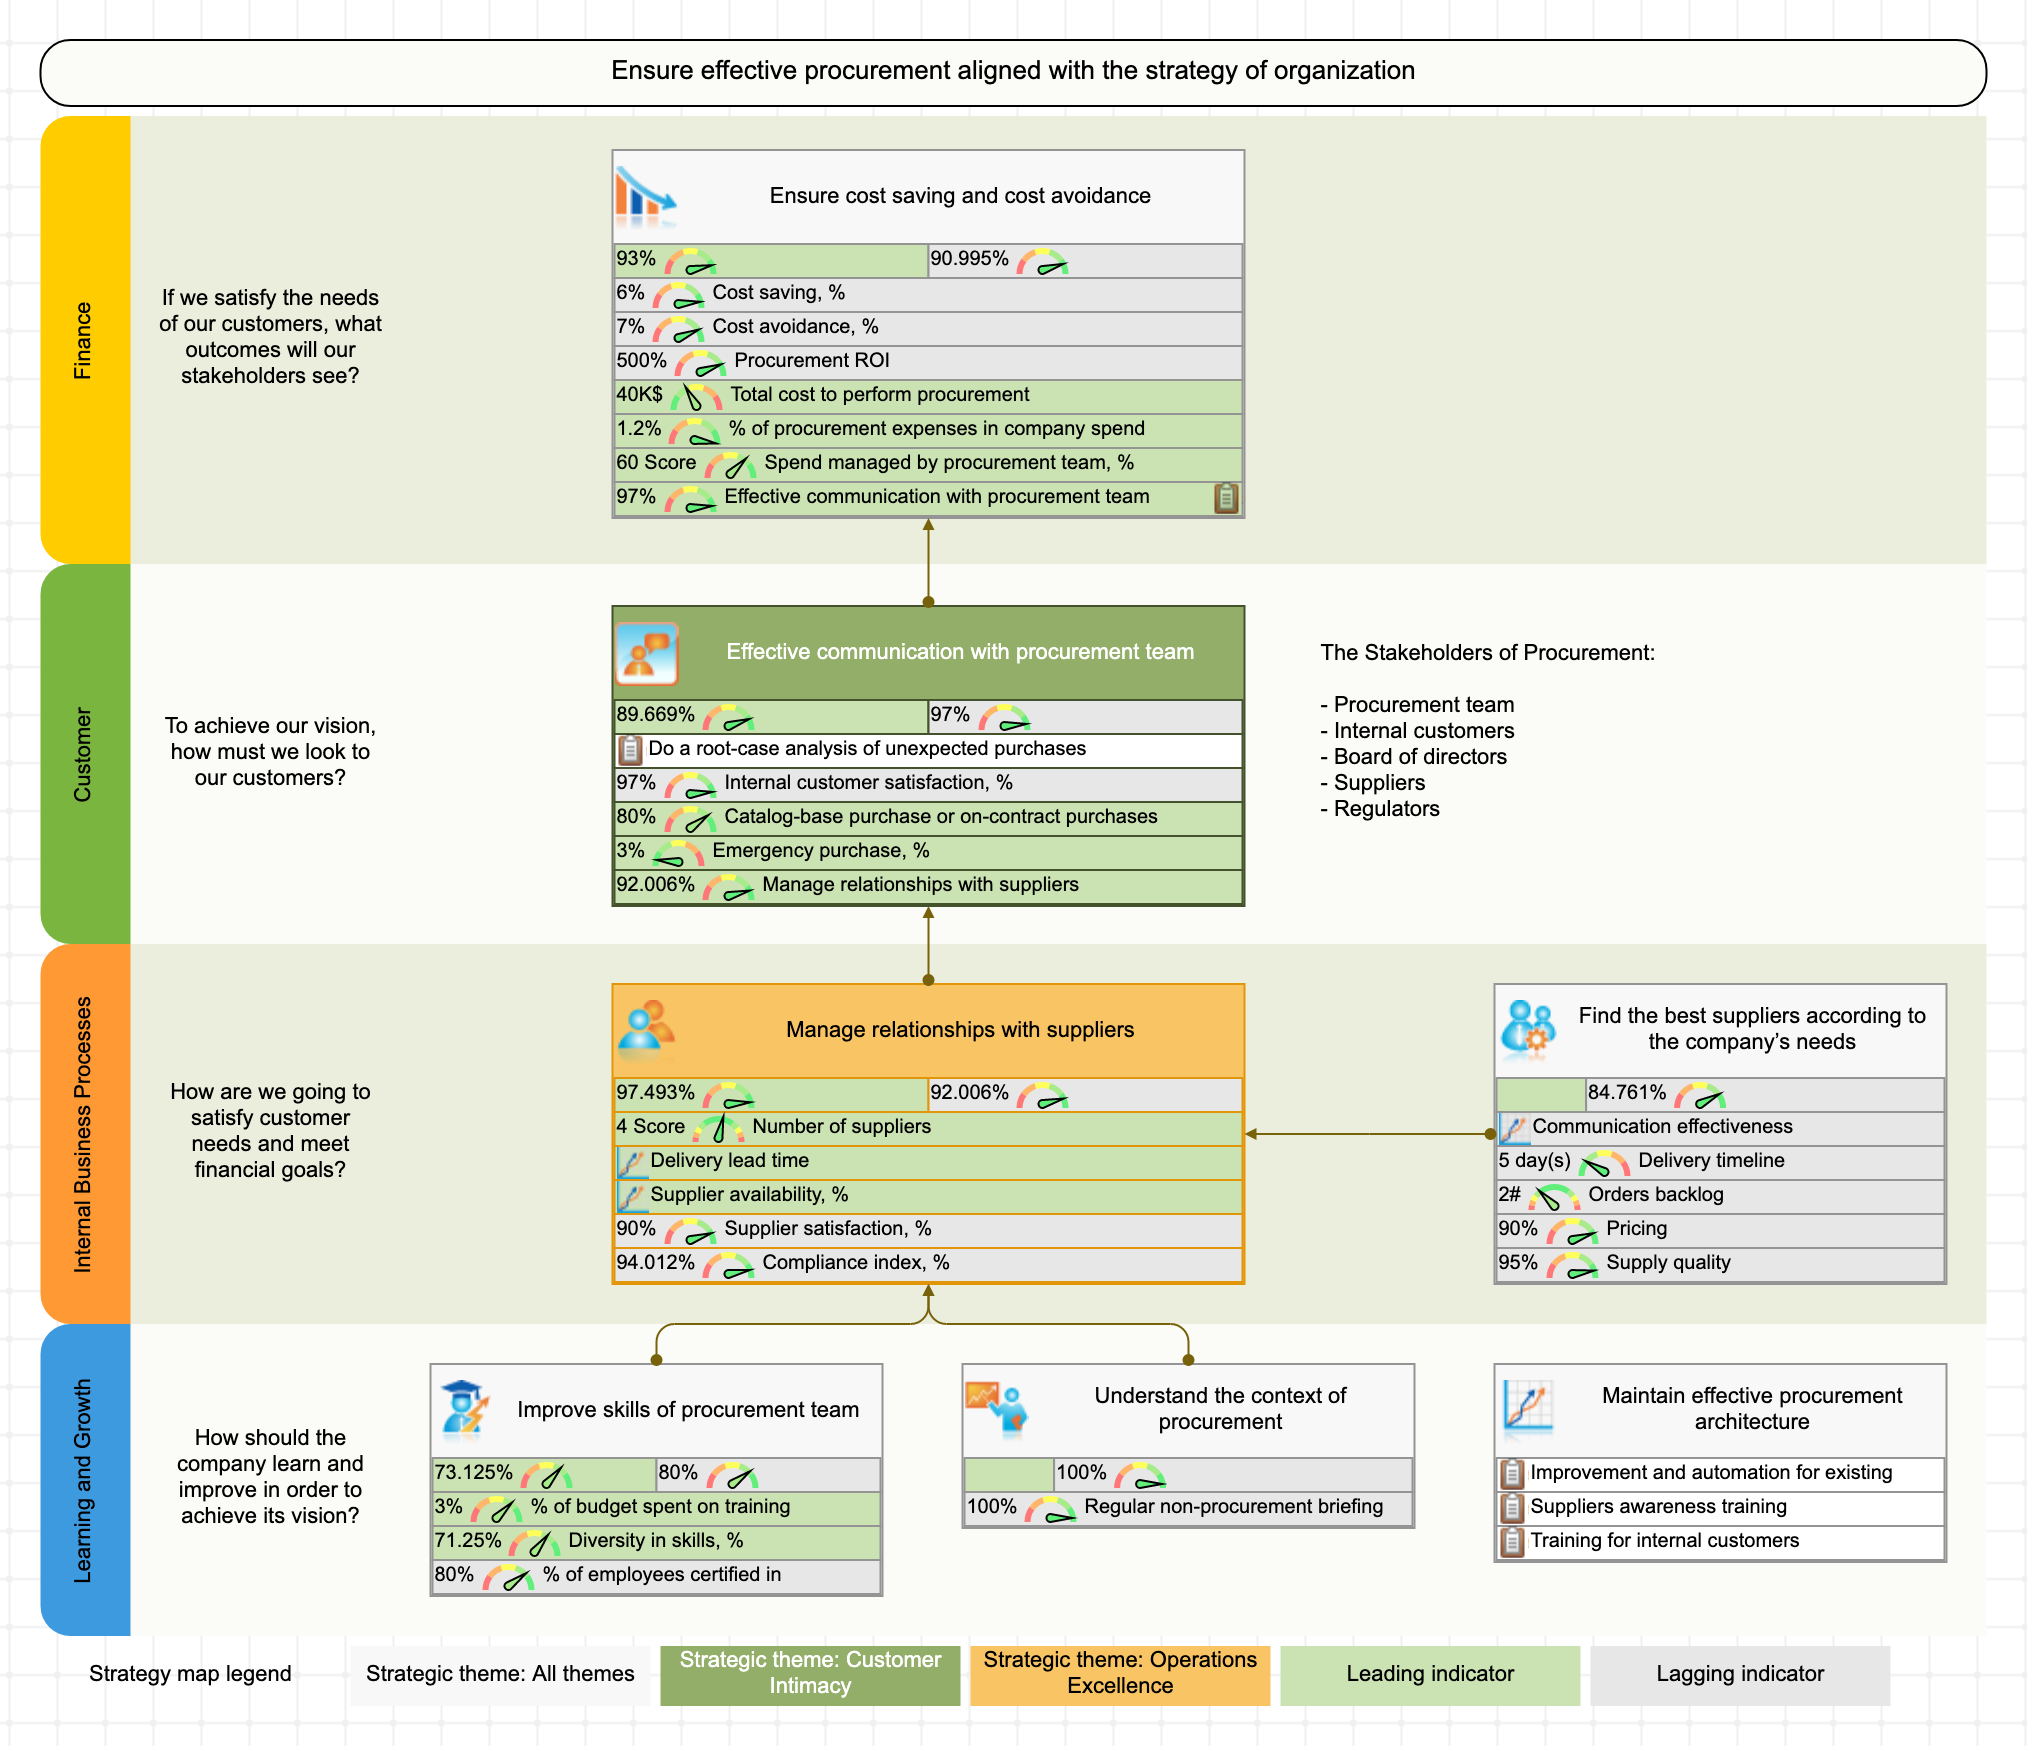
A mission statement for this case can be formulated as: “Ensure effective procurement aligned with the strategy of organization.”
Financial Metrics for Procurement
The top-level financial goal of the procurement department can be formulated as:
- Ensure cost saving and cost avoidance
The main financial metrics for procurement are:
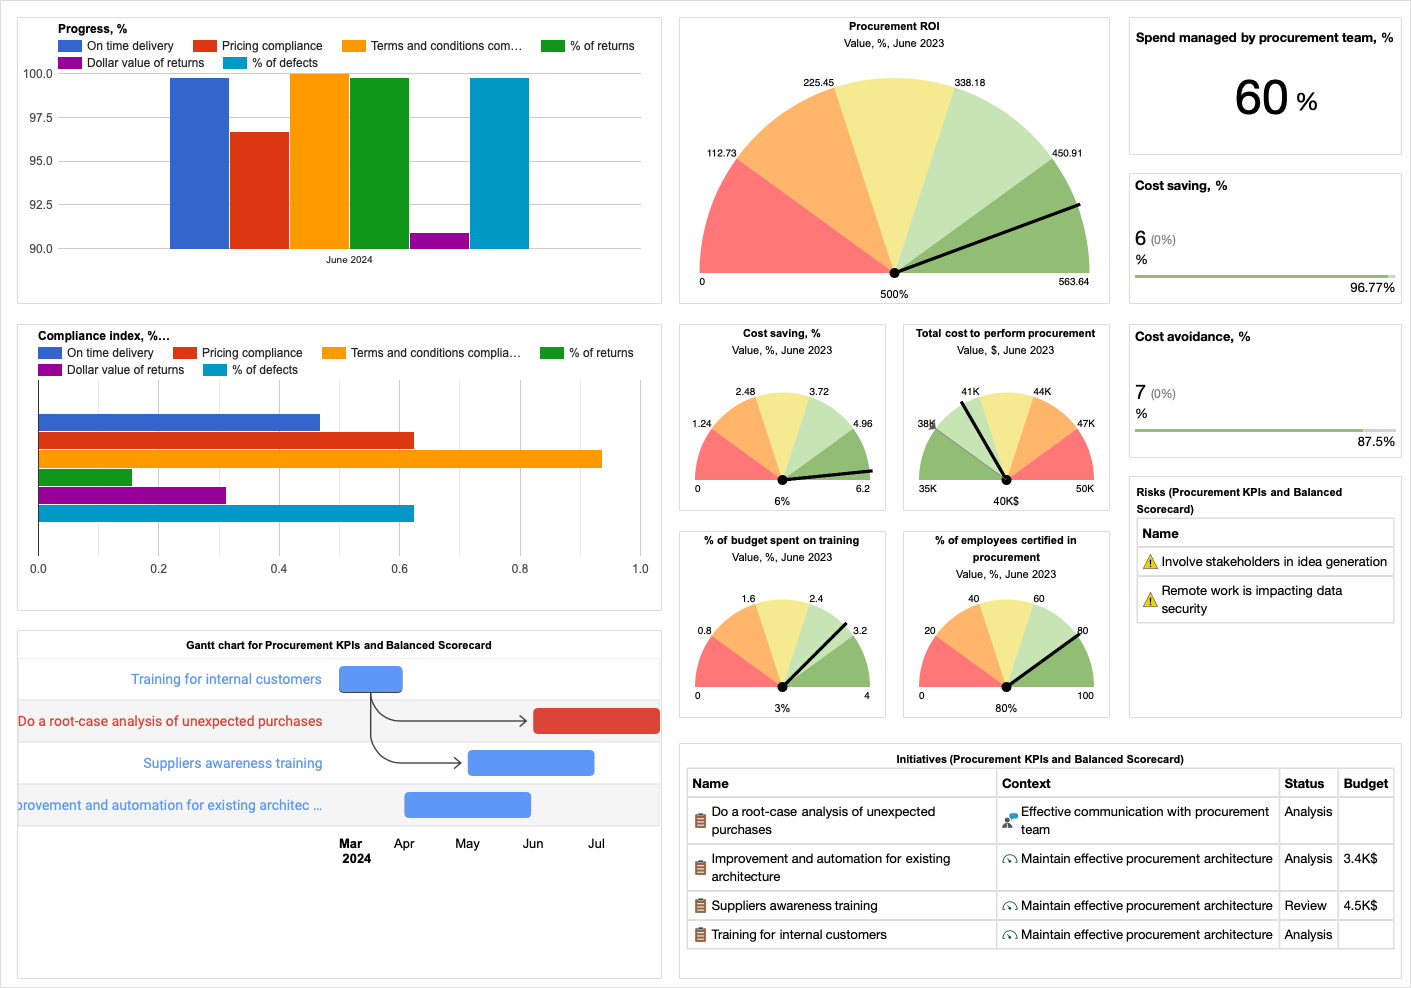
- Cost saving, % measured as saving in the cost reduction as a percentage of total spend. According to the report by Ardent1, an average benchmark for cost saving is around 7.5%.
- Cost avoidance, % similar to cost saving, cost avoidance refers to saving future costs.
What costs should be taken into account? According to the Deloitte report2, the most popular cost saving metric is operational expenses saving metric (“OPEX savings”) that is used by 74% of survey respondents. Followed by capital expenses saving metrics (“CAPEX savings”) used by 63% of the companies.
We also need to know the costs to perform procurement. These costs are formed by:
- Staff salaries, training costs, and similar
- Infrastructure and technology investment
As for the metrics, we can look at these two metrics:
- Total cost to perform procurement
- % of procurement expenses in company spend. According to the Ardent report, the benchmark for this metric is below 1%.
We have discussed the cost saving and the expenses part of procurement. Another good question to ask is whether the company utilises the procurement department efficiently.
To answer this question, we can monitor:
- Spend managed by procurement team, %. Percentage of total company’s spend managed by the procurement team.
The benchmark for this metric will depend on your industry. The average estimate from the Ardent report is 63.2%.
ROI of Procurement
The ROI of the procurement department is one of the key indicators that CPO/CEO and the board of directors would like to see on the corporate governance dashboard.
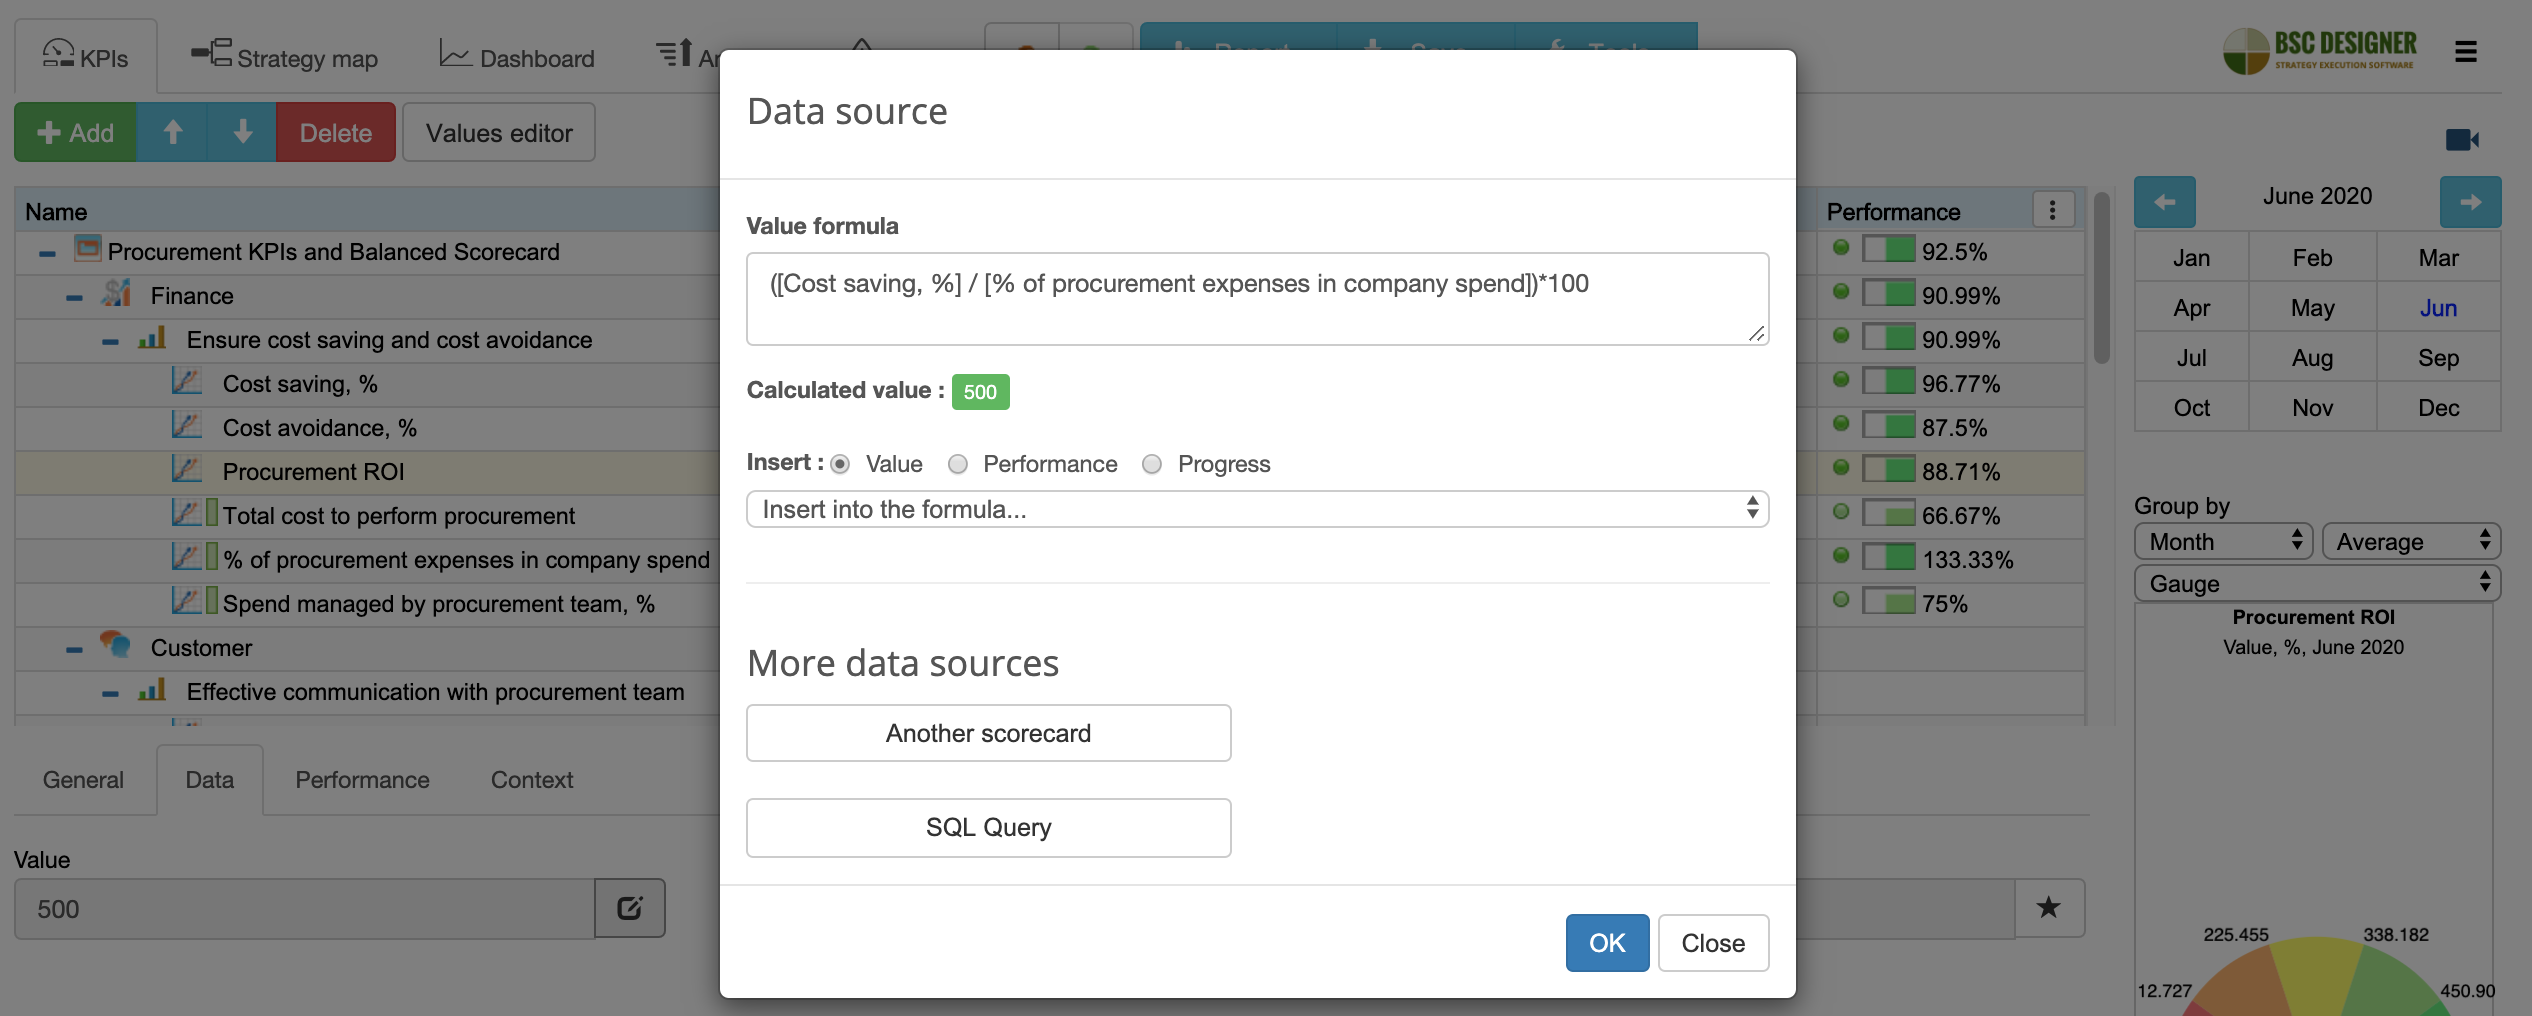
A starting point is the basic profitability of procurement:
- Procurement ROI = (Cost Saving / Total Cost to Perform Procurement ) * 100%
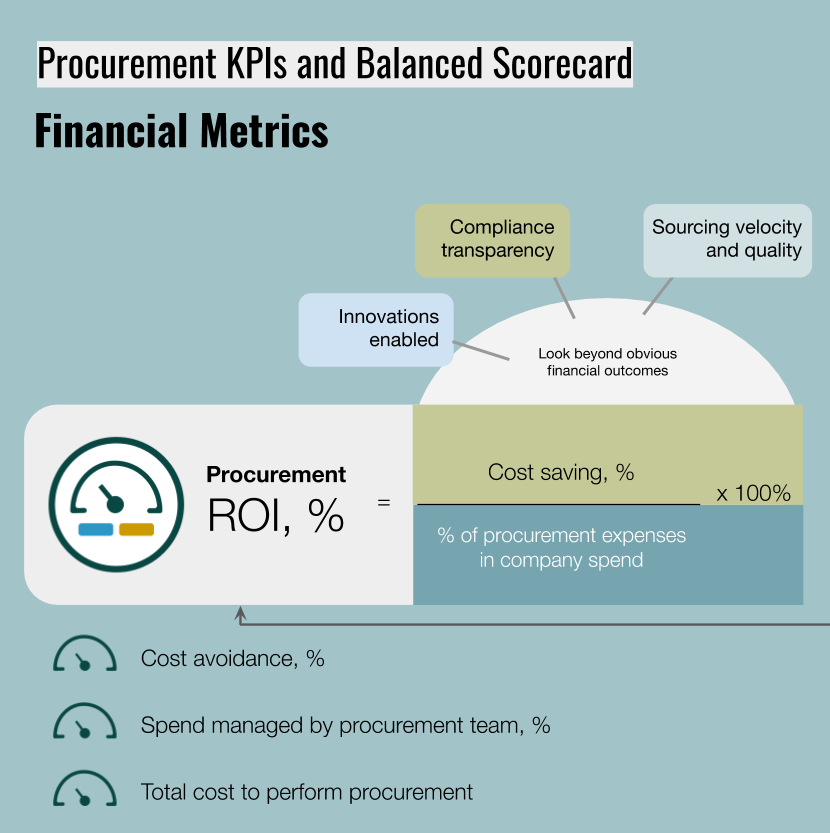
A more comprehensive approach would be to look beyond obvious financial outcomes. We could find a dollar equivalent of the benefits obtained as a result of:
- Innovations enabled (ideally, it should be aligned with the metrics from the innovation scorecard)
- Compliance transparency
- Sourcing velocity and quality
KPIs for Internal Customers
The procurement department deals with suppliers to satisfy the needs of internal customers.
What are the needs of the internal clients? We can formulate them in the form of this goal:
- Effective communication with procurement team
How to quantify this goal? To quantify procurement as seen by the internal customers, we can use this simple metric:
- Internal customer satisfaction, %
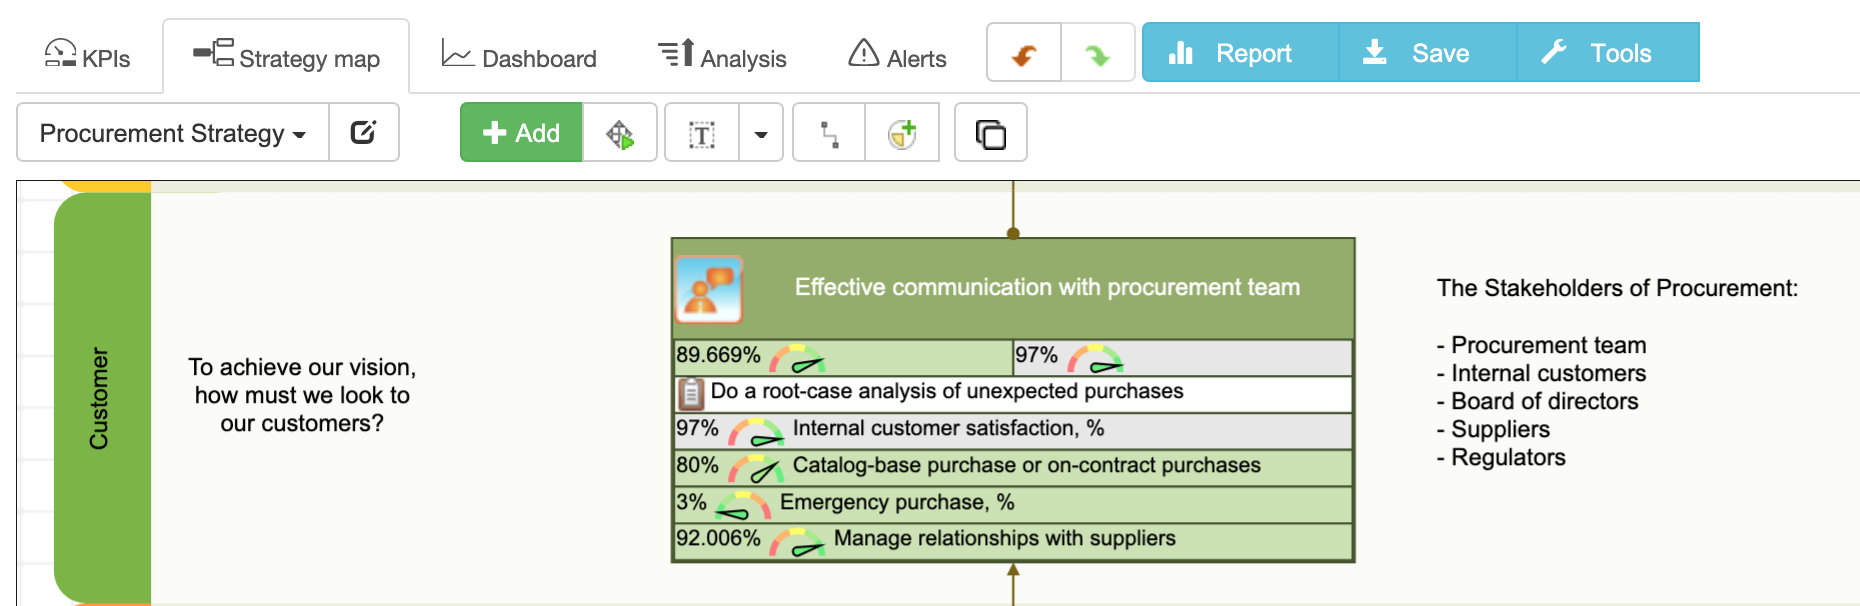
From the viewpoint of the procurement team, effective communication can be quantified as:
- Catalog-base purchase or on-contract purchases
- Emergency purchase, %
Off-contact and emergency purchases imply higher costs. It’s important to use these metrics to understand the cost difference and the reasons for the off-contract purchase.
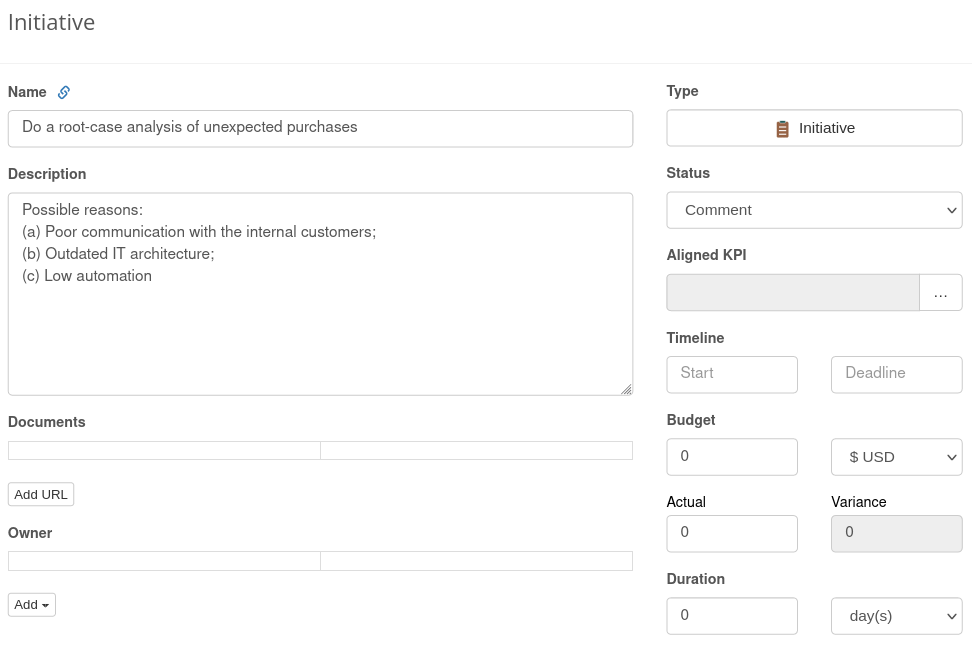
We can formulate this idea as an initiative:
- Do a root-case analysis of unexpected purchases
Among reasons we might find:
- Poor communication with the internal customers
- Outdated IT architecture
- Low automation
KPIs for Procurement Processes
What about the business processes inside the procurement department?
A general goal, in this case is:
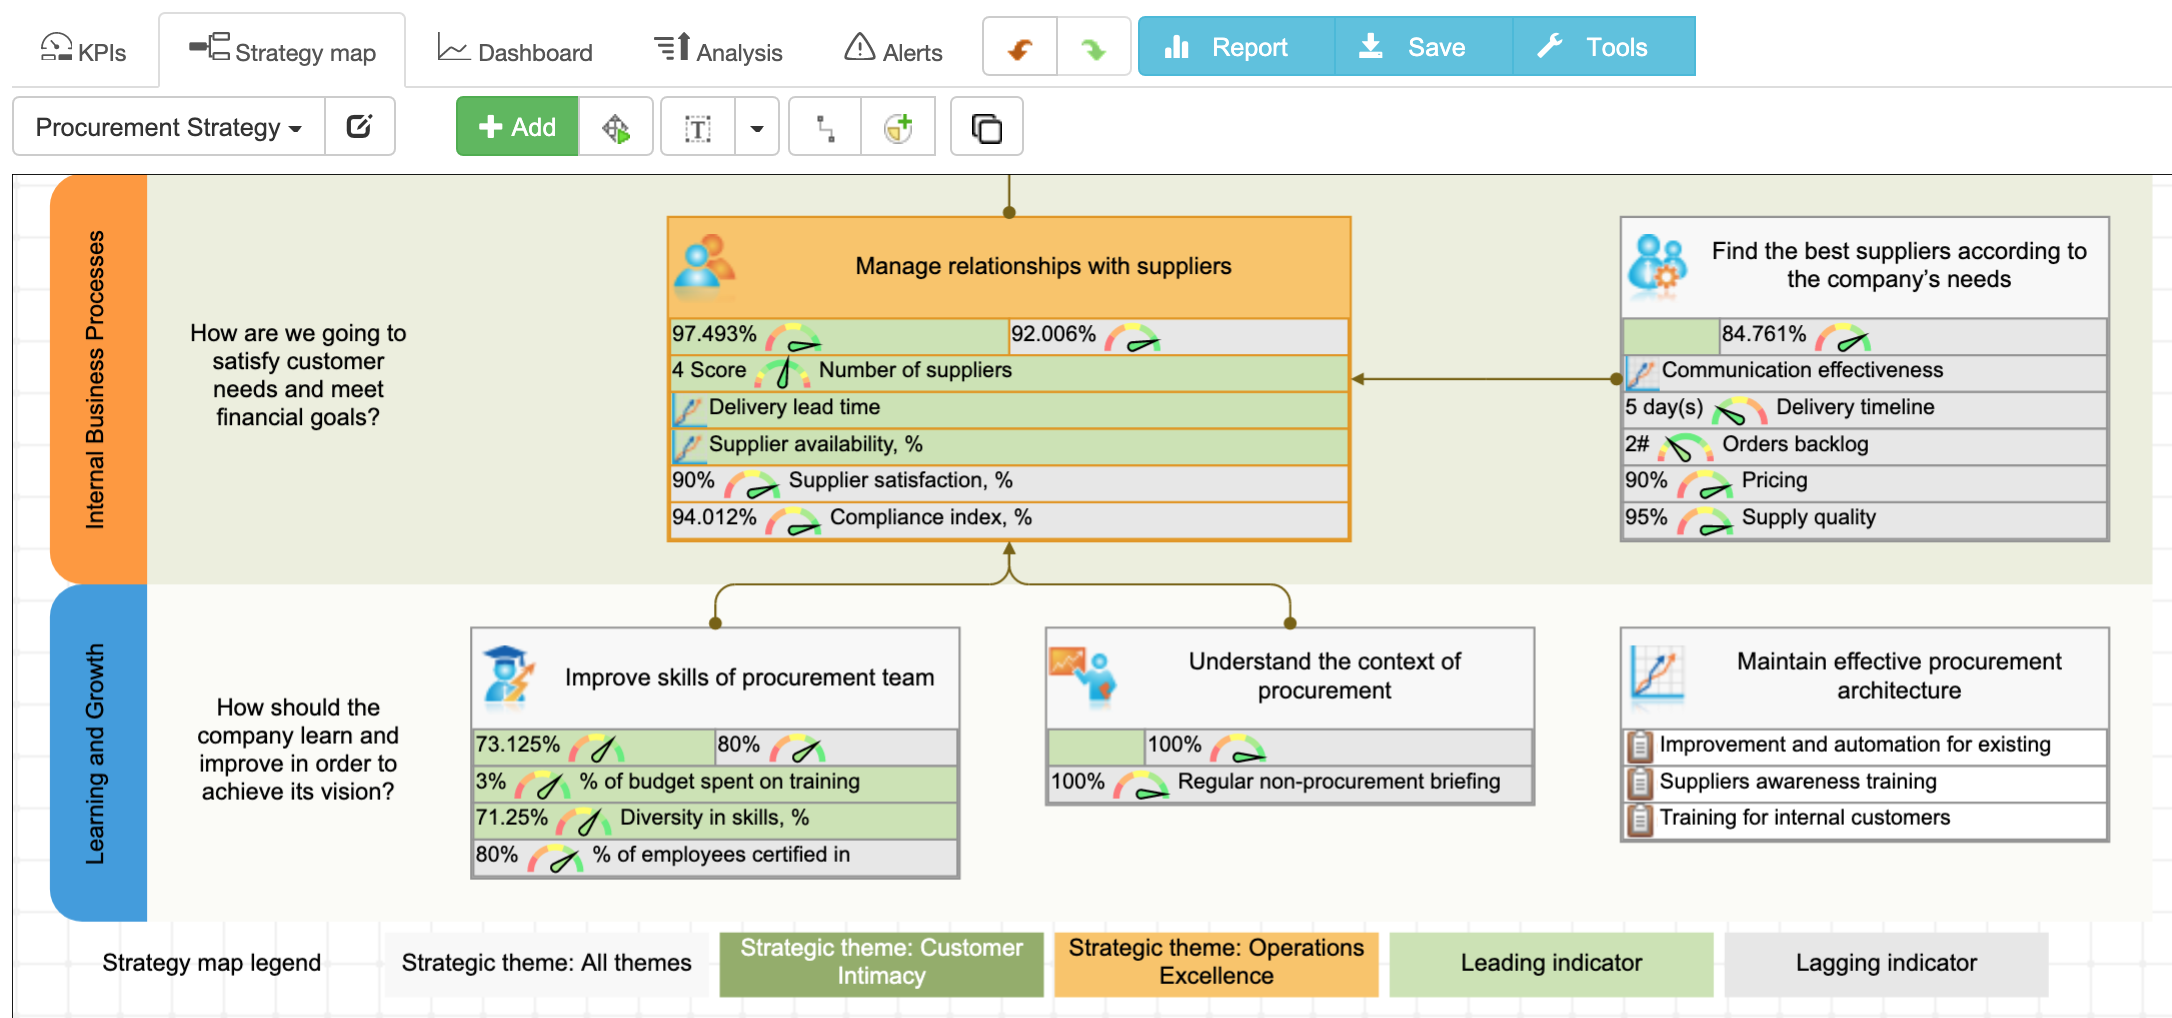
- Manage relationships with suppliers
This goal can be quantified by the following metrics:
- Number of suppliers. High number results into unnecessary managerial costs, low number of suppliers imply the risk of dependency.
- Delivery lead time. Total time to complete an order. This can be further developed in the time needed to discuss details, process payment, obtain goods.
- Supplier availability, %. Similar to the lead time indicator, but in the case of availability, we are focusing on the ability of the supplier to address emergency orders.
- Supplier satisfaction, %
- Compliance index, %. Shows if the deliveries from suppliers comply with established terms.
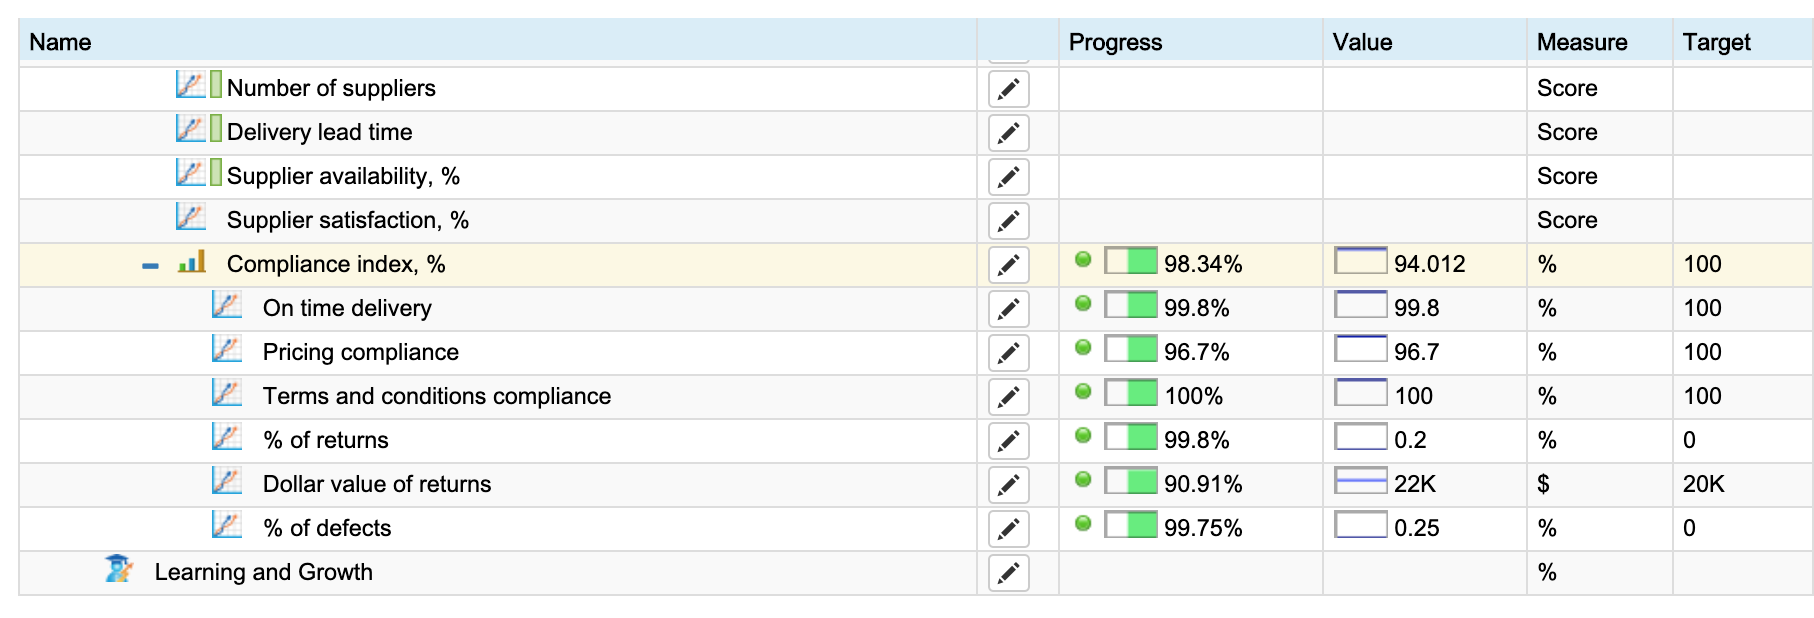
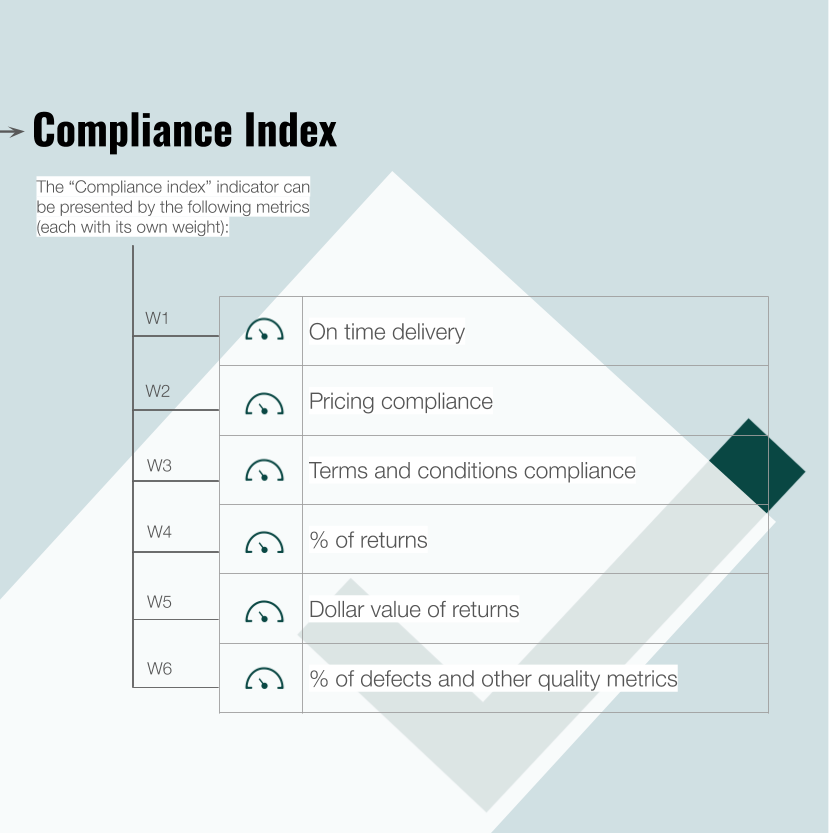
The “Compliance index” indicator can be presented by the following metrics (each with its own weight):
- On time delivery
- Pricing compliance
- Terms and conditions compliance
- % of returns
- Dollar value of returns
- % of defects and other quality metrics
Automation software, such as BSC Designer, will calculate the value of the compliance index automatically using the information about the weight and the performance of the metrics inside the index. If you are not using specialized software, calculations of weight can be easily reproduced in spreadsheet tools.
Another typical challenge of the procurement department is to find reliable supply partners. Let’s formulate the goal for the strategy map as:
- Find the best suppliers according to the company’s needs
A simple evaluation scorecard can be built from these metrics:
- Communication effectiveness. In another article, we have discussed how to quantify quality of communication.
- Delivery timeline and orders backlog – will show how well the supplier is managing incoming orders.
- Pricing. One option is to compare prices from different suppliers quantitatively, or you can focus on pricing competitiveness, e.g. compare pricing qualitatively.
- Supply quality. Quality is a broad concept that goes far beyond the obvious “number of defects.” To quantify quality, I would suggest using a separate quality scorecard.
In some cases, it’s also a good idea to look at the inventory and its availability for the internal customers. A key metric in this case is:
- Inventory accuracy, % Can be measured as ((Inventory According to Records / Physical Inventory) * 100).
If your organization requires a large inventory, then having a separate warehouse scorecard is a good idea.
Metrics to Quantify Skills and Infrastructure
Procurement business domain is involved in many technological and talent trends. In this part of the strategy scorecard, we are focusing on the learning and growth goals for the procurement department.
Goal:
- Improve skills of procurement team
Metrics (leading):
- % of budget spent on training. According to the report by Deloitte, the benchmark for this metric varies from less than 1% to about 4%.
- Diversity in skills, %. This metric ensures that the procurement talents pass a comprehensive training program. Learn more about formulating diversity and inclusion strategy.
Metric (lagging):
- % of employees certified in procurement. % of staff certified in procurement out of the total number of procurement staff.
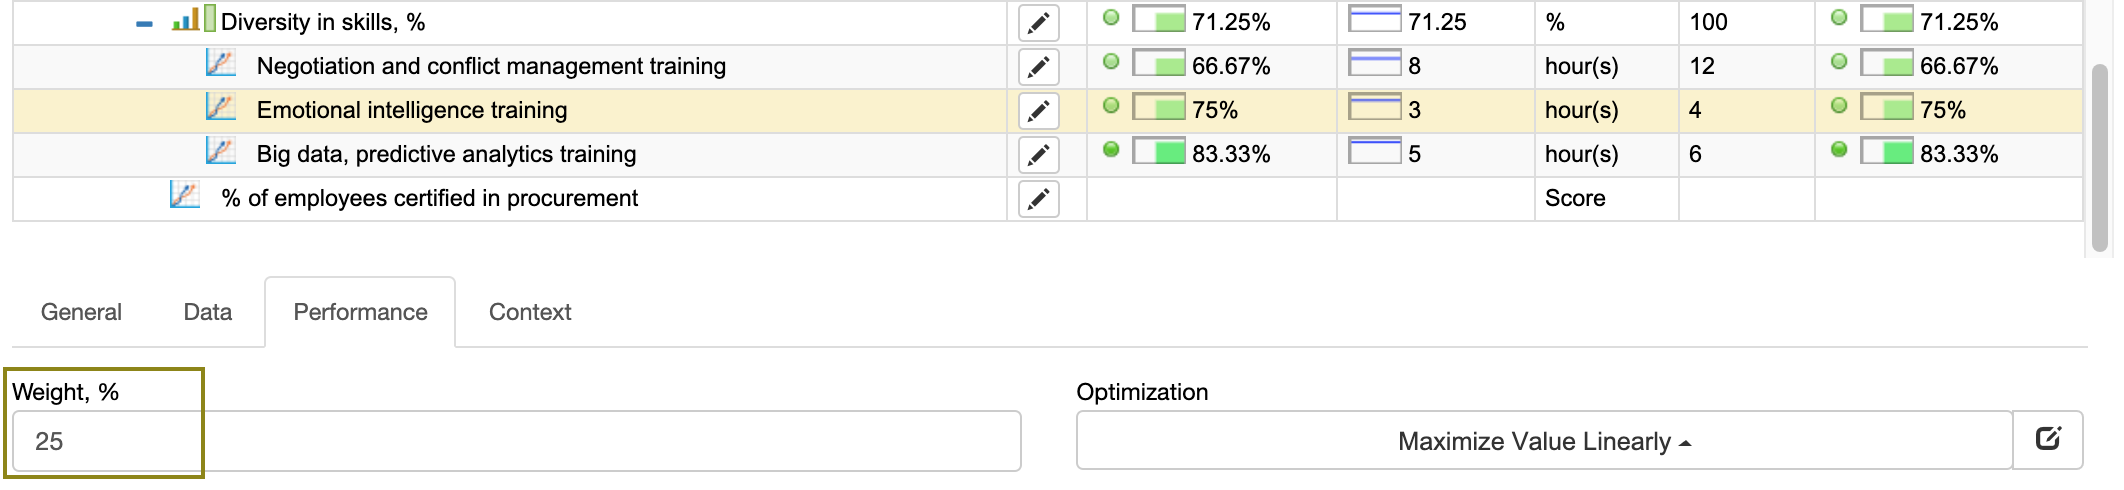
The leading metric “Diversity in skills, %” is an index indicator that can be calculated by the following metrics:
- Negotiation and conflict management training, hours
- Emotional intelligence training, hours
- Big data, predictive analytics training, hours
In the procurement scorecard template, each of these metrics can have its own weight and performance. For example, we can assign a weight of 25% of “emotional intelligence training,” while the “analytics training” will come with a weight of 15%. Using this data, the software can calculate the total skills diversity index.
If the training of procurement talents is your primary focus, then I’d recommend aligning the procurement scorecard with a training scorecard, which implemented the four levels model.
Let’s move ahead with other learning goals. The next goal can be formulated as:
- Understand the context of procurement. Effective procurement depends a lot on understanding a company’s strategy, business environment, competition, and customer-related trends.
A simple initiative, in this case, is to provide the procurement team with access to the PESTEL analysis results. For example, this can be delivered in the form of a regular briefing.
Metric:
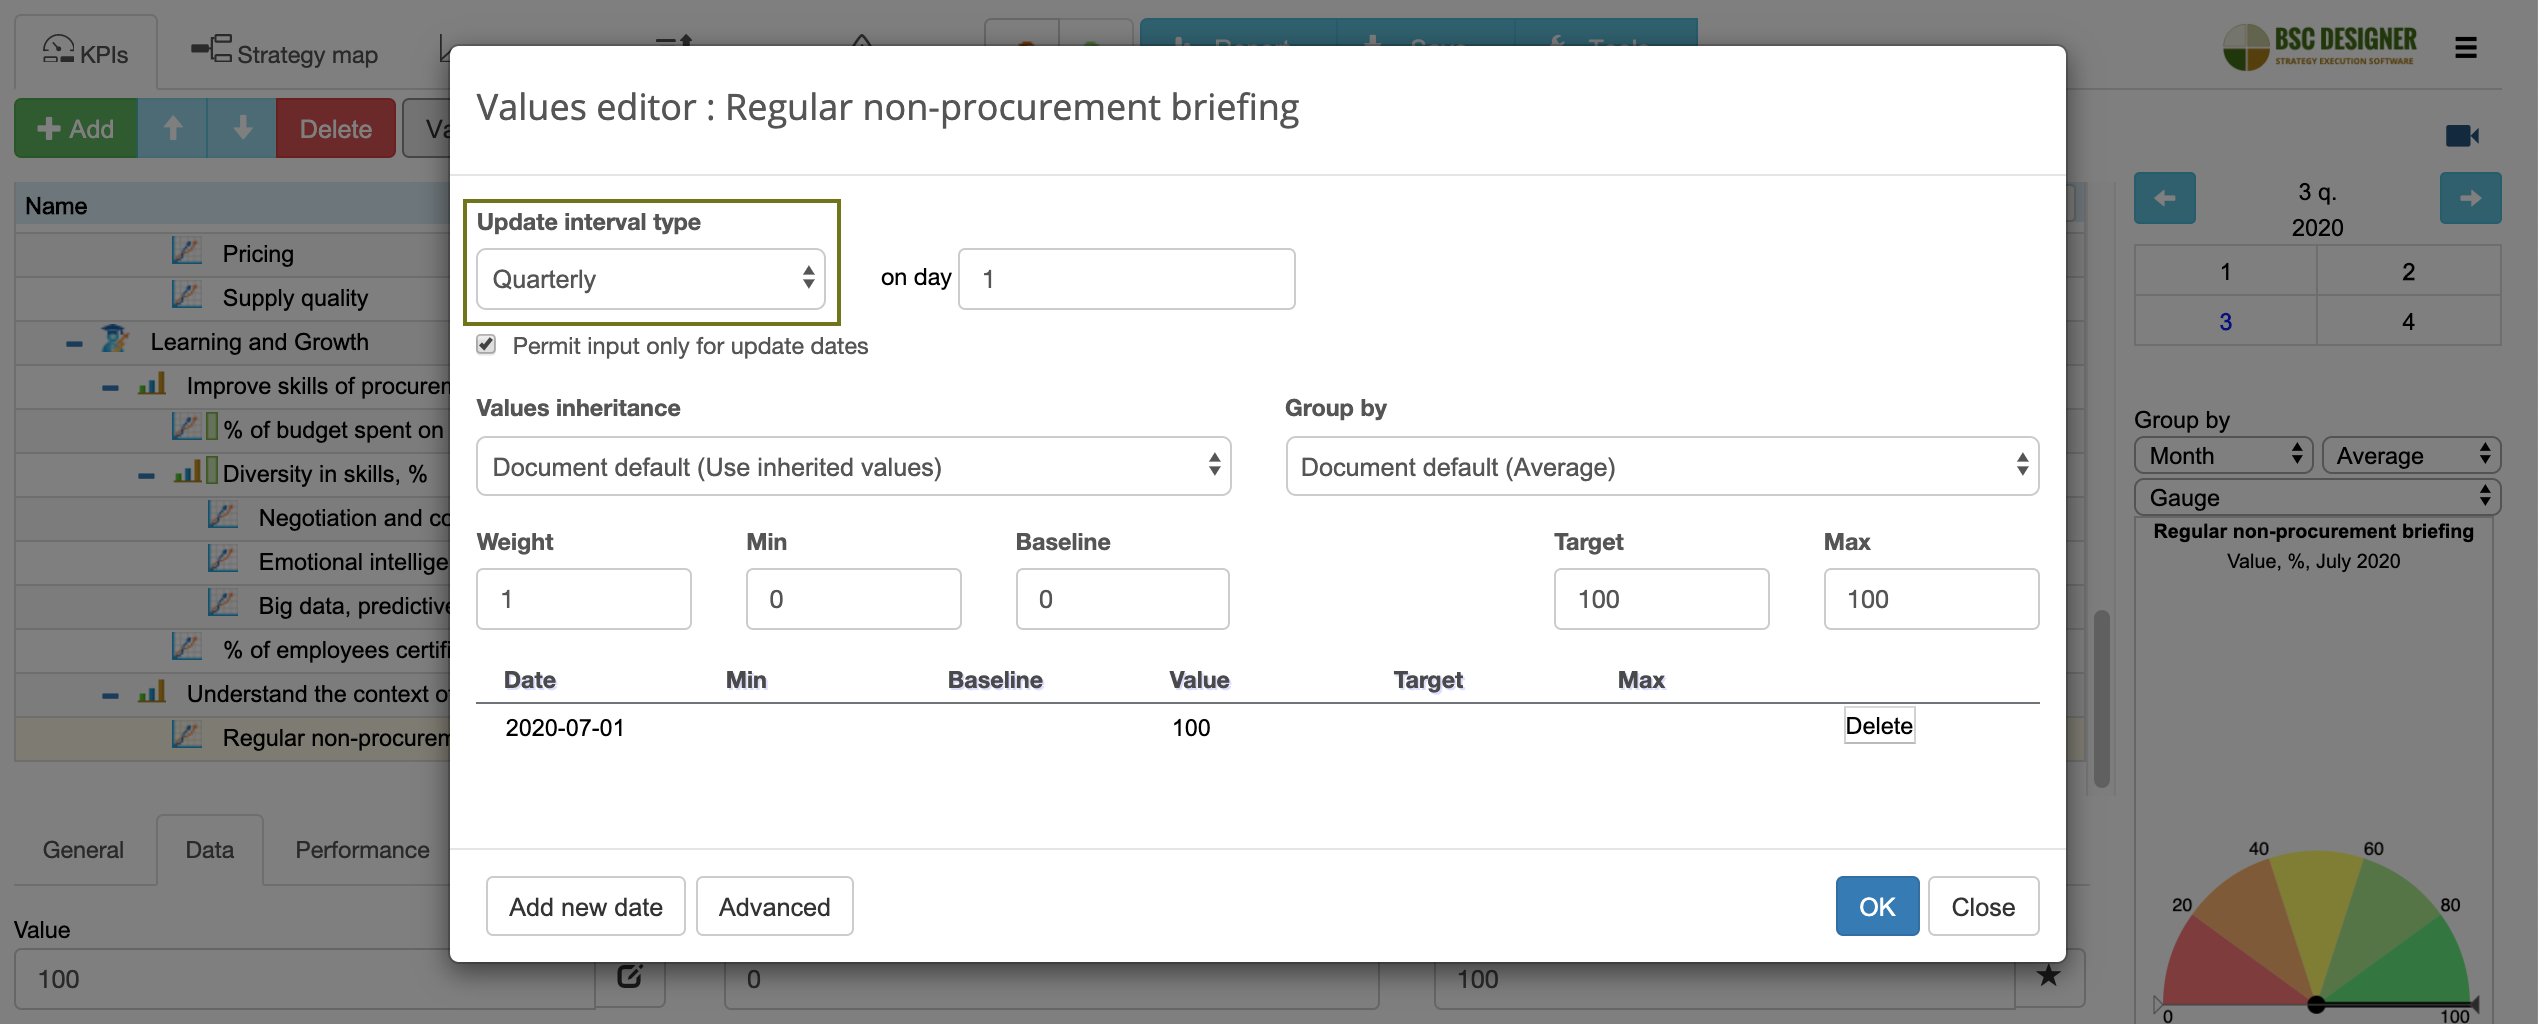
- Regular non-procurement briefing [update interval = quarterly]
To automate this metric, we can specify the update interval for this indicator. For example, it can be set to “quarterly.” Additionally, we can configure the software to remind the person responsible for the need to do a briefing.
Finally, CPO should focus not only on the operational challenges but on the strategic goals. One of them can be formulated as:
- Maintain effective procurement architecture
The relevant initiatives, in this case, can be:
- Improvement and automation for existing architecture
- Suppliers awareness training
- Training for internal customers
Summary
In this article, we discussed some widely used KPIs for the procurement department and used some typical goals to build an example of the strategy map.
- Find tailor-made KPIs. While you can start with standard KPIs, the best metrics are those that are tailor-made for your organization. How do you find winning metrics for procurement? Start with the stakeholders and their challenges. You can find more specific guidance in our 12 Step KPI system.
- Re-use the strategy map. The scorecard template that we have discussed in the article is a good starting point for your own procurement strategy, feel free to apply the ideas from this article to your organization and share your findings in the comments.
- Use automation software. Consider using automation software for the KPIs/Balanced Scorecard like our BSC Designer. Before, we discussed why the spreadsheet tools might not solve the challenges of scorecards effectively.
- Follow our
 Strategy Implementation System to align stakeholders, strategic ambitions, and business frameworks into a comprehensive strategy.
 - Automate strategic planning with BSC Designer by organizing goals, initiatives, risks, and KPIs into scorecards.
More About Strategic Planning


![]() CEO | Author | Speaker
CEO | Author | Speaker
BSC Designer is strategy execution software that enhances strategy formulation and execution through tangible KPIs. Our proprietary strategy implementation system reflects our practical experience in the strategy domain.