A Practical Perspective on Managing Risks in Strategic Planning Using ISO 31000 as a Guiding Standard.
Introduction: Defining Risk Beyond Probability and Impact
The guiding standard in the domain of risk management is ISO 31000. It’s intriguing to observe the evolution of the standard’s definition of risk over time:
- The previous ISO definition of risk: “A chance or probability of loss.”
- The definition according to ISO 31000:2018: “The effect of uncertainty on objectives.”
What has changed?
- The old definition mentioned “loss“; the new one employs the term “effect.” This shift implies potential positive and negative effects, as well as highlights the importance of intangibles like customer perception.
- The old definition used “chance” and “probability” to describe the likelihood of occurrences. In the modern definition, we encounter the “effect of uncertainty,” also explained as the effect of incomplete knowledge. This approach allows more flexibility in defining risks, extending beyond the “probability x impact” model.
- The addition of the term “objective” to the new definition highlights that risks are defined within a specific context, preventing potential misalignment with overall strategy.
Let’s explore the practical application of risk management in strategic planning using the guiding principles of the ISO standard.
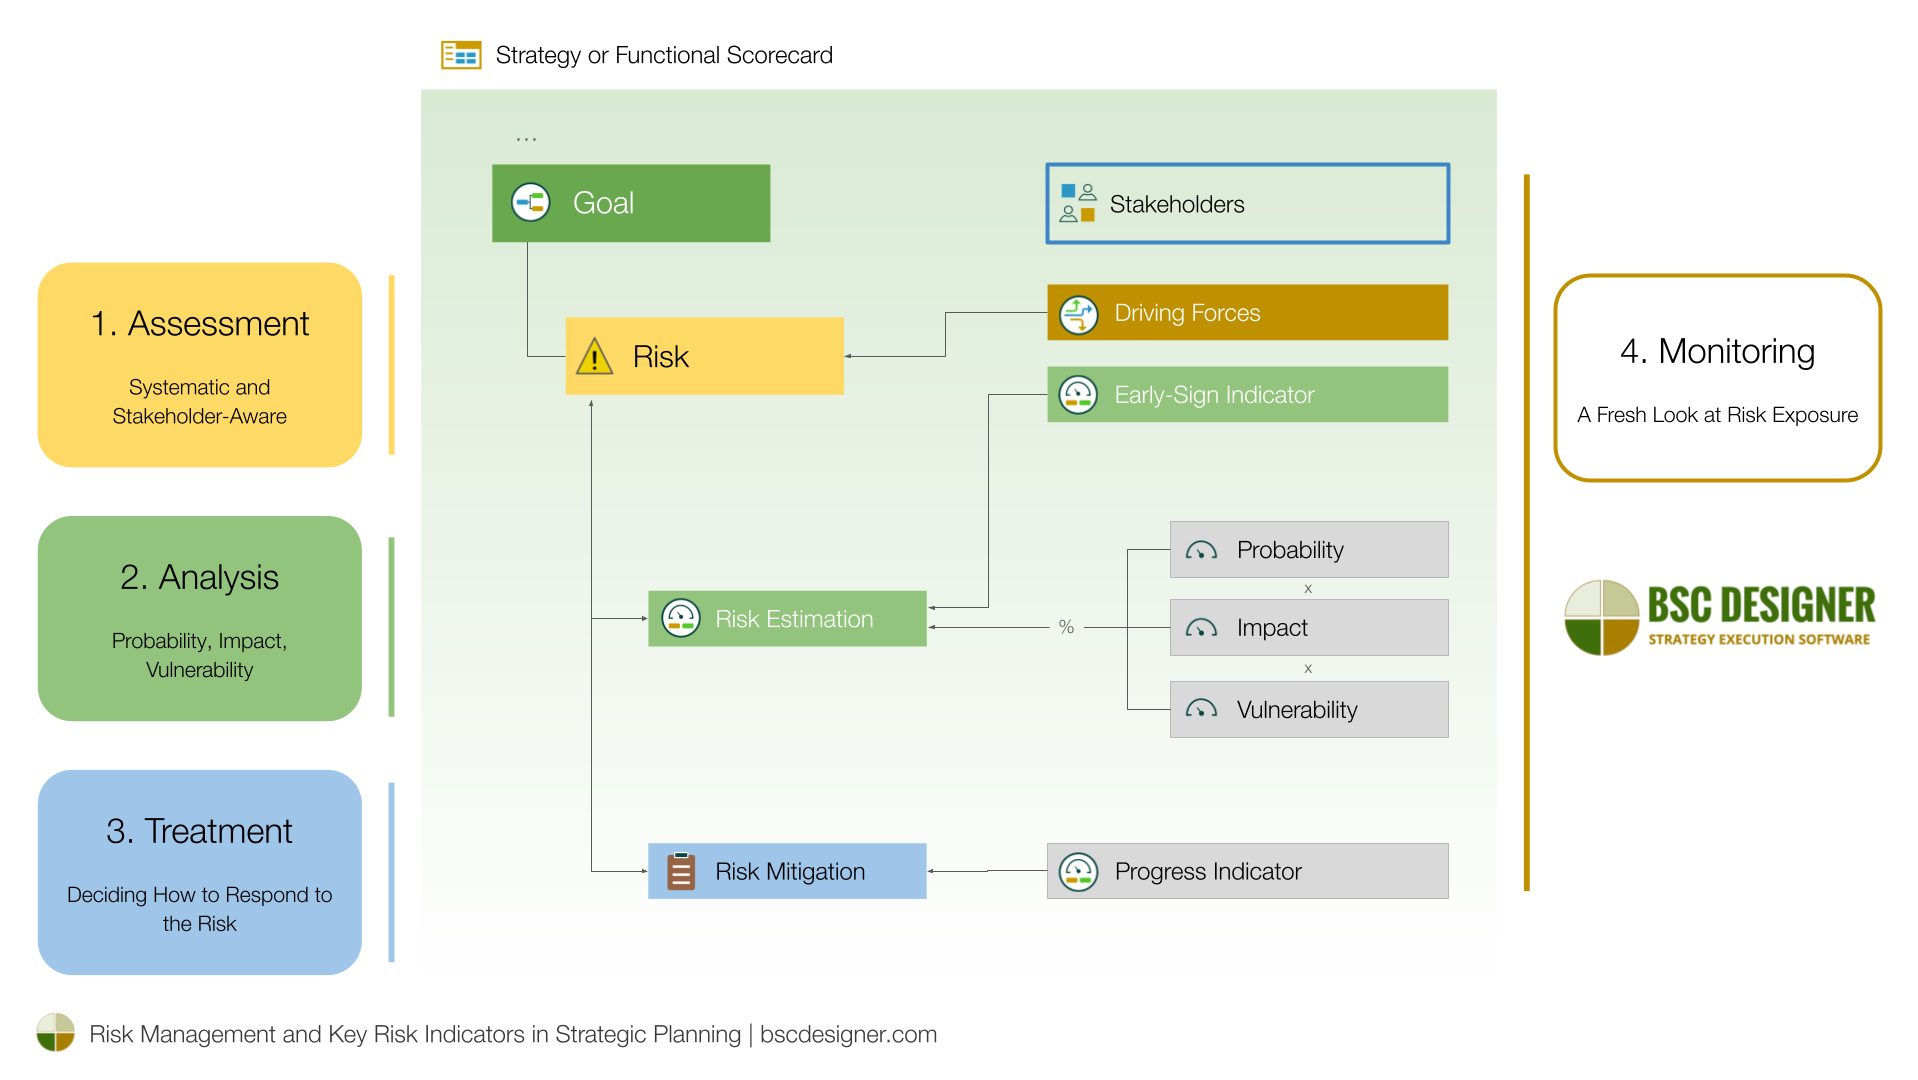
1. Risk Assessment: Systematic and Stakeholder-Aware
Map possible risks through systematic analysis of driving forces and their early sign indicators in the context of the organization’s strategy and stakeholders’ interests.
The general guideline of the ISO standard emphasizes that risk assessment should be systematic and take into account the views of different stakeholders.
What does it mean in practice?
Risk Assessment: Systematic
The concept of ‘systematic’ risk assessment varies across industries. Essentially, it involves following determined processes and standards, such as:
- Regularity of risk assessment
- Quantification of the risk
- Assigning responsible individuals
Below, we discuss how this can be implemented at an operational level.
Risk Assessment: Stakeholder’s View
Similar to other business domains (consider, for example, the sustainability reporting directive), the ISO standard focuses on stakeholder definition and requires taking stakeholders’ views into account when managing risks.
In practice, this means that organizations need to:
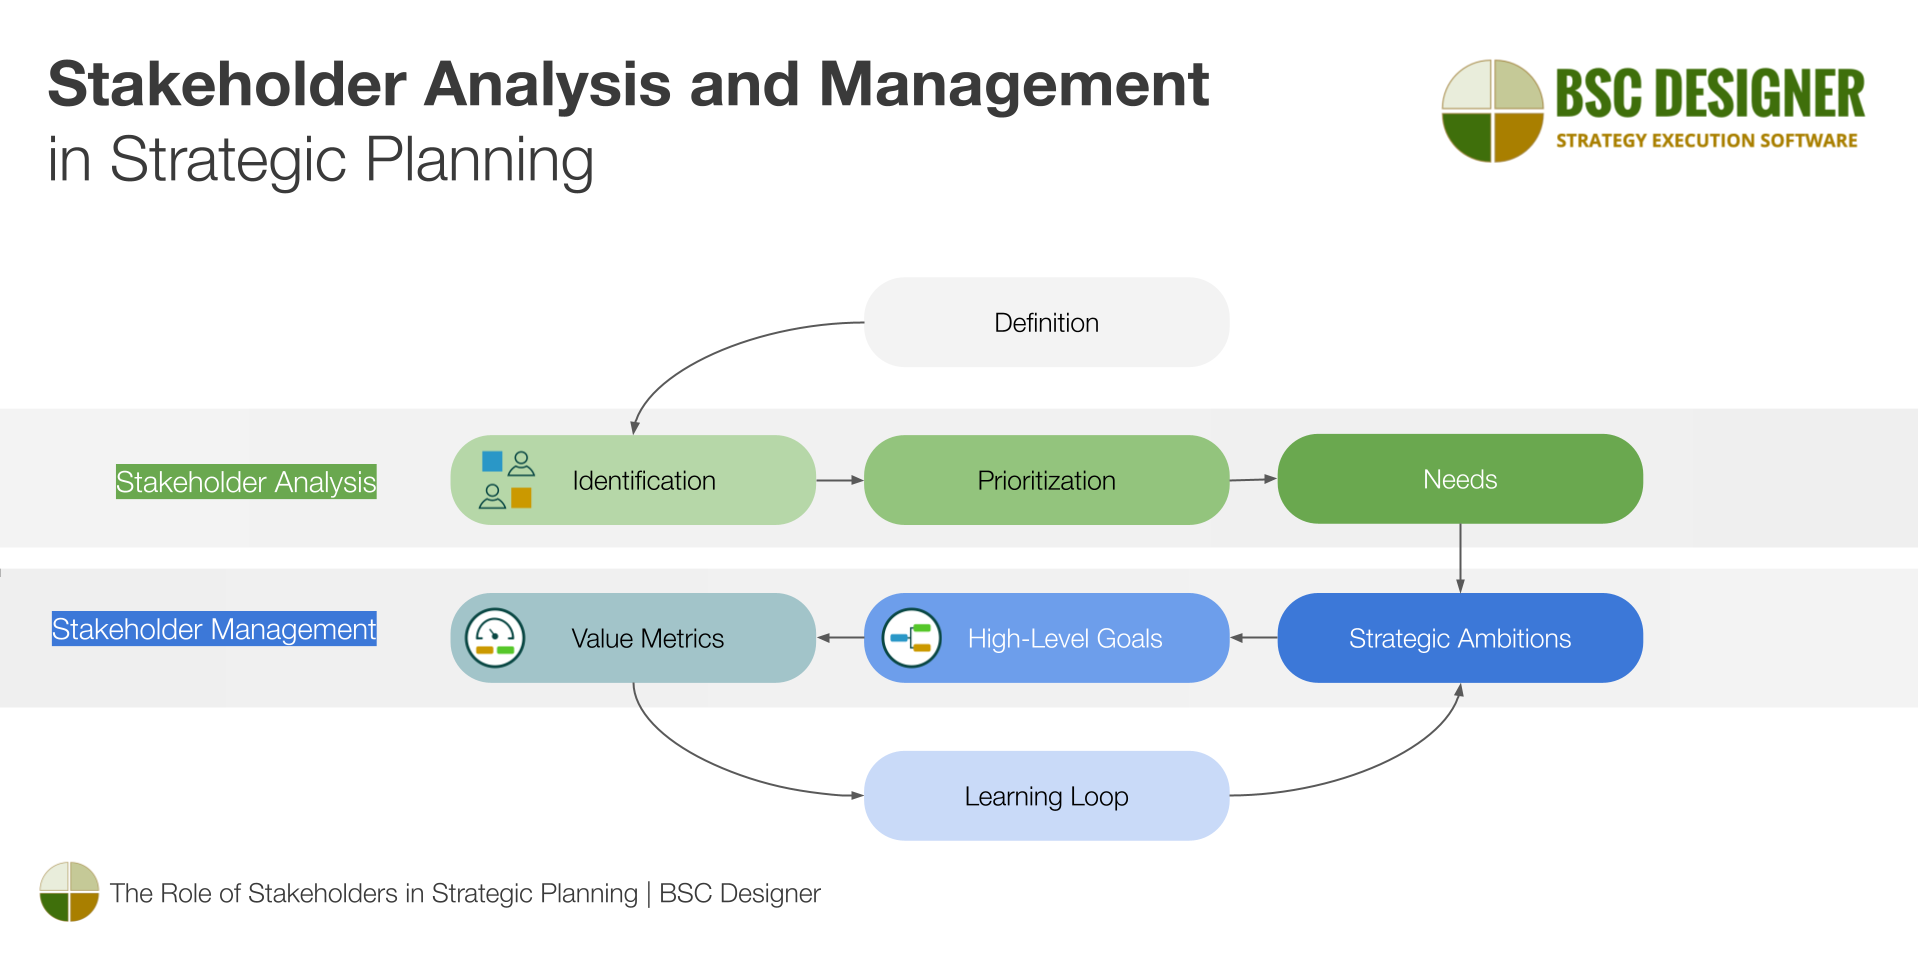
- Conduct a stakeholder analysis to define interested parties involved.
- Take the interests of stakeholders into account when creating a risk model in the context of objectives.
This standard requirement aligns well with the approach we endorse through our strategy implementation system.
Users of BSC Designer will find the stakeholder analysis template in their accounts.
- The list of stakeholders can be defined via Settings > Organization > Strategy.
- The stakeholders from the list will be included in the ‘Owner‘ list and can be assigned to a goal, risk, or risk mitigation plan.
Risk Identification in the Context of Objectives
The next step of risk assessment is to name the specific risk. The new ISO standard requires risks to be defined in the context of objectives. The aspiration of the standard is to improve the alignment between the risk and the business context.
In strategic planning, instead of having a separate risk scorecard, integrate risks into the strategy scorecards.
When conducting value-based strategy decomposition, we break down the strategic ambitions of the stakeholders into more specific goals and subgoals. At this point, we quantify goals and define risks to better understand the business context we are dealing with.
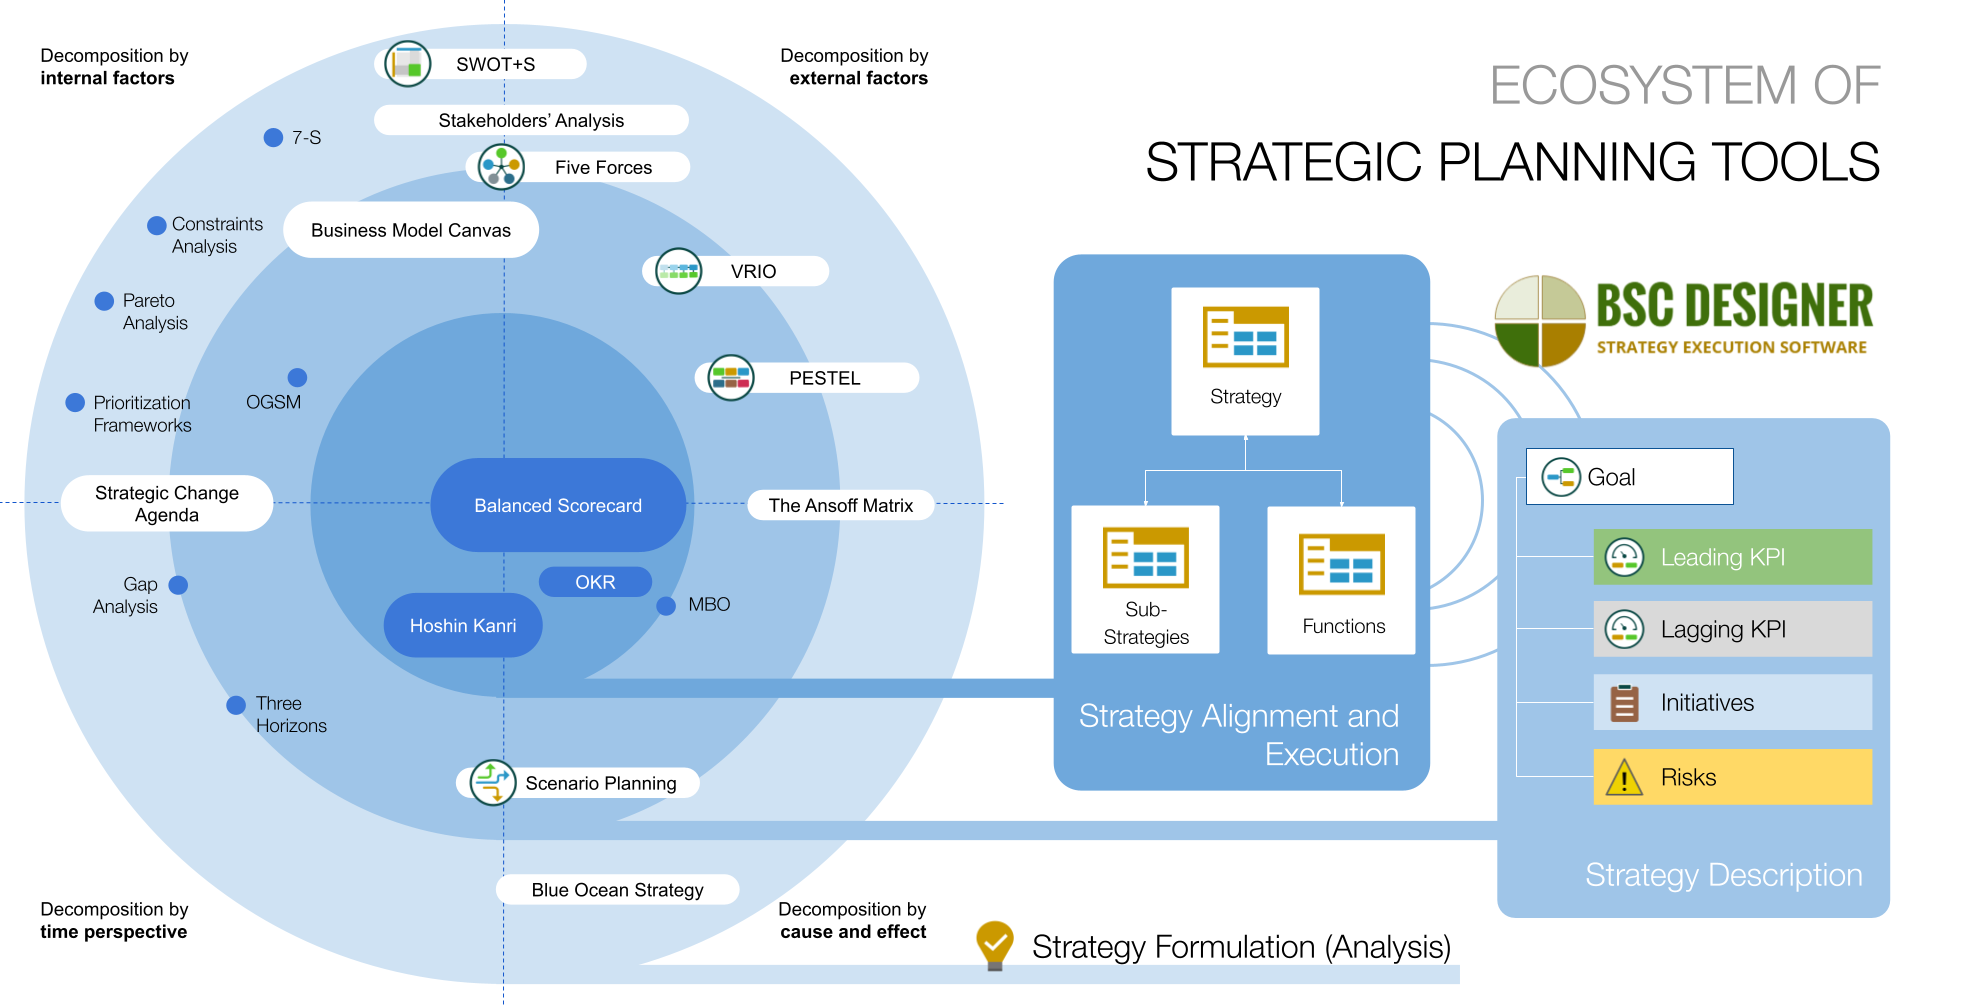
Most of the tools we use to scan the business environment (refer to the Strategy Analysis segment on the diagram) will naturally help with the identification of risks.
To define a risk in BSC Designer:
- Select any goal or create a new one
- Click on the Initiatives button.
- Add a new item
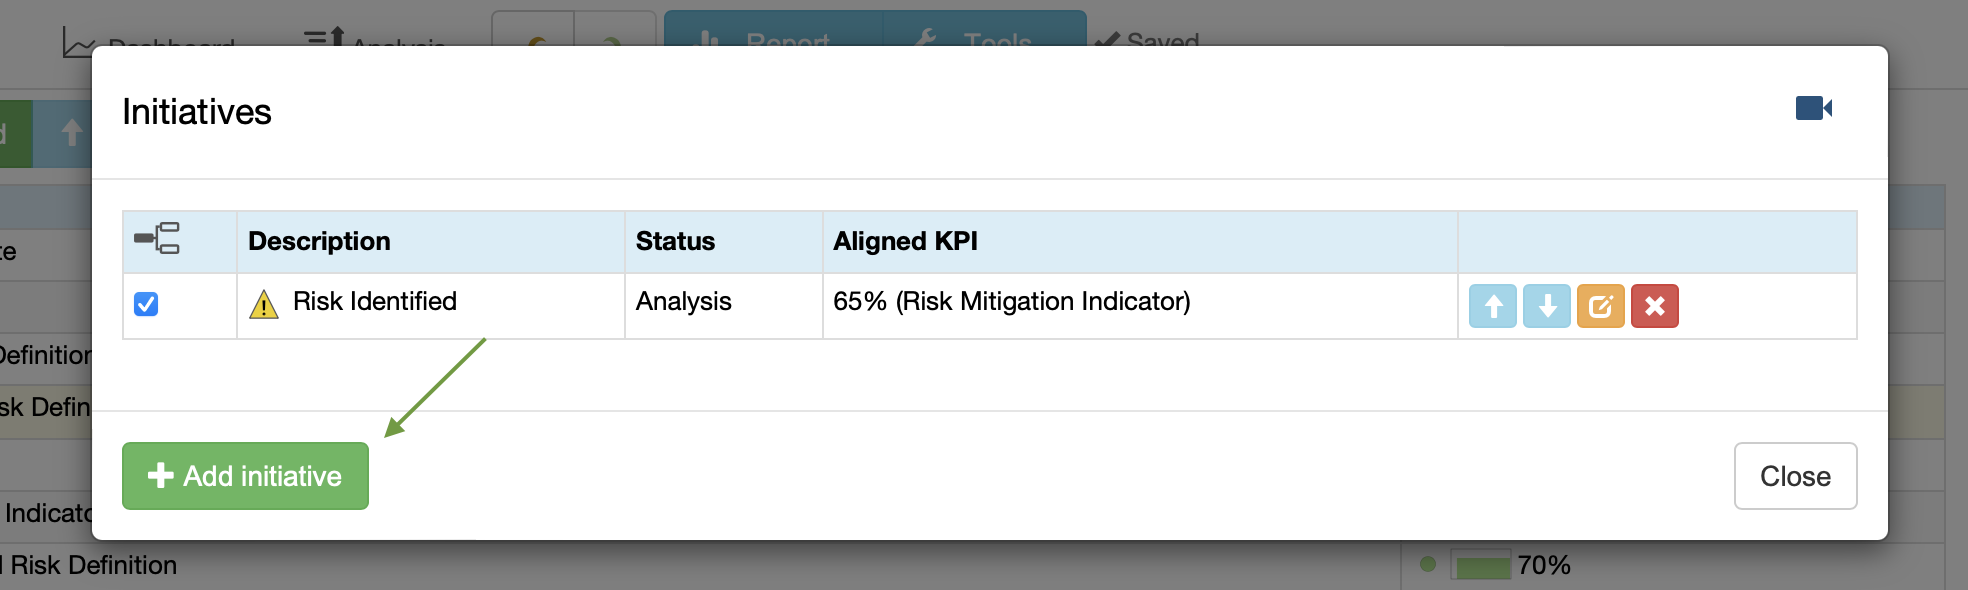
- Change its type to Risk.
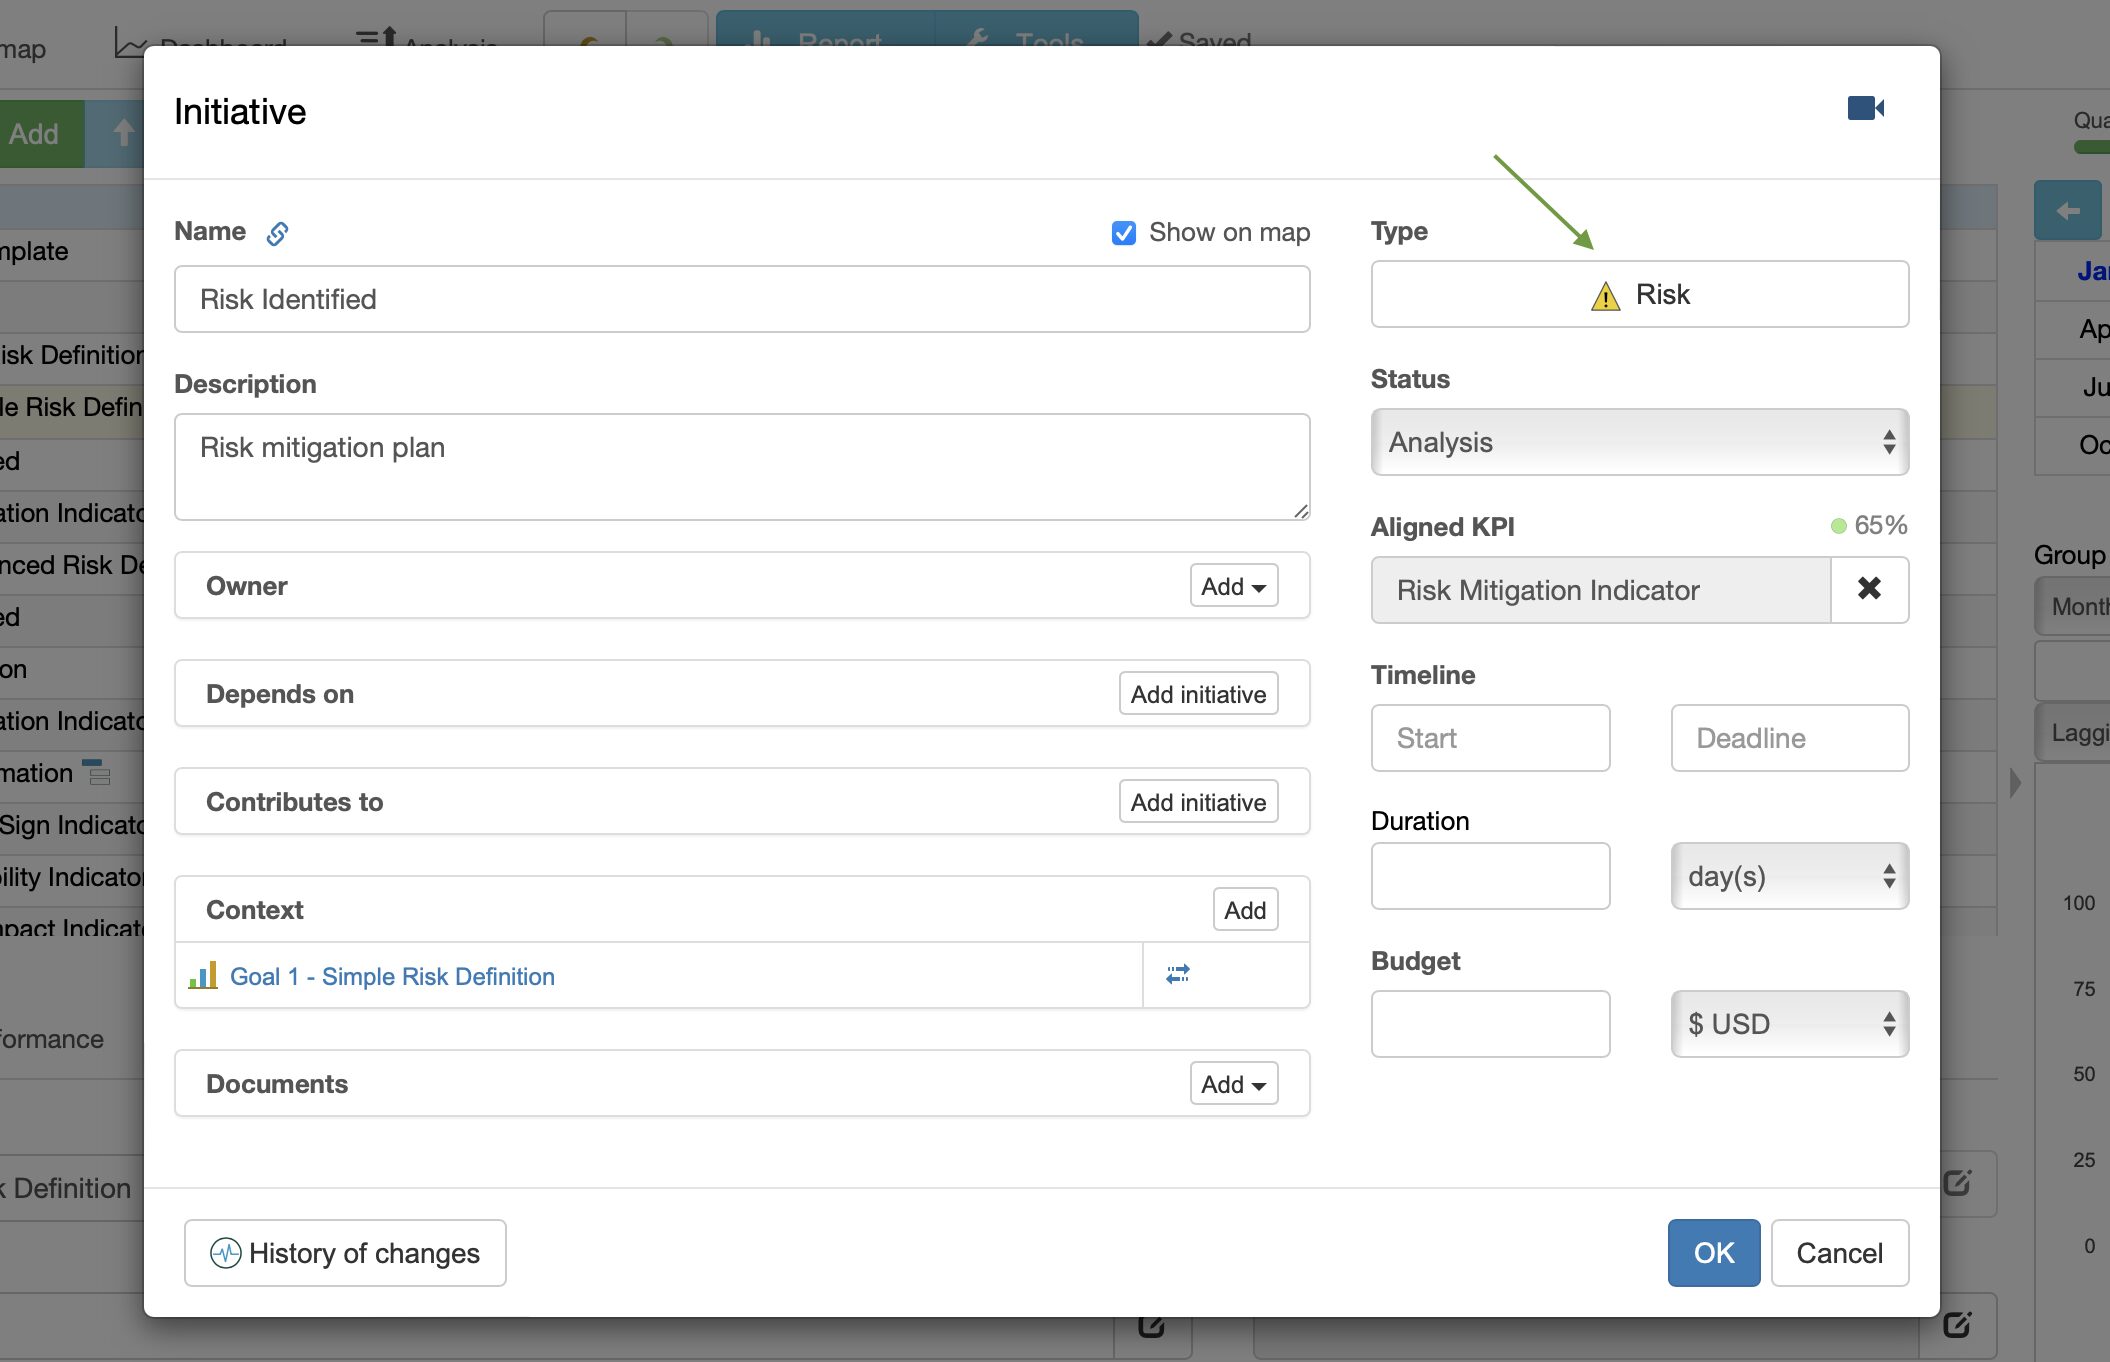
- Add relevant factors in the description field; use the Documents section to upload supporting documents.
Defining Early Sign Indicators
The root cause of the risk is what is referred to in ISO as the effect of “incomplete knowledge”.
How can we enhance our risk models in the context of the driving forces?
In addition to probability indicators, define early sign indicators. For instance, these could be early warning indicators of economic crises or even wars. By translating general driving forces into more specific factors, we increase the chance of finding a reliable early warning indicator.
In strategic planning, we distinguish these predictive/leading indicators aligned with success factors from indicators that measure outcomes (lagging indicators).
To create a predictive early-sign indicator in BSC Designer:
- Create a new indicator.
- Switch to the Context tab.
- Change the type of indicator to “Leading”.
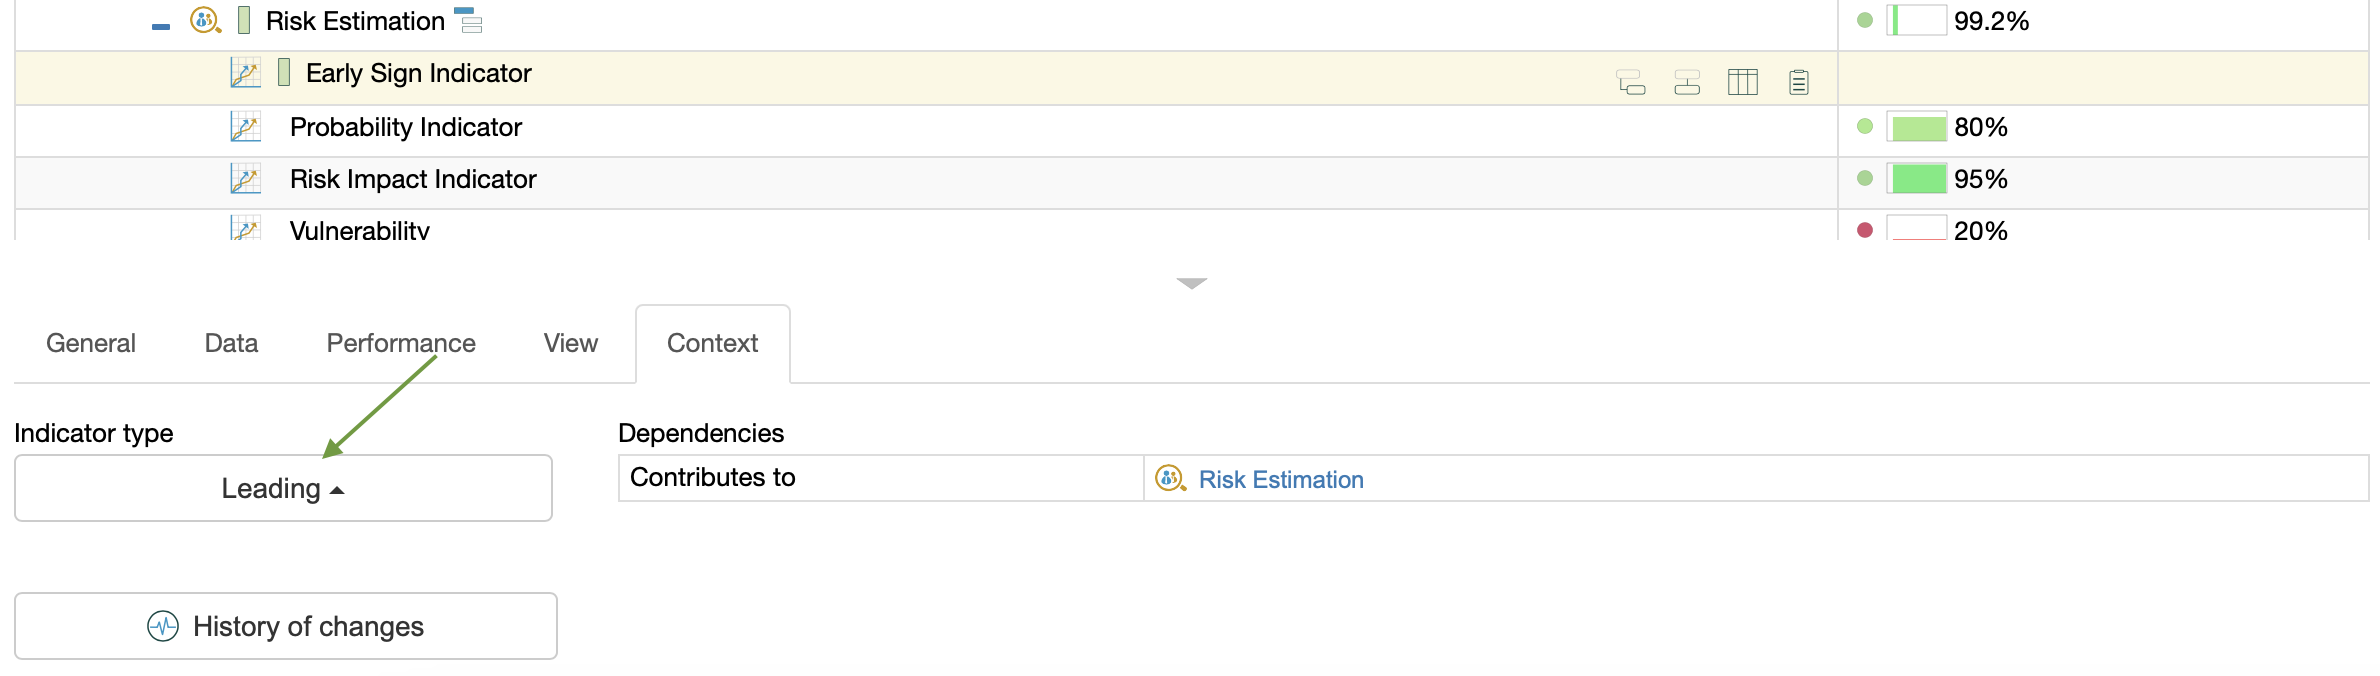
This indicator won’t be taken into account when calculating the performance of its parent goal, but we can track it and use it to quantify risk discovery or risk mitigation initiatives.
2. Risk Analysis: Probability, Impact, Vulnerability
Make risks more specific by quantifying attributes such as probability, impact, and vulnerability.
Risk analysis is a broad practice focused on understanding risk and its potential effects on the organization. Below, we provide suggestions for risk analysis in the context of strategic planning.
Define Likelihood/Probability Indicator
The likelihood indicator can be defined:
- Qualitatively, for example, on the scale [Low, Medium, High] or
- Quantitatively, for example, on the scale from [0 to 100%].
The quantitative scale is suitable for cases where the risk event has enough empirical data to estimate its likelihood over a certain period of time.
Users of BSC Designer can define qualitative measurement units (a custom scale from “Low” to “High”) that the software can convert into specific values.
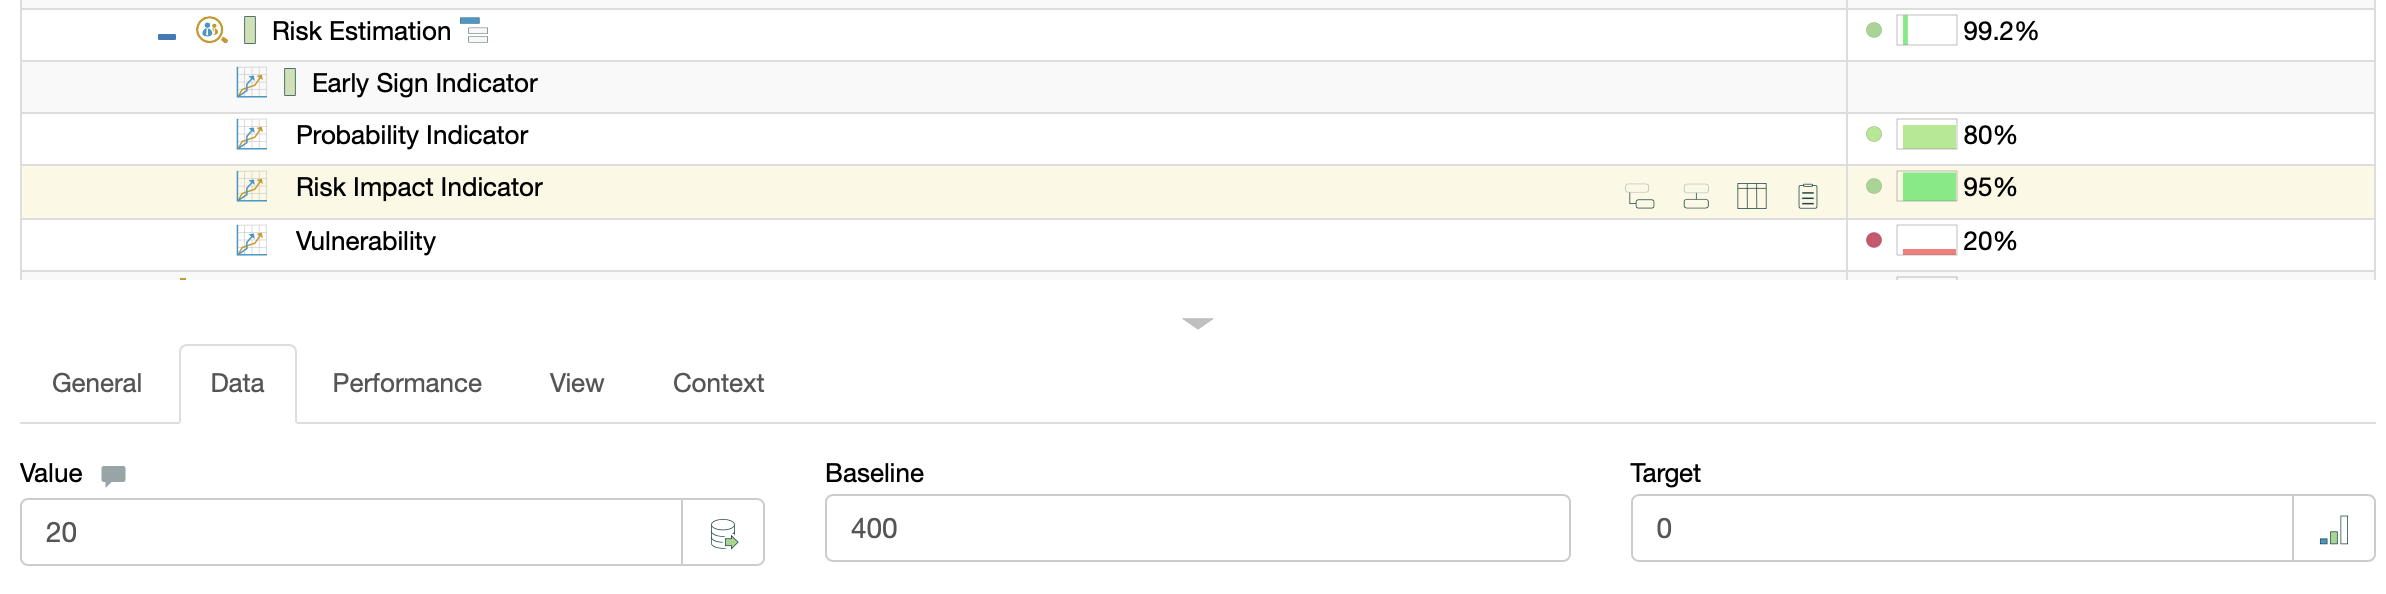
Risk Impact Indicator
The simplest form of the risk impact indicator is the dollar value of the estimated impact. The setup of the indicator for this case includes:
- Optimization function: minimization
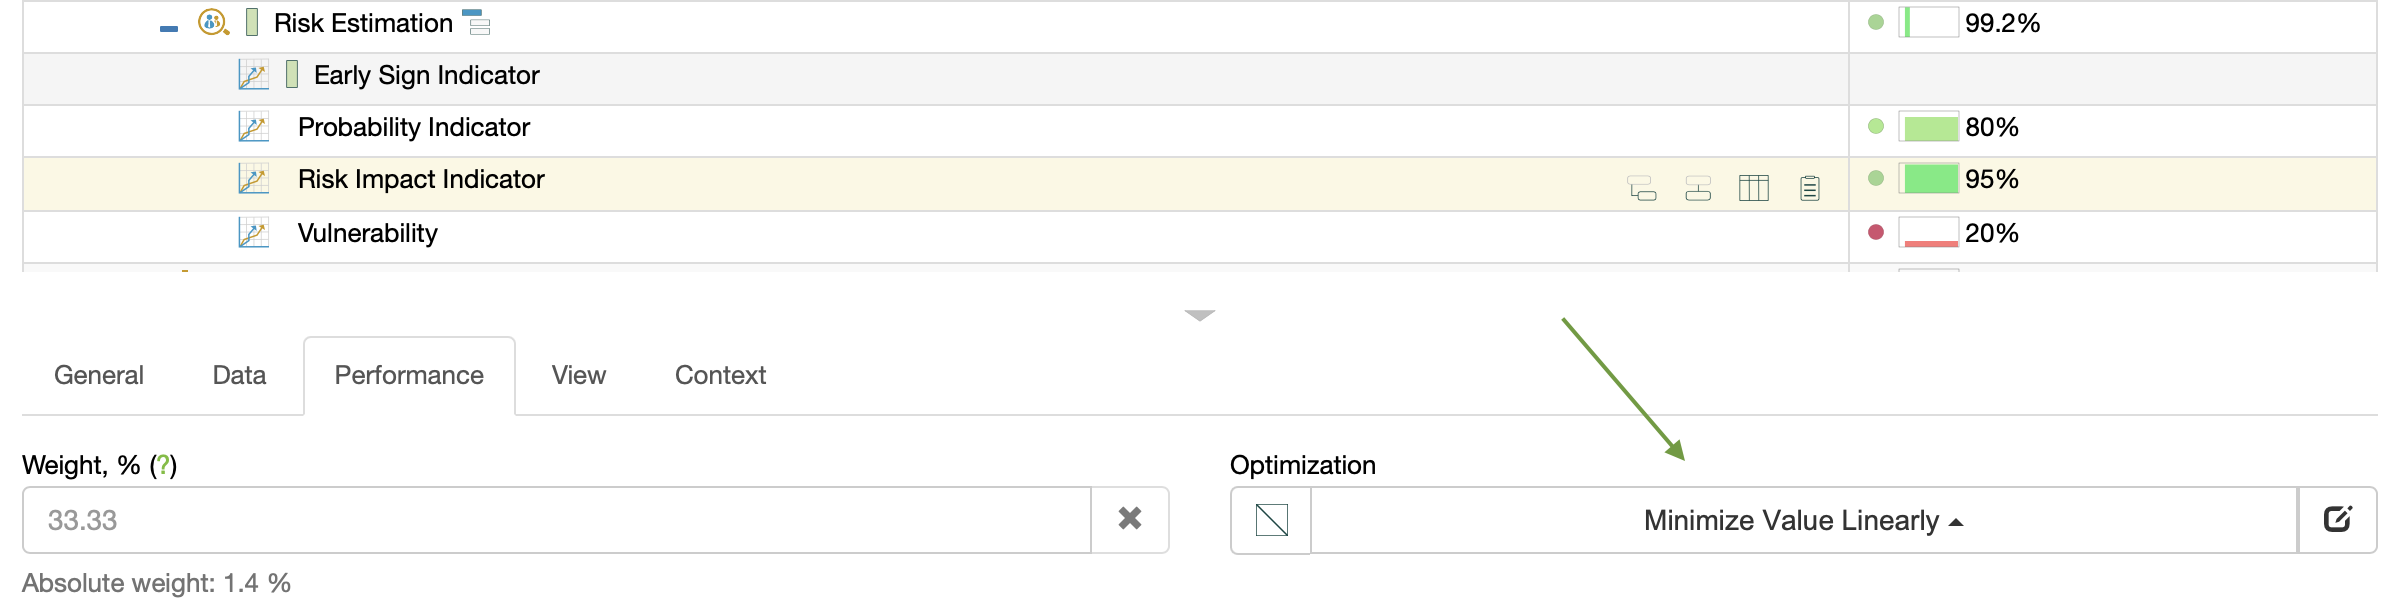
- Measurement units: $
- Baseline: the impact in the worst-case scenario
- Target: the impact in the best-case scenario
- Value: the current estimation of the expected impact
The calculated performance of such an indicator will quantify the efforts in the context of impact optimization. For more complex cases, we can build an Impact Index using various indicators like:
- Direct loss [weight 50%] (negative impact)
- Intangible loss (effect on the brand) [weight 30%]
- Regulatory fines [weight 20%]
If we plan to use this impact index in the calculation of the risk using the “Probability x Impact” formula, we would need to assign a dollar value to all indicators in the index.
An alternative option would be to use various measurement units for indicators in the index and make them comparable by normalization. The final Impact Index will use the normalized values as well. We will still be able to calculate the risk as “Probability x Impact Index”, but the results of such a calculation won’t be in dollars, but in %.
Vulnerability Indicator
The estimation of the likelihood of the risk and its possible impact doesn’t consider the organization’s sensitivity to this kind of risk.
When discussing early sign indicators, we quantified aspects of the business environment that could predict the development of certain driving forces. In the case of vulnerability, we conduct a similar analysis but focus on the organization and its infrastructure.
For instance, we could evaluate existing cybersecurity vulnerabilities through wargaming or attack simulation. More specific examples can be found in the cybersecurity article.
“Vulnerability” can be quantified according to the CVSS on the 0 to 10 scale with the “Minimization” optimization function.
Track Time Factors
The constant change of the driving forces, as well as risk prevention initiatives, results in changes in risk estimations.
Track the evolution of the risk over time and note down relevant ideas for the learning and improvement cycle.
To automate this in BSC Designer:
- Establish an update interval for risk indicators.
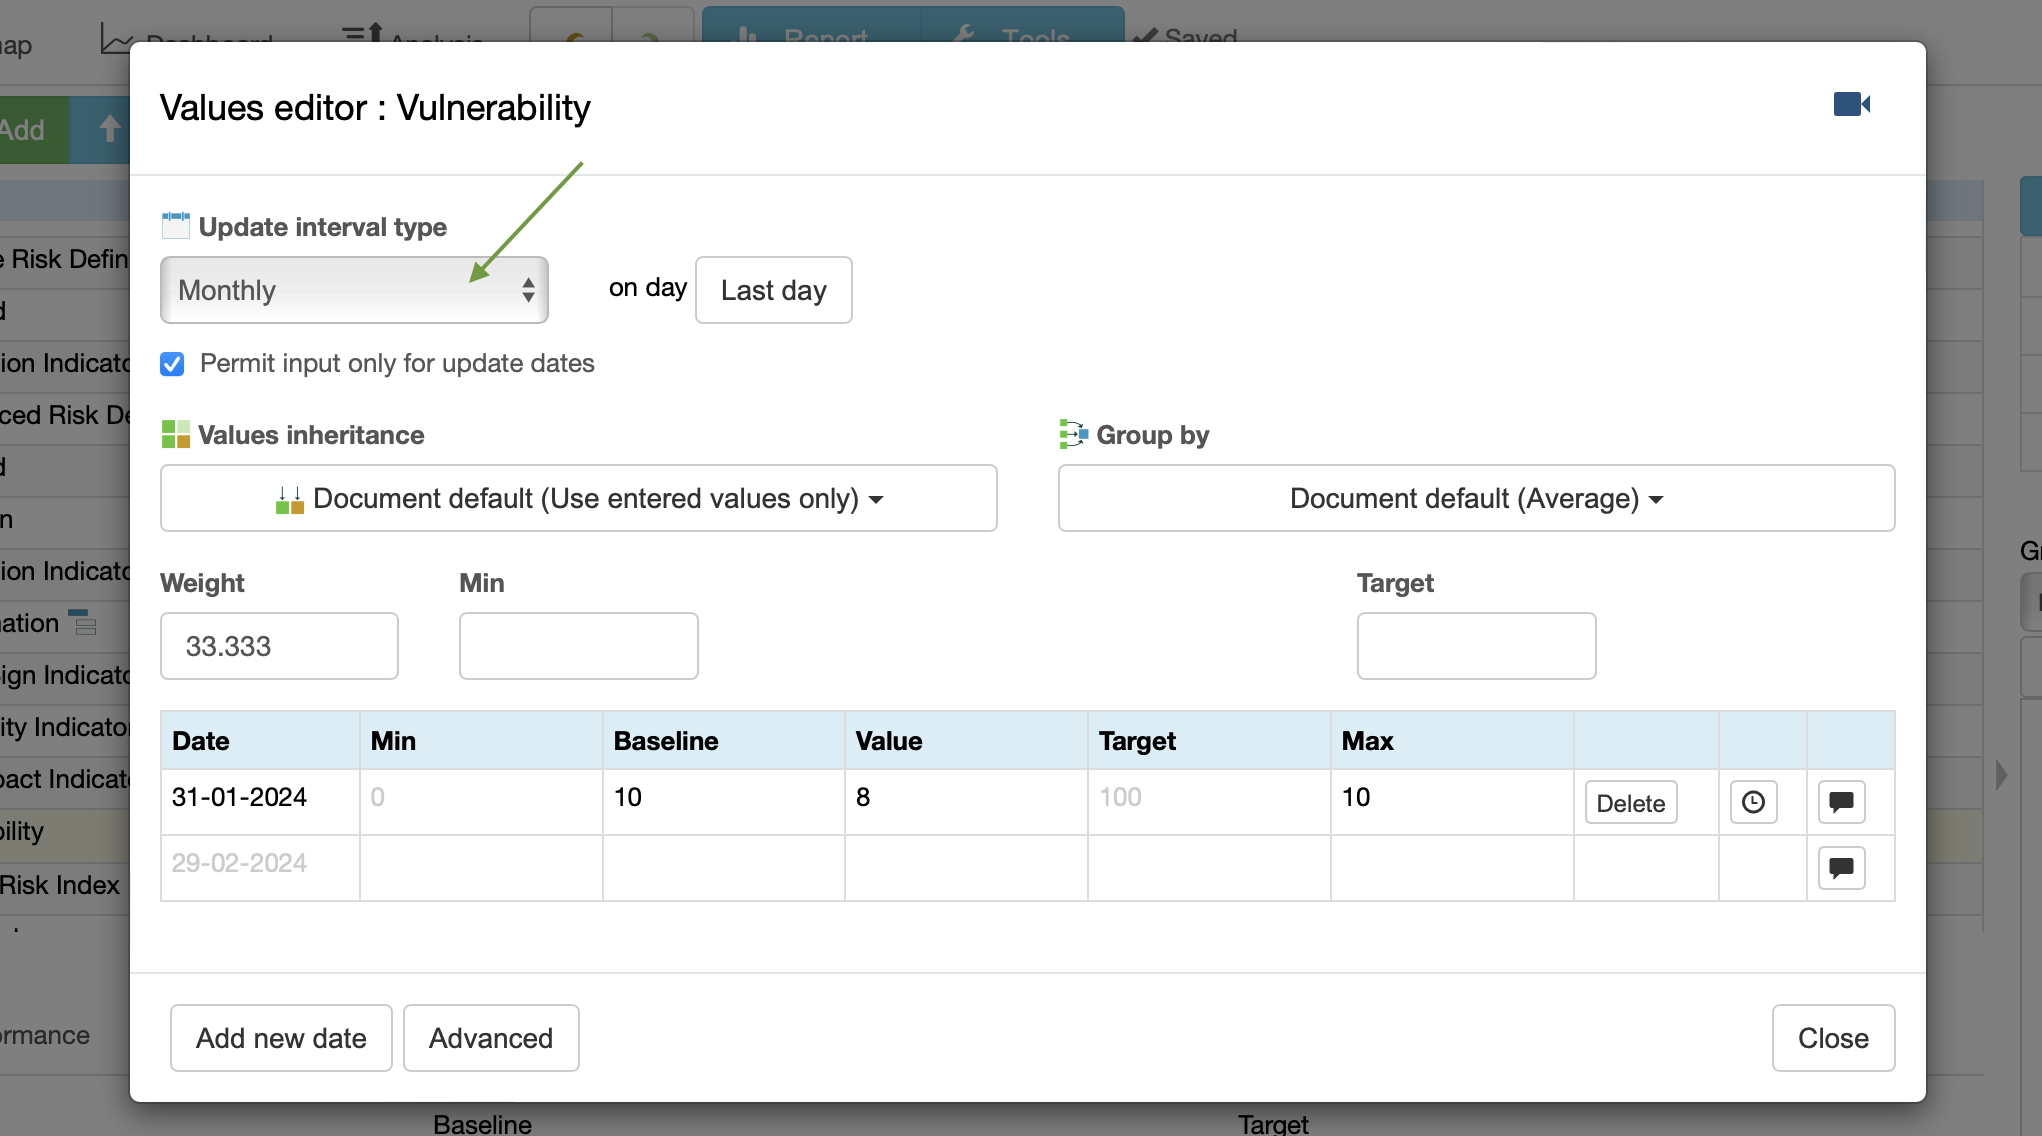
- Use the interval calendar and Value field to update the indicator with fresh data.
- Use the comment button to add relevant notes to the update.
3. Risk Treatment: Deciding How to Respond to the Risk
Implement mitigation plans for the risks and track the success of implementation with the statuses of initiatives and risk mitigation indicators.
According to the established thresholds of acceptable risks and following the results of risk analysis, decision-makers formulate a response strategy for the risk with possible options like:
- Removing risks as not relevant
- Monitoring within the existing risk model
- Introducing a risk treatment plan
- Questioning the risk analysis
- Questioning the context (goal or stakeholders’ ambition)
In BSC Designer:
- Assign a risk “Risk Mitigation” indicator to the risk to track the progress of risk mitigation initiatives
- Use the status field of the risk to indicate its current status according to the accepted risk management workflow
- Add additional items via the Initiatives dialog (new risks, initiatives, rationales, hypotheses, expected outcomes)
- Add relevant data for risk treatment, such as budget, timeline, progress indicator, persons responsible
- Upload relevant supporting documents
4. Risk Monitoring: A Fresh Look at Risk Exposure
Track the evolution of the risk exposure over time with key risk indicators and dashboards.
The indicators we used to define the risks are configured for a certain update interval. Owners assigned to the risk indicators will receive notifications about upcoming update intervals and missed updates.
It is also possible to visualize on the dashboard the indicators that were not updated on time.
The details of all updates (person who updated, when the update was made, if the previous value was changed) can be visualized via the audit log for the indicators.
On the level of the governance scorecard, regular risk analysis can be quantified by a dedicated indicator:
- Add the “Conduct systematic risk assessment” to the governance scorecard.
- Configure the indicator to be updated quarterly or annually.
- Assign the person/team responsible for regular risk analysis as an owner of this indicator to have email reminders about upcoming updates.
- Align this indicator with corresponding indicators from lower levels that quantify risk assessments done in specific areas.
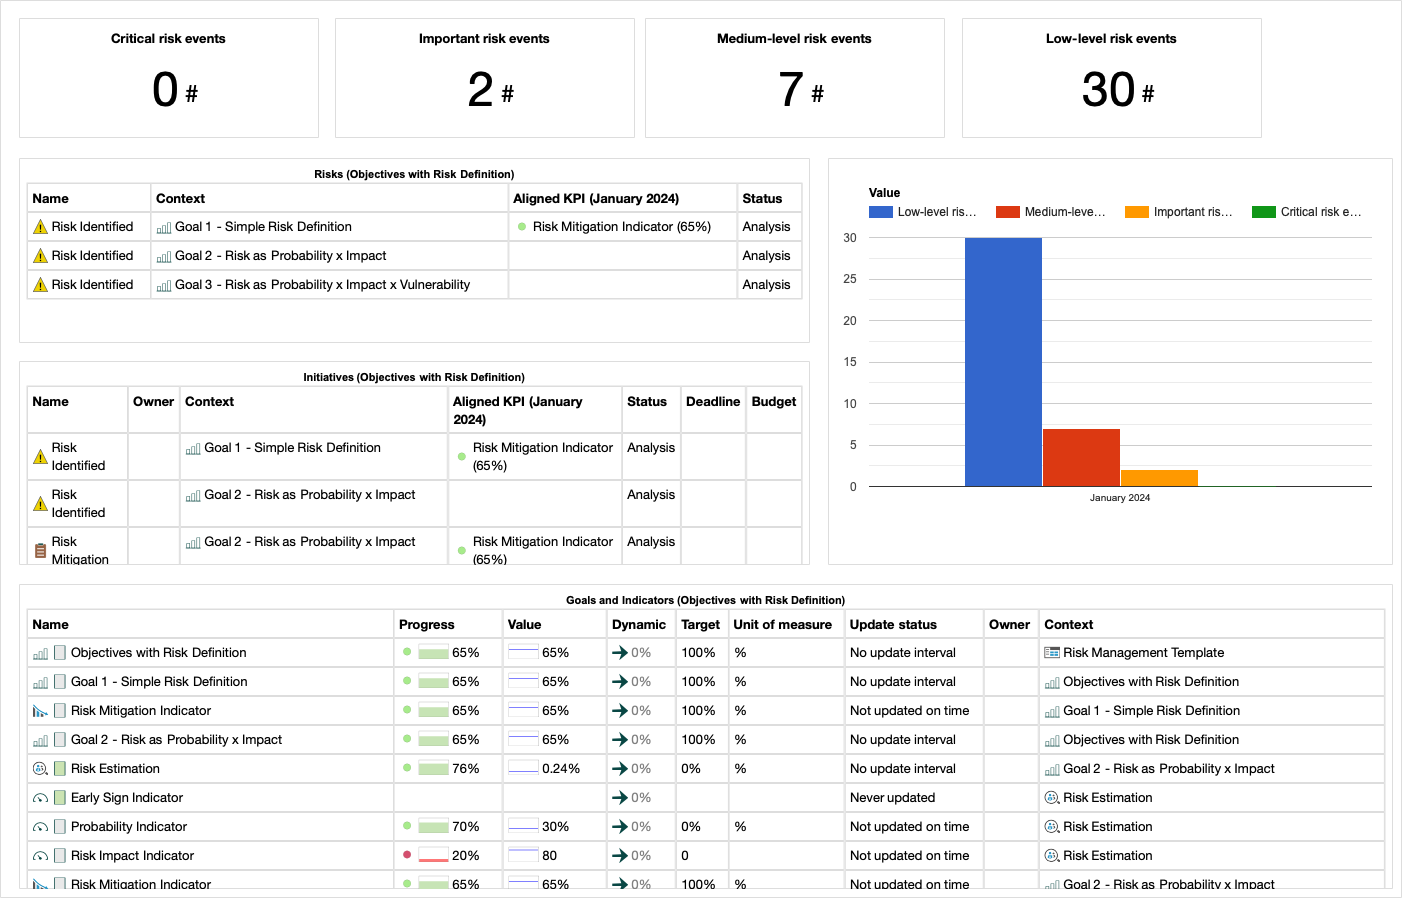
Dashboards
In addition to monitoring with regularly updated indicators, consider adding a dashboard with relevant diagrams:
- A diagram with a list of the risks, their statuses, treatment progress, persons responsible
- Dedicated diagrams for the most critical risks
- Diagrams for the risk index and its change over time.
Weighted Risk Index
One of the popular means to report risk incidents is using a weighted risk index. A simple index could look like this:
- Low-impact events (weight = 5%)
- Medium-impact events (weight = 15%)
- High impact events (weight = 30%)
- Critical events (weight = 50%)
The use of the index helps prevent manipulation of the indicator by masking high-value events with low-value fixes.
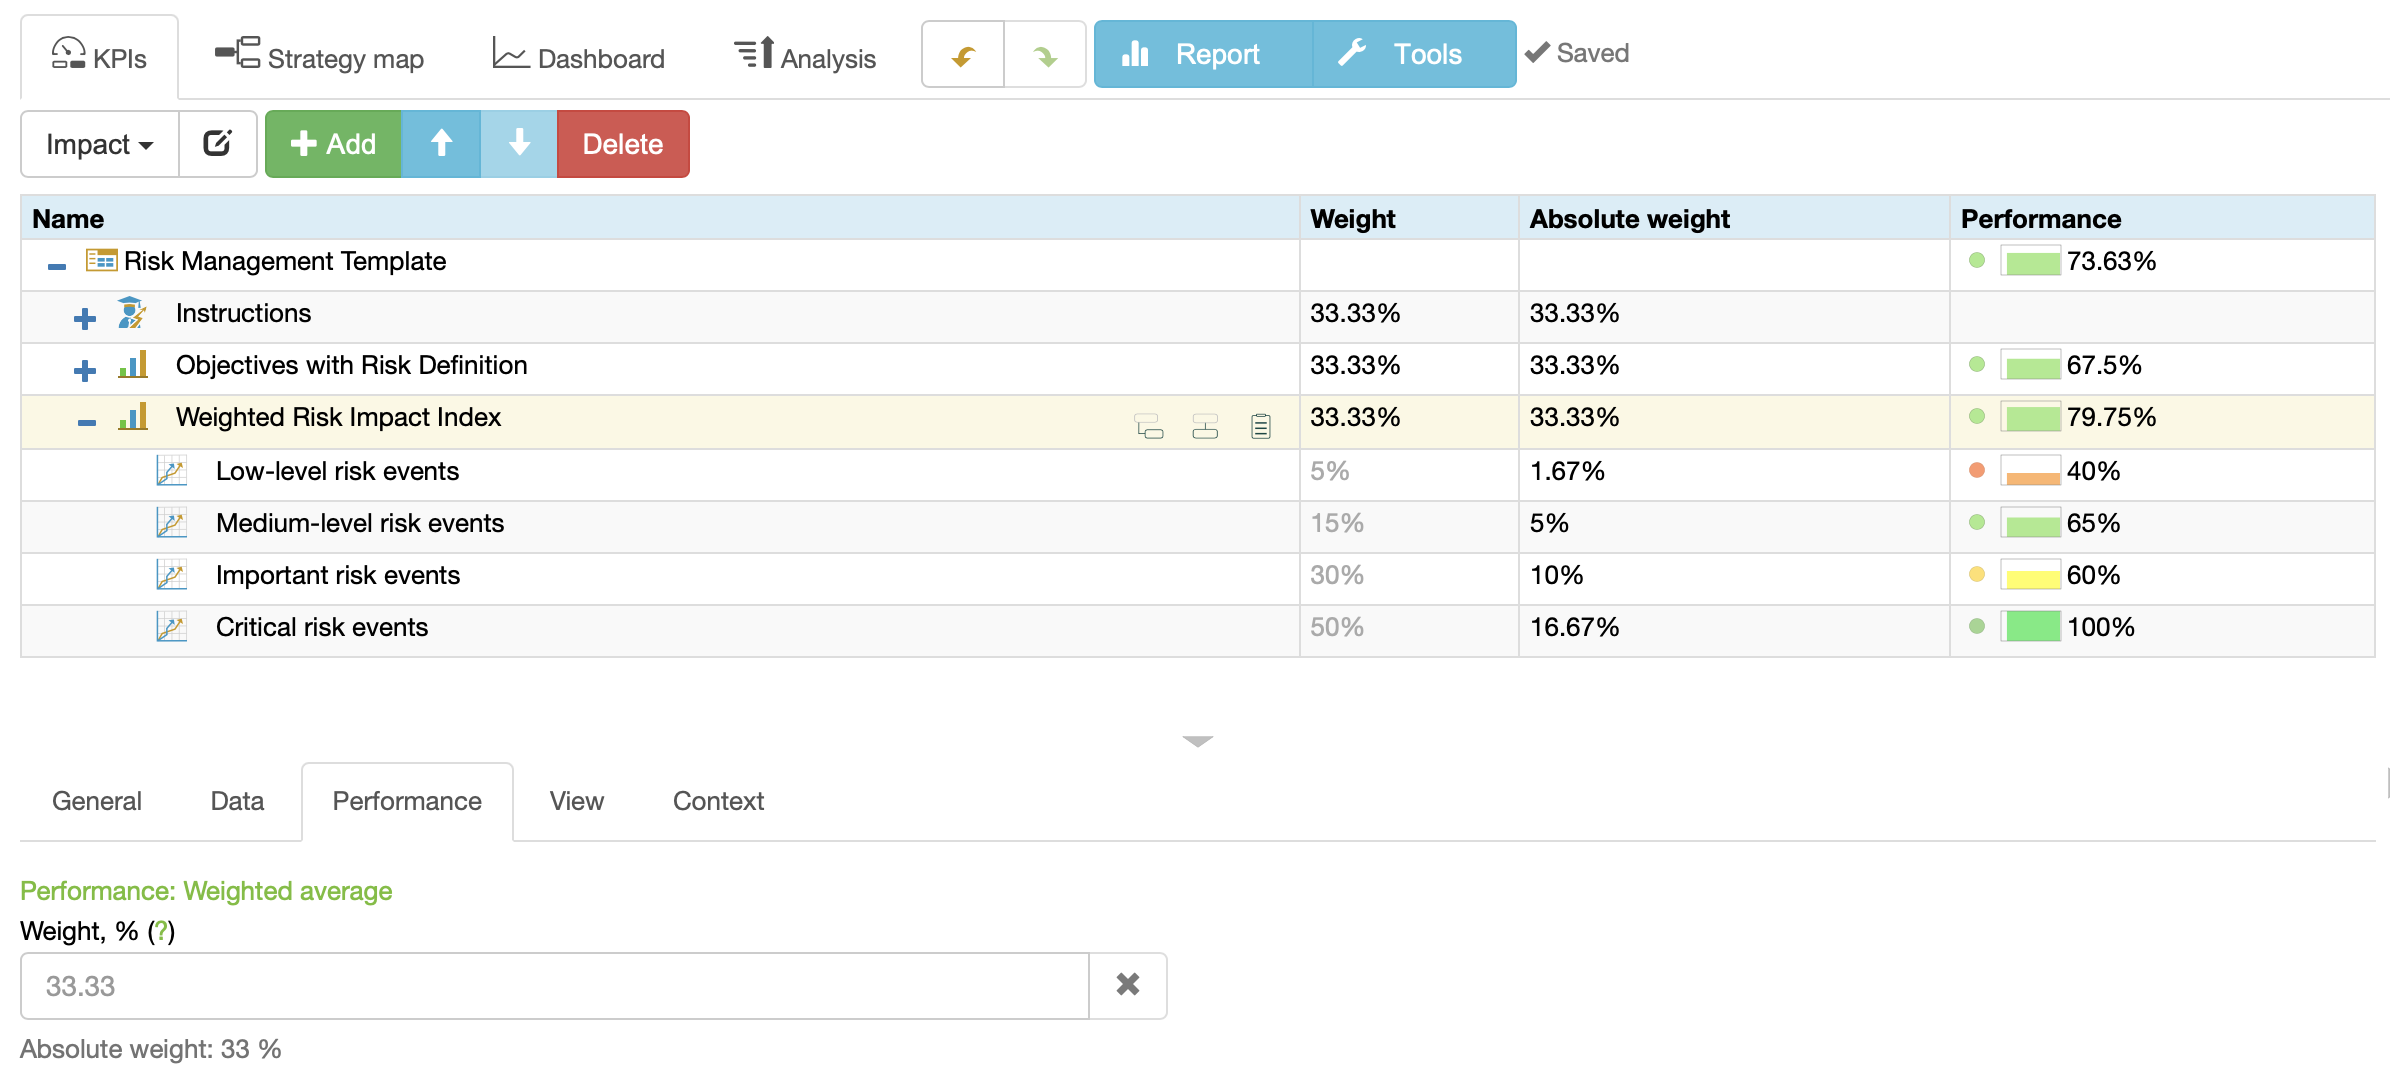
In BSC Designer:
- Use the Add button to create a hierarchical structure of indicators.
- Use the Weight property on the Performance tab to assign relevant weight to the indicators.
Risk Management Template
Automate risk management using lightweight or complex risk estimation models.
In the risk management template, you will find several techniques that one can use to define risks in their scorecards.
- Copy and paste the items from the template into your strategy scorecards.
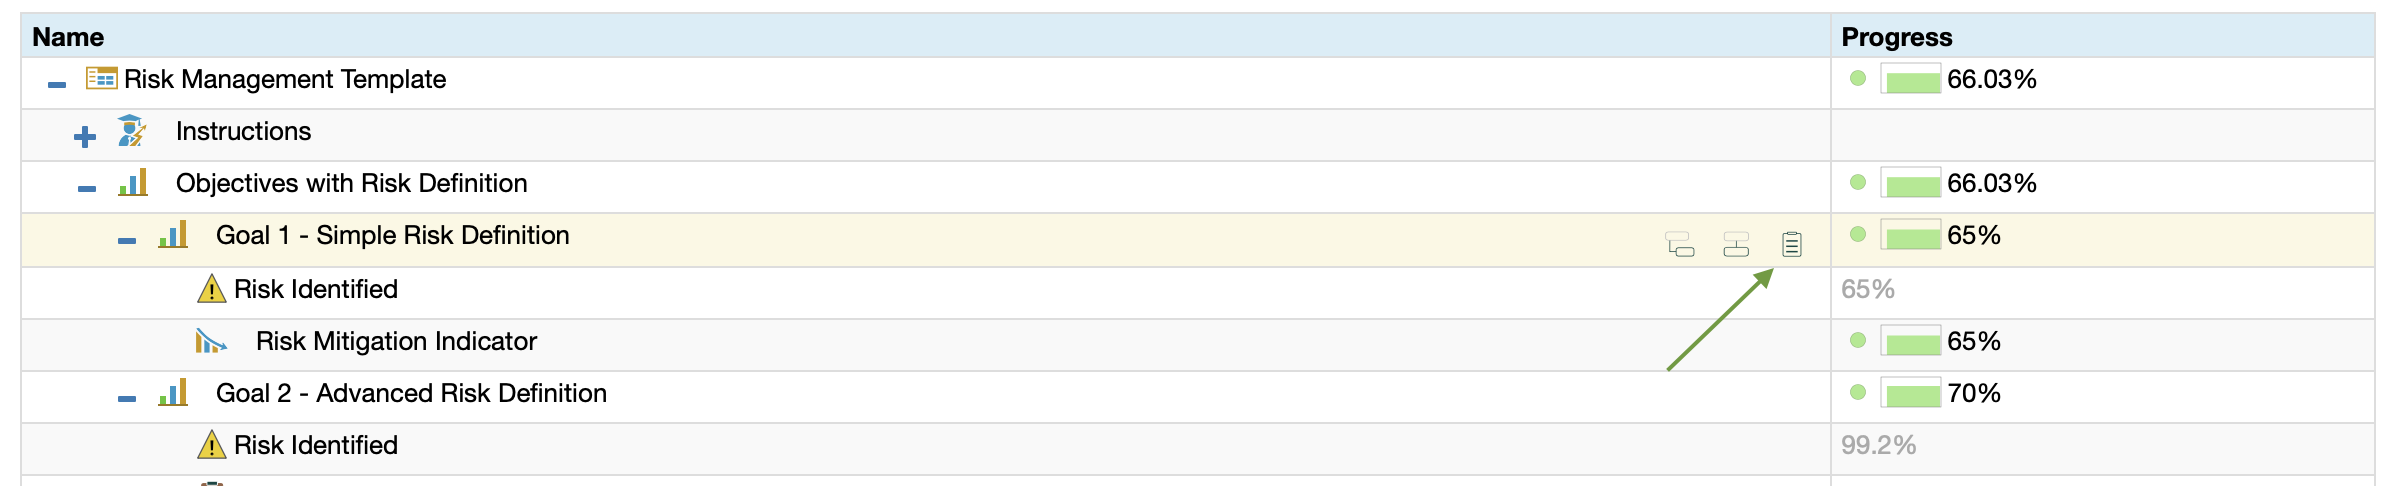
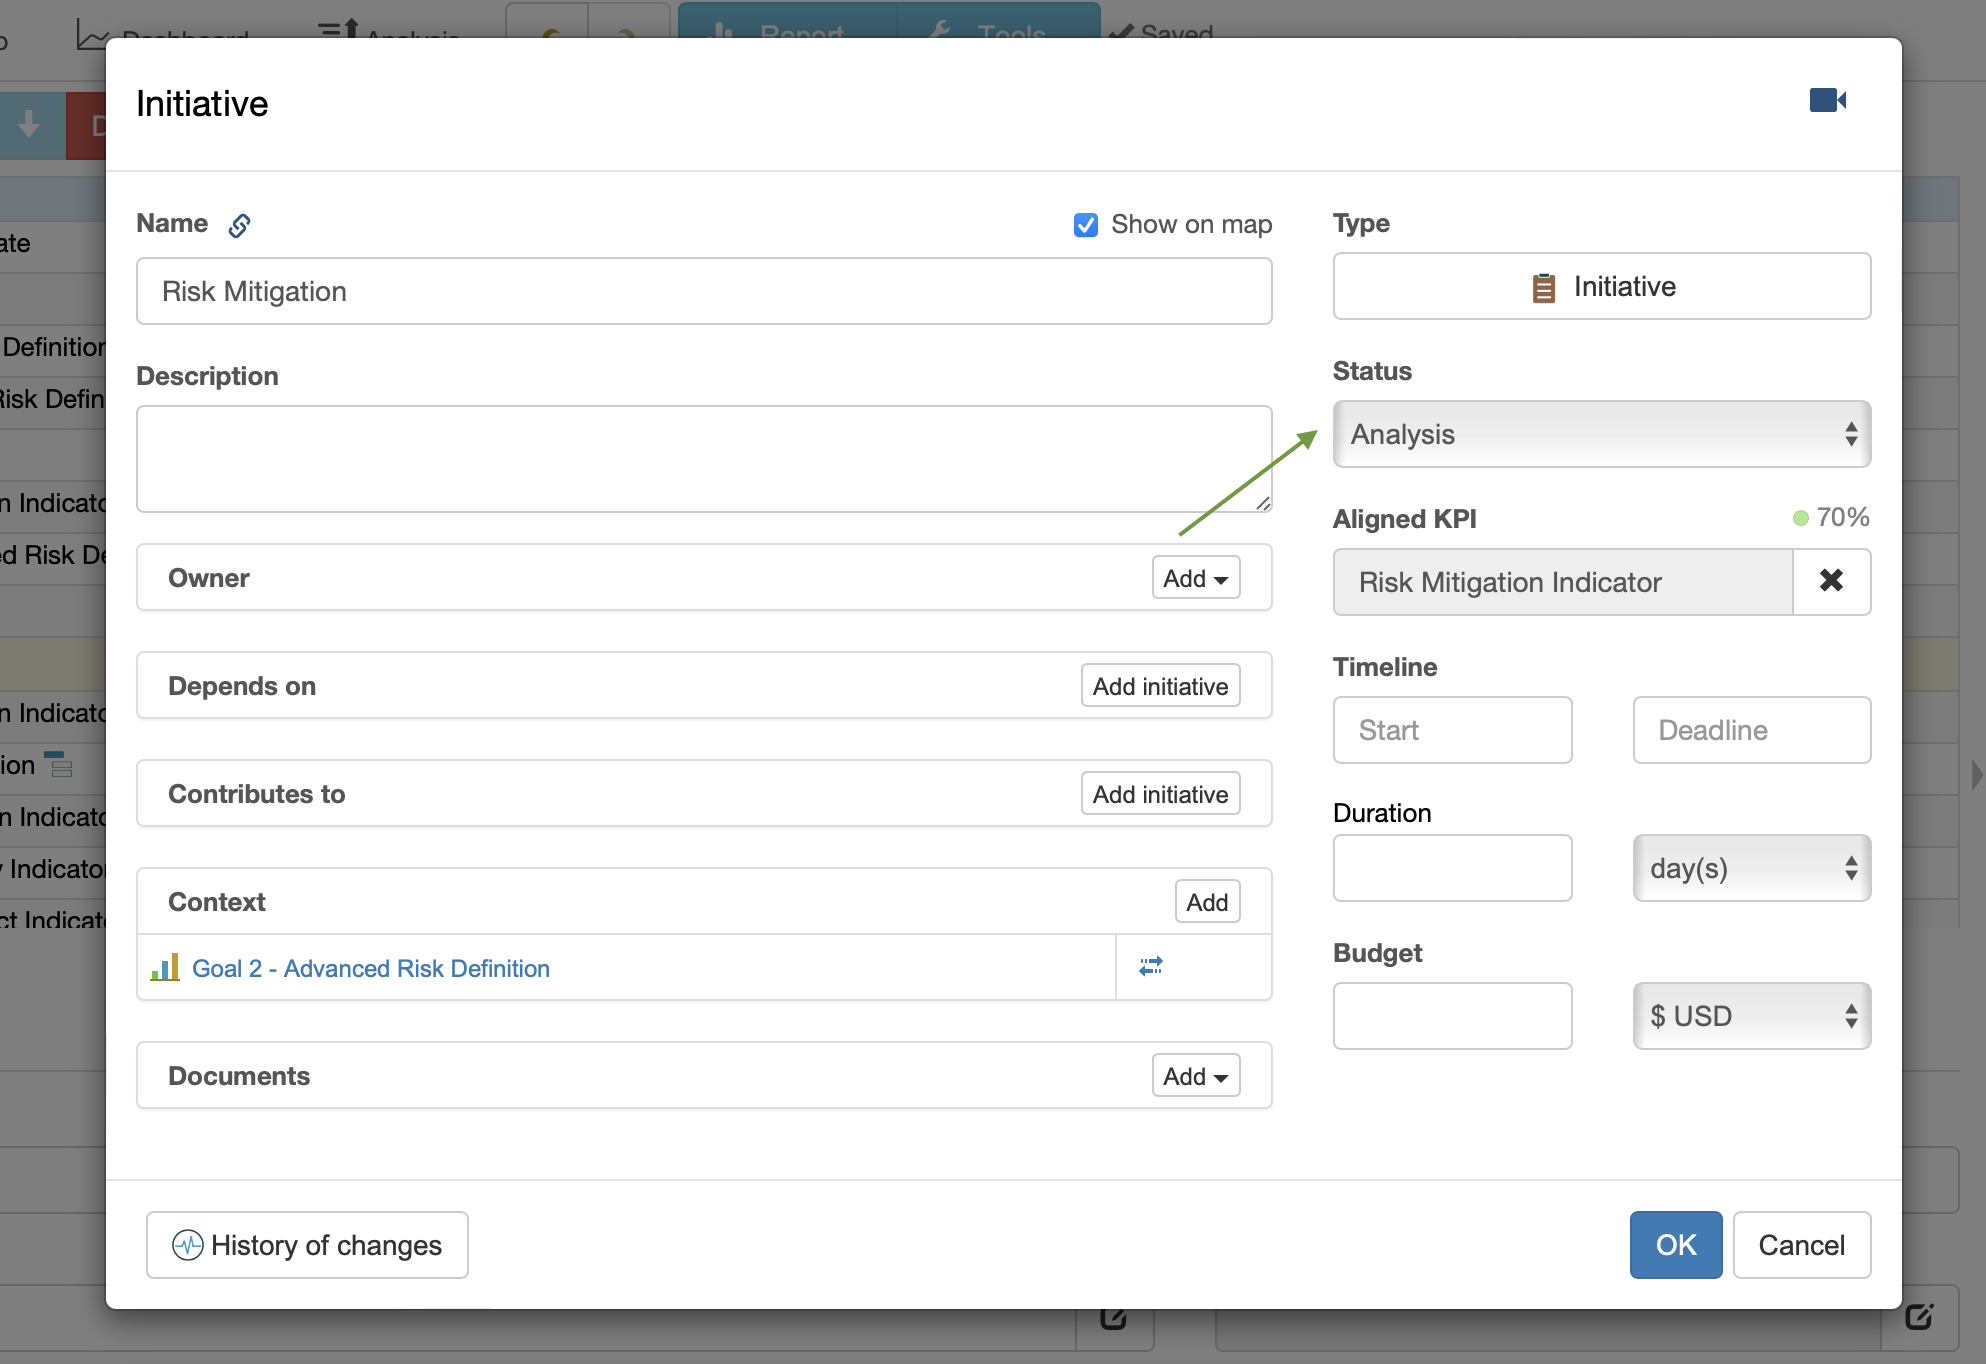
Case 1. Light-Weight Risk Definition
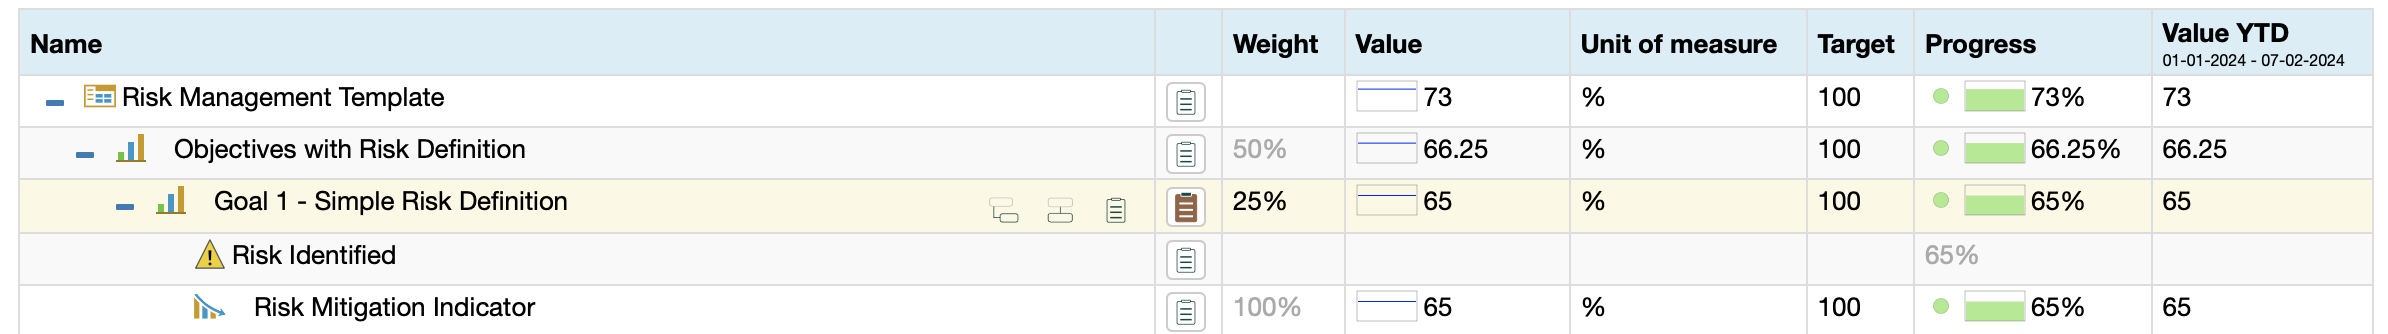
The “Goal 1” is an example of a simple risk definition:
- There is a risk defined for the goal.
- The risk definition includes a risk mitigation plan.
- The risk includes the ‘Status’ property to track the current status of risk response.
- The risk is aligned with the “Risk Mitigation Indicator” that should show the progress of the risk mitigation initiative.
Case 2. Early Sign Indicator + Risk as Probability x Impact
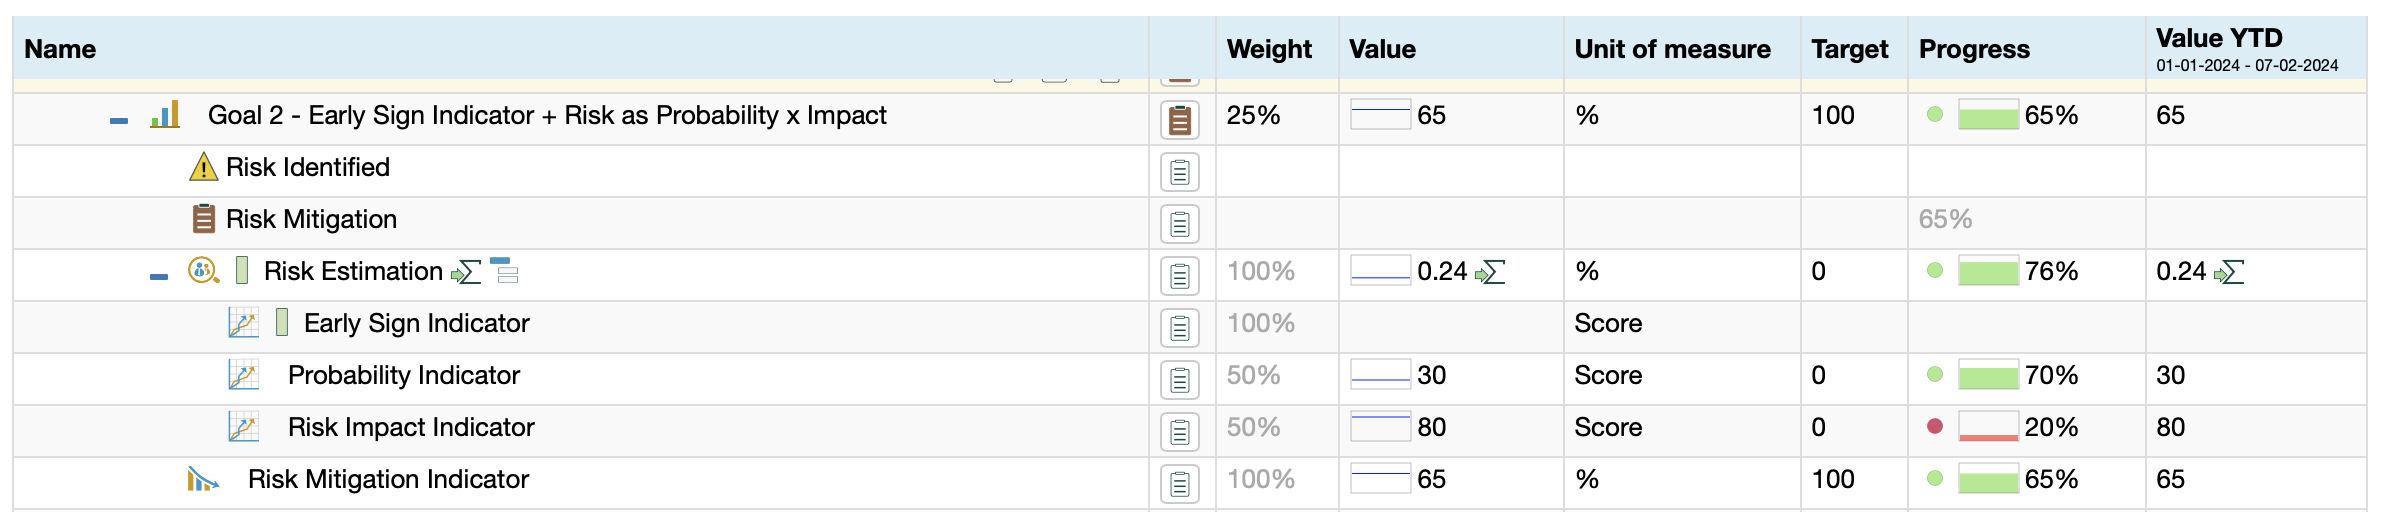
Goal 2 serves as an illustration of a more specific risk definition. The Risk Estimation indicator includes one leading and two lagging indicators:
- The Early Sign Indicator, a leading indicator, serves to provide early warnings of escalating risks.
- The risk estimation is calculated as Probability x Impact, with non-normalized values being used.
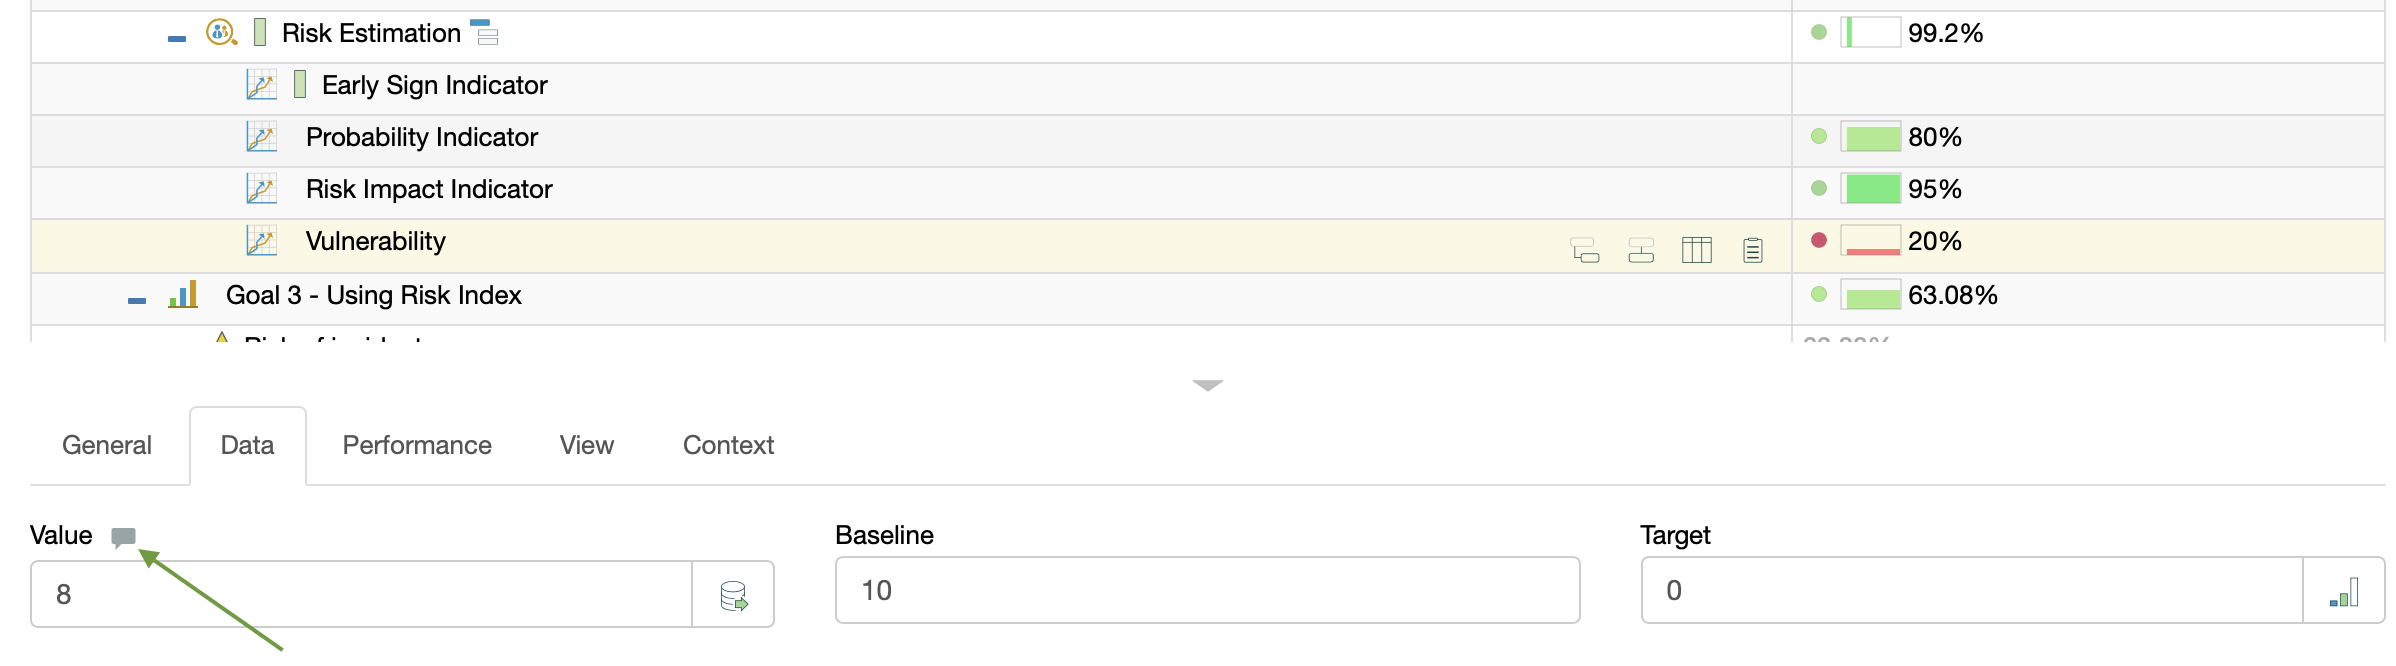
Case 3. Probability x Impact x Vulnerability
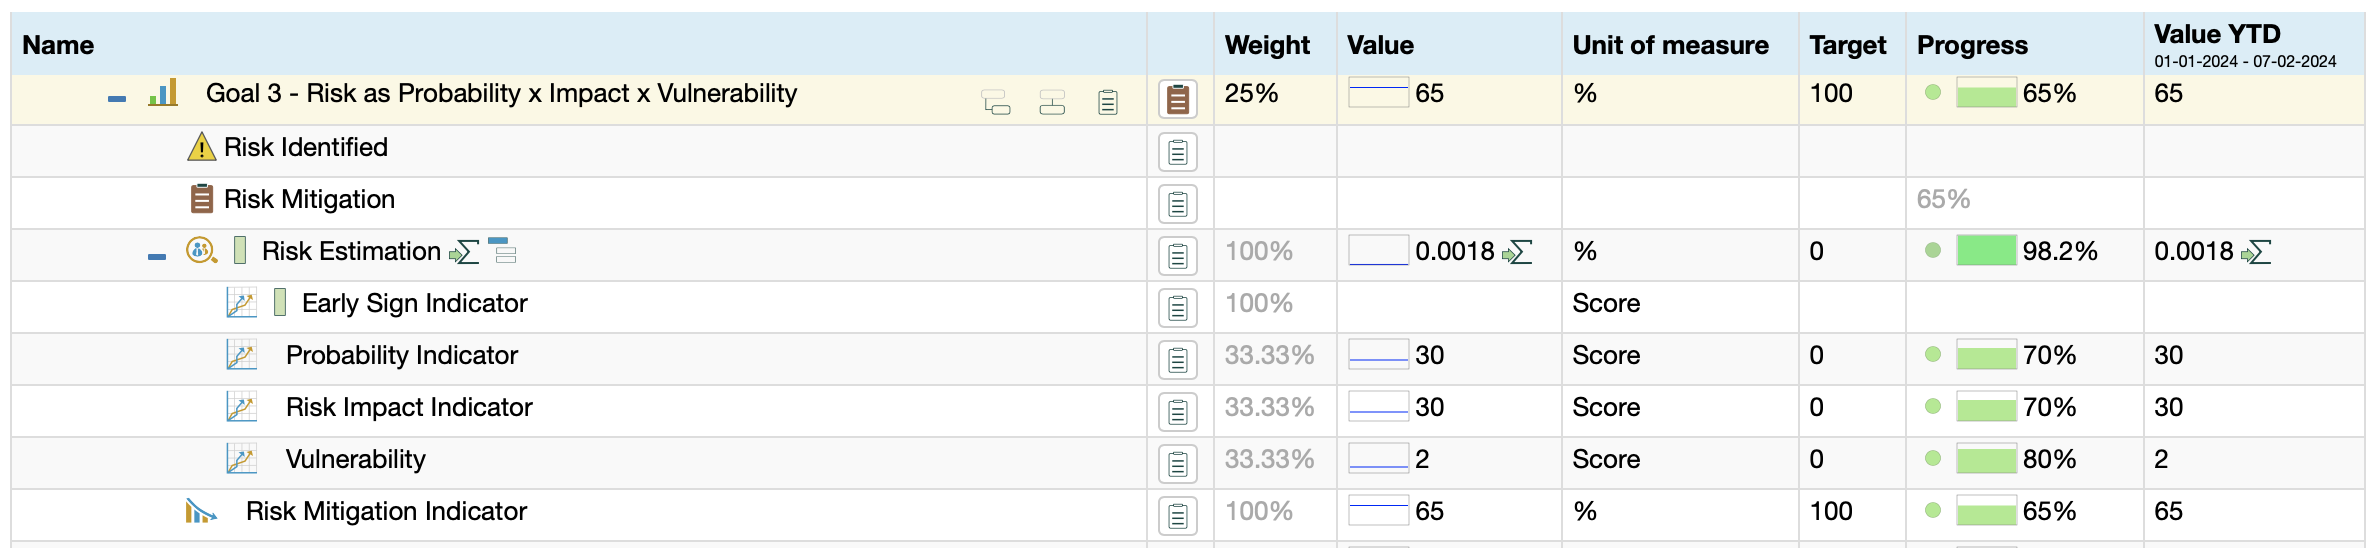
Goal 3 is similar to Goal 2; in addition, it includes Vulnerability in the risk estimation.
- The Risk Estimation is calculated as Probability x Impact x Vulnerability.
- The software uses absolute values for Probability, Impact, and Vulnerability.
- Vulnerability is calculated according to the CVSS scale on the 0..10 scale.
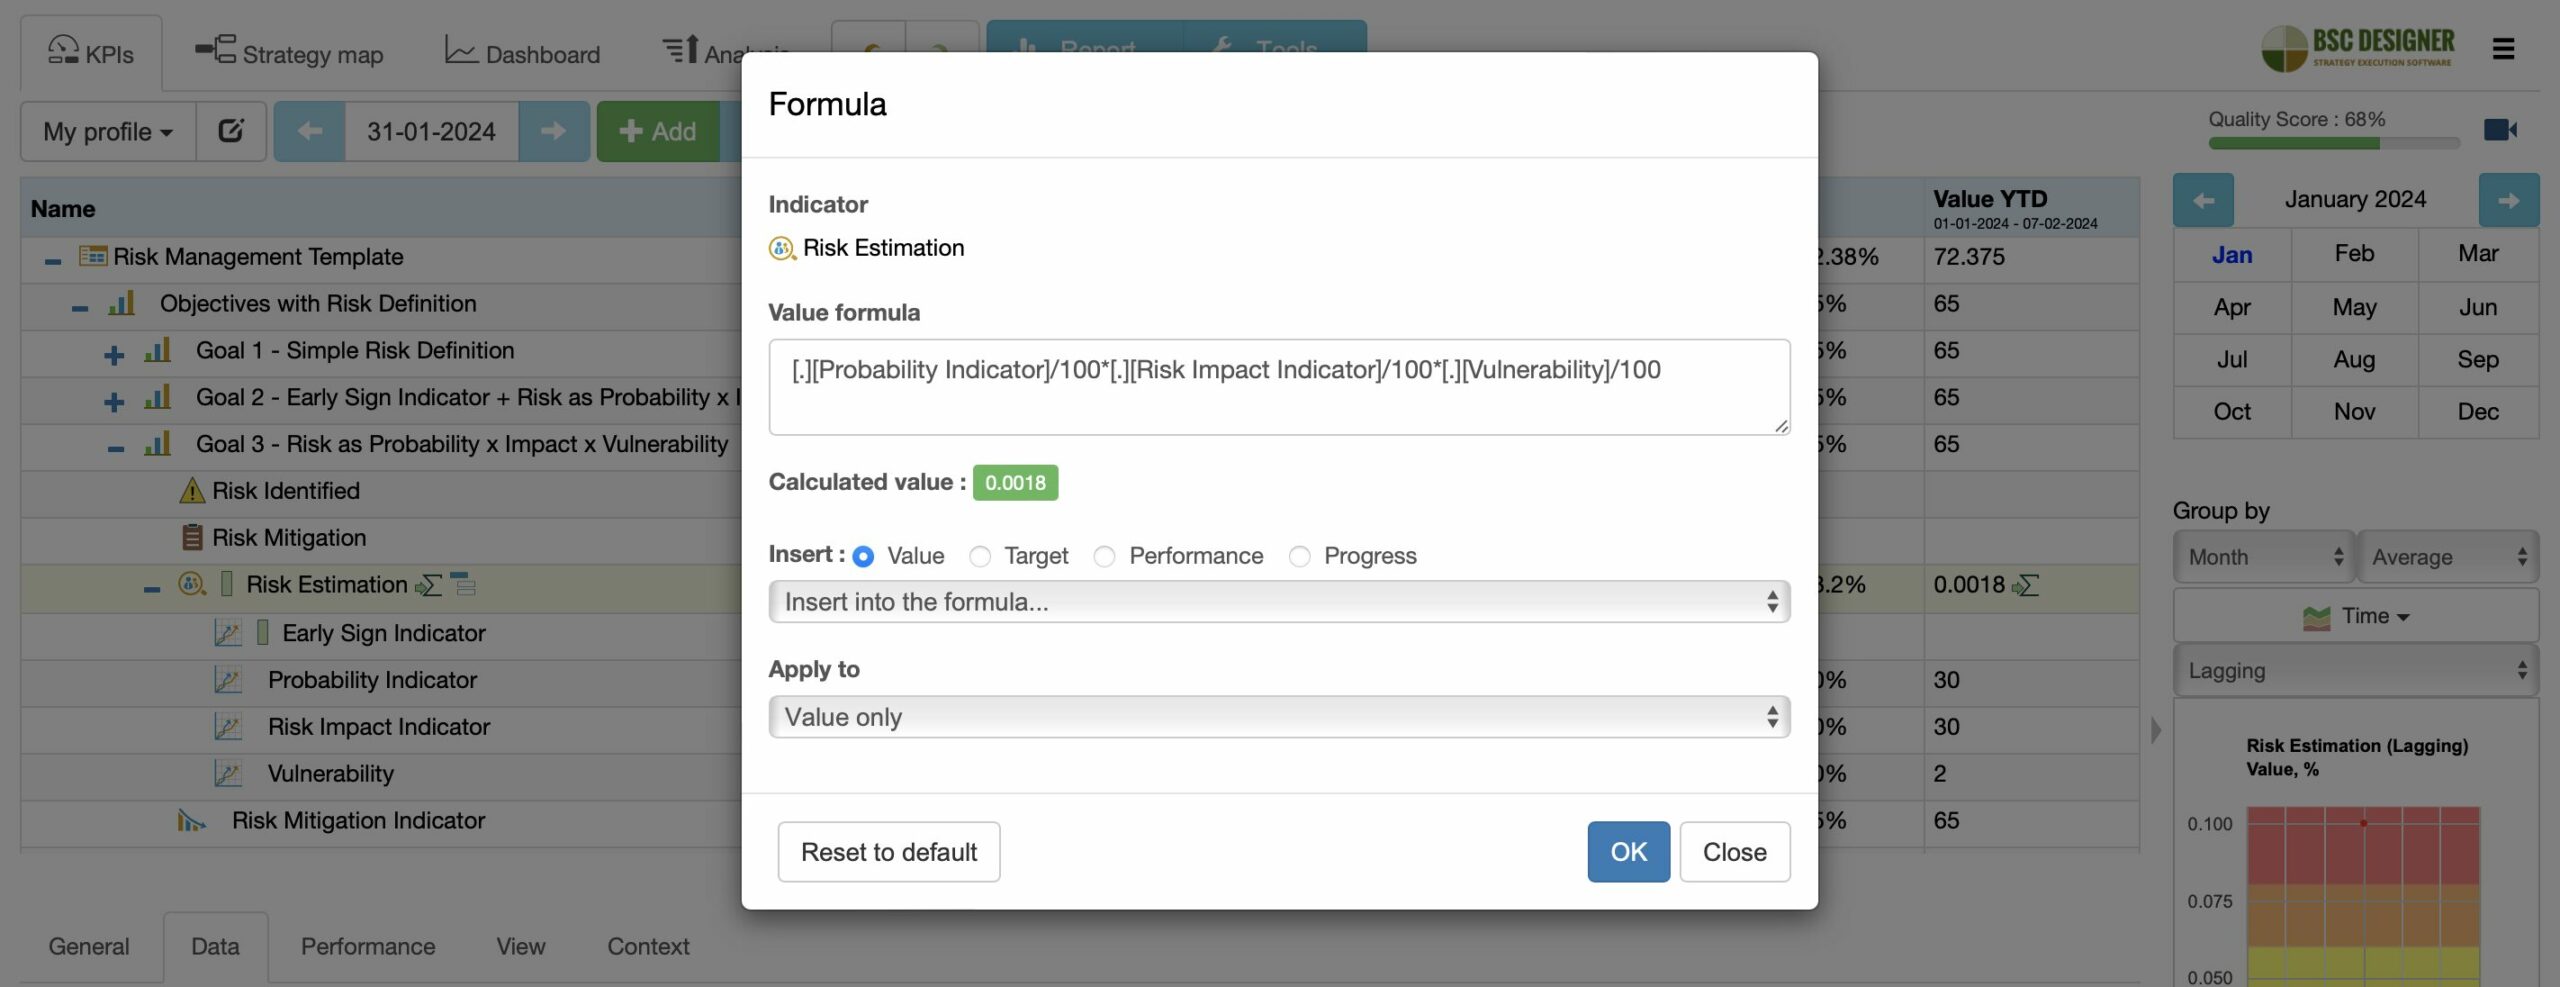
The [.] symbol in the formula instructs the software to search for indicators within the Risk Estimation container. Configured in this manner, the risk estimation model becomes easy to copy and reuse in other scorecards.
Reporting Incidents: Weighted Risk Index
The “Weighted Risk Index” is an example of how risk events of a similar nature can be quantified and reported.
The risk impact index includes indicators of the number of risks of different types weighted according to the severity of the incident.
Tracking the number of incidents in this way helps prevent the gaming of the risk measurement system, where the possible bad performance in terms of preventing critical events is masked by the good performance of managing a high number of minor events.
Conclusion: Integrating Risk in Strategic Planning
We are no longer talking about separate disciplines of risk management, compliance, and governance. The rapidly changing business environment forces organizations to look for an integrated GRC framework.
As outlined in our Strategy Implementation System, the practical implementation includes:
- Breaking down complex problems into specific areas, managed by dedicated strategy and function scorecards.
- Formulating goals with appropriate risk definitions, indicators, and initiatives.
- Focusing scorecards on areas of interest, such as compliance, cybersecurity, or the supply chain.
- Follow our
 Strategy Implementation System to align stakeholders, strategic ambitions, and business frameworks into a comprehensive strategy.
 - Automate strategic planning with BSC Designer by organizing goals, initiatives, risks, and KPIs into scorecards.
More About Strategic Planning


![]() CEO | Author | Speaker
CEO | Author | Speaker
BSC Designer is strategy execution software that enhances strategy formulation and execution through tangible KPIs. Our proprietary strategy implementation system reflects our practical experience in the strategy domain.
Your free use tool does not seem to contain specifics for application/product security risk score card creation. I am think of companies which are suppliers of software products into a semi-regulated industry or where regional cybersecurity laws apply to the company because they are a supplier to a Critical Infrastructure Service Provider (CISP). Also, I am looking at trying to map technical risks (eg, embedded OSS component CVE and CWE) to the customer impact business risks of releasing a product with those known, open vulnerabilities in the product image. And, YES, software products are released with known, open vulnerabilities.
Hi Frank, actually users can setup any indicators they need in the software, including the risk metrics that you mentioned. As for having them as a template, it’s a tough topic as in the best case indicators should be tailor made for a specific organization. We’ve gave a general guideline/starting point in the article about measuring quality (https://bscdesigner.com/quality-kpis.htm)
hola, necesito costo para que me ayuden a crear una matriz de riesgos, ya tengo el diseño y las formulas, pero necesito pasarla a un nuevo formato, necesito el costo.
Hello Cindy, I believe the article gives some starting points in terms of creation a risk scorecard. Additionally, you can find support/consulting options available on the Pricing page. Feel free to contact our team to discuss the details.