Master your KPI-finding skills: learn what KPIs are, use template to come up with the best ones, get inspired by examples from a long list of indicators.
Key Topics:
-
- Introduction to KPIs – What is a KPI? Why use KPIs?
- Feeding vs. Teaching to Fish – Why standard KPIs don’t work
- KPI Template – 12 steps to a perfect KPI
- KPIs Library – 6 Essential KPIs, List of Standard KPIs
- KPIs Implementation – Owning KPI vs. Tracking KPIs, KPIs Calculation
- Frequently Asked Questions
Introduction to KPIs
Let’s start the discussion around KPIs. I believe the buzz word “KPIs” is now everywhere, and some of you might doubt their usefulness:
- For some reason, top managers are not satisfied with “just doing things,” but they want to see some KPIs.
- You might know people who hate KPIs and know how to game the system.
In my opinion:
KPIs done in the right way are not just a helpful business tool but an excellent way to make everyday jobs easier and more transparent.
What is a KPI?
I gave a formal definition of KPI in the previous article. We tracked the path of KPIs from “quantification” to “metric,” “measure” and “indicator.”The problem is that formal definition has nothing to do with business realities.
Our practical definition is the following:
KPI is a quantification of an important business challenge.
This definition explains the nature of a KPI (it is an indicator, a numerical value), and it underlines the importance of the connection between KPI and real business challenges.
Why use KPIs?
Sometimes, we see that organizations sabotage the use of KPIs. They do KPIs formally but don’t benefit from them. Look at the statements below; probably, some of them will sound familiar to you:
We have some KPIs, and we look at them regularly.
Yes, we are tracking our performance! We have a dashboard with some nice charts!
We have found the list of some good KPIs for customer support, and we are now tracking them {but there were no actual changes}.
We have some KPIs, and we look at them once a year.
Yes, we are tracking our performance! We have a dashboard with some nice charts that we use for presentation slides only!
We have found the list of some good KPIs for customer support, and we are now tracking them, but we don’t act on them.
So, what’s wrong with KPIs? And how to do KPIs in the right way?
Intuitive Indicators in SMB
If I had a choice to:1) run a business with bad KPIs
or
2) run a business using the intuition of my team only
I’d prefer the second choice! Bad KPIs are really harmful and demotivating!
Ask any small business (SMB) owner – how does he or she decide about buying some ads?You will learn that the decision is actually fact-based, and there are probably some hidden indicators implied.
Those intuitive indicators are often much better than those that one can find on the Internet.
Numbers don’t lie
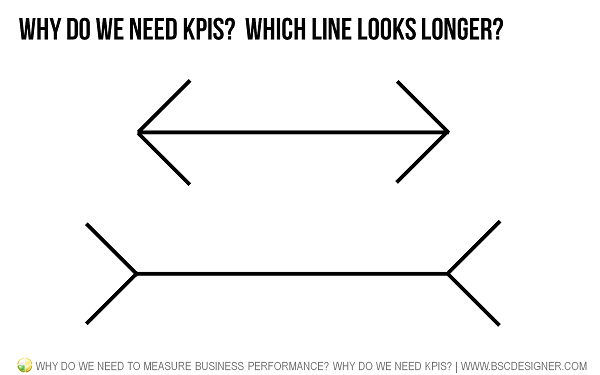
Have a look at this picture. Which line looks longer?That’s a simple demonstration that shows that our perception of things is not the best one (the lines actually have the same length).
We are not programmed to make precise measurements, and that’s why sometimes our intuition fails and takes us to the wrong conclusions.
We need to measure things!
Indicators help to define things
Let’s get back to the previous illusion example.
- What line were you measuring?
I did not ask you about the length of horizontal lines!
That’s another use of good indicators.
When we define the way to measure something, we actually agree about the meaning of the measured subject.
Are you talking about the abstract idea of “quality” or are you talking about a very specific idea of “number of critical problems found by users within the last 6 months”?
Feeding vs. Teaching to Fish
There is a saying:Give a man a fish, and you feed him for a day. Teach a man to fish, and you feed him for a lifetime.
Applying this idea to the KPIs, I could compare ready-to-use KPIs with a fish, and your skills in finding good indicators with an ability to fish.
- One can pick the ready-to-use KPIs (see the KPIs library below),
But
- A much better choice would be to learn to find tailor-made KPIs.
I won’t decide for you. Below, you will find the long list of KPIs that you can use to get some inspiration about ways to quantify and track your challenges. If you prefer to master your ability to fish, I would recommend you start with this 12-Step KPI System.
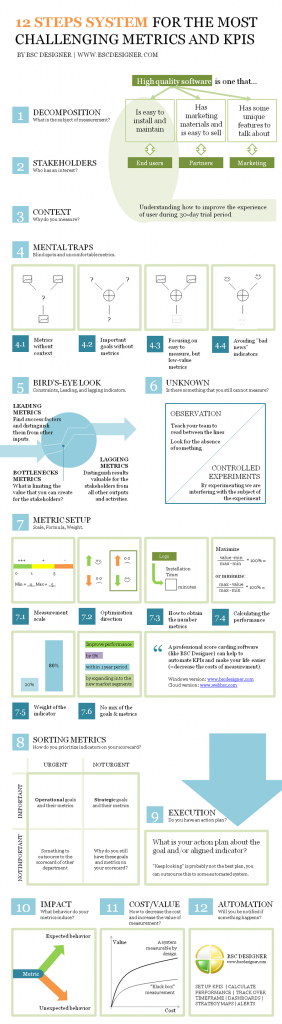
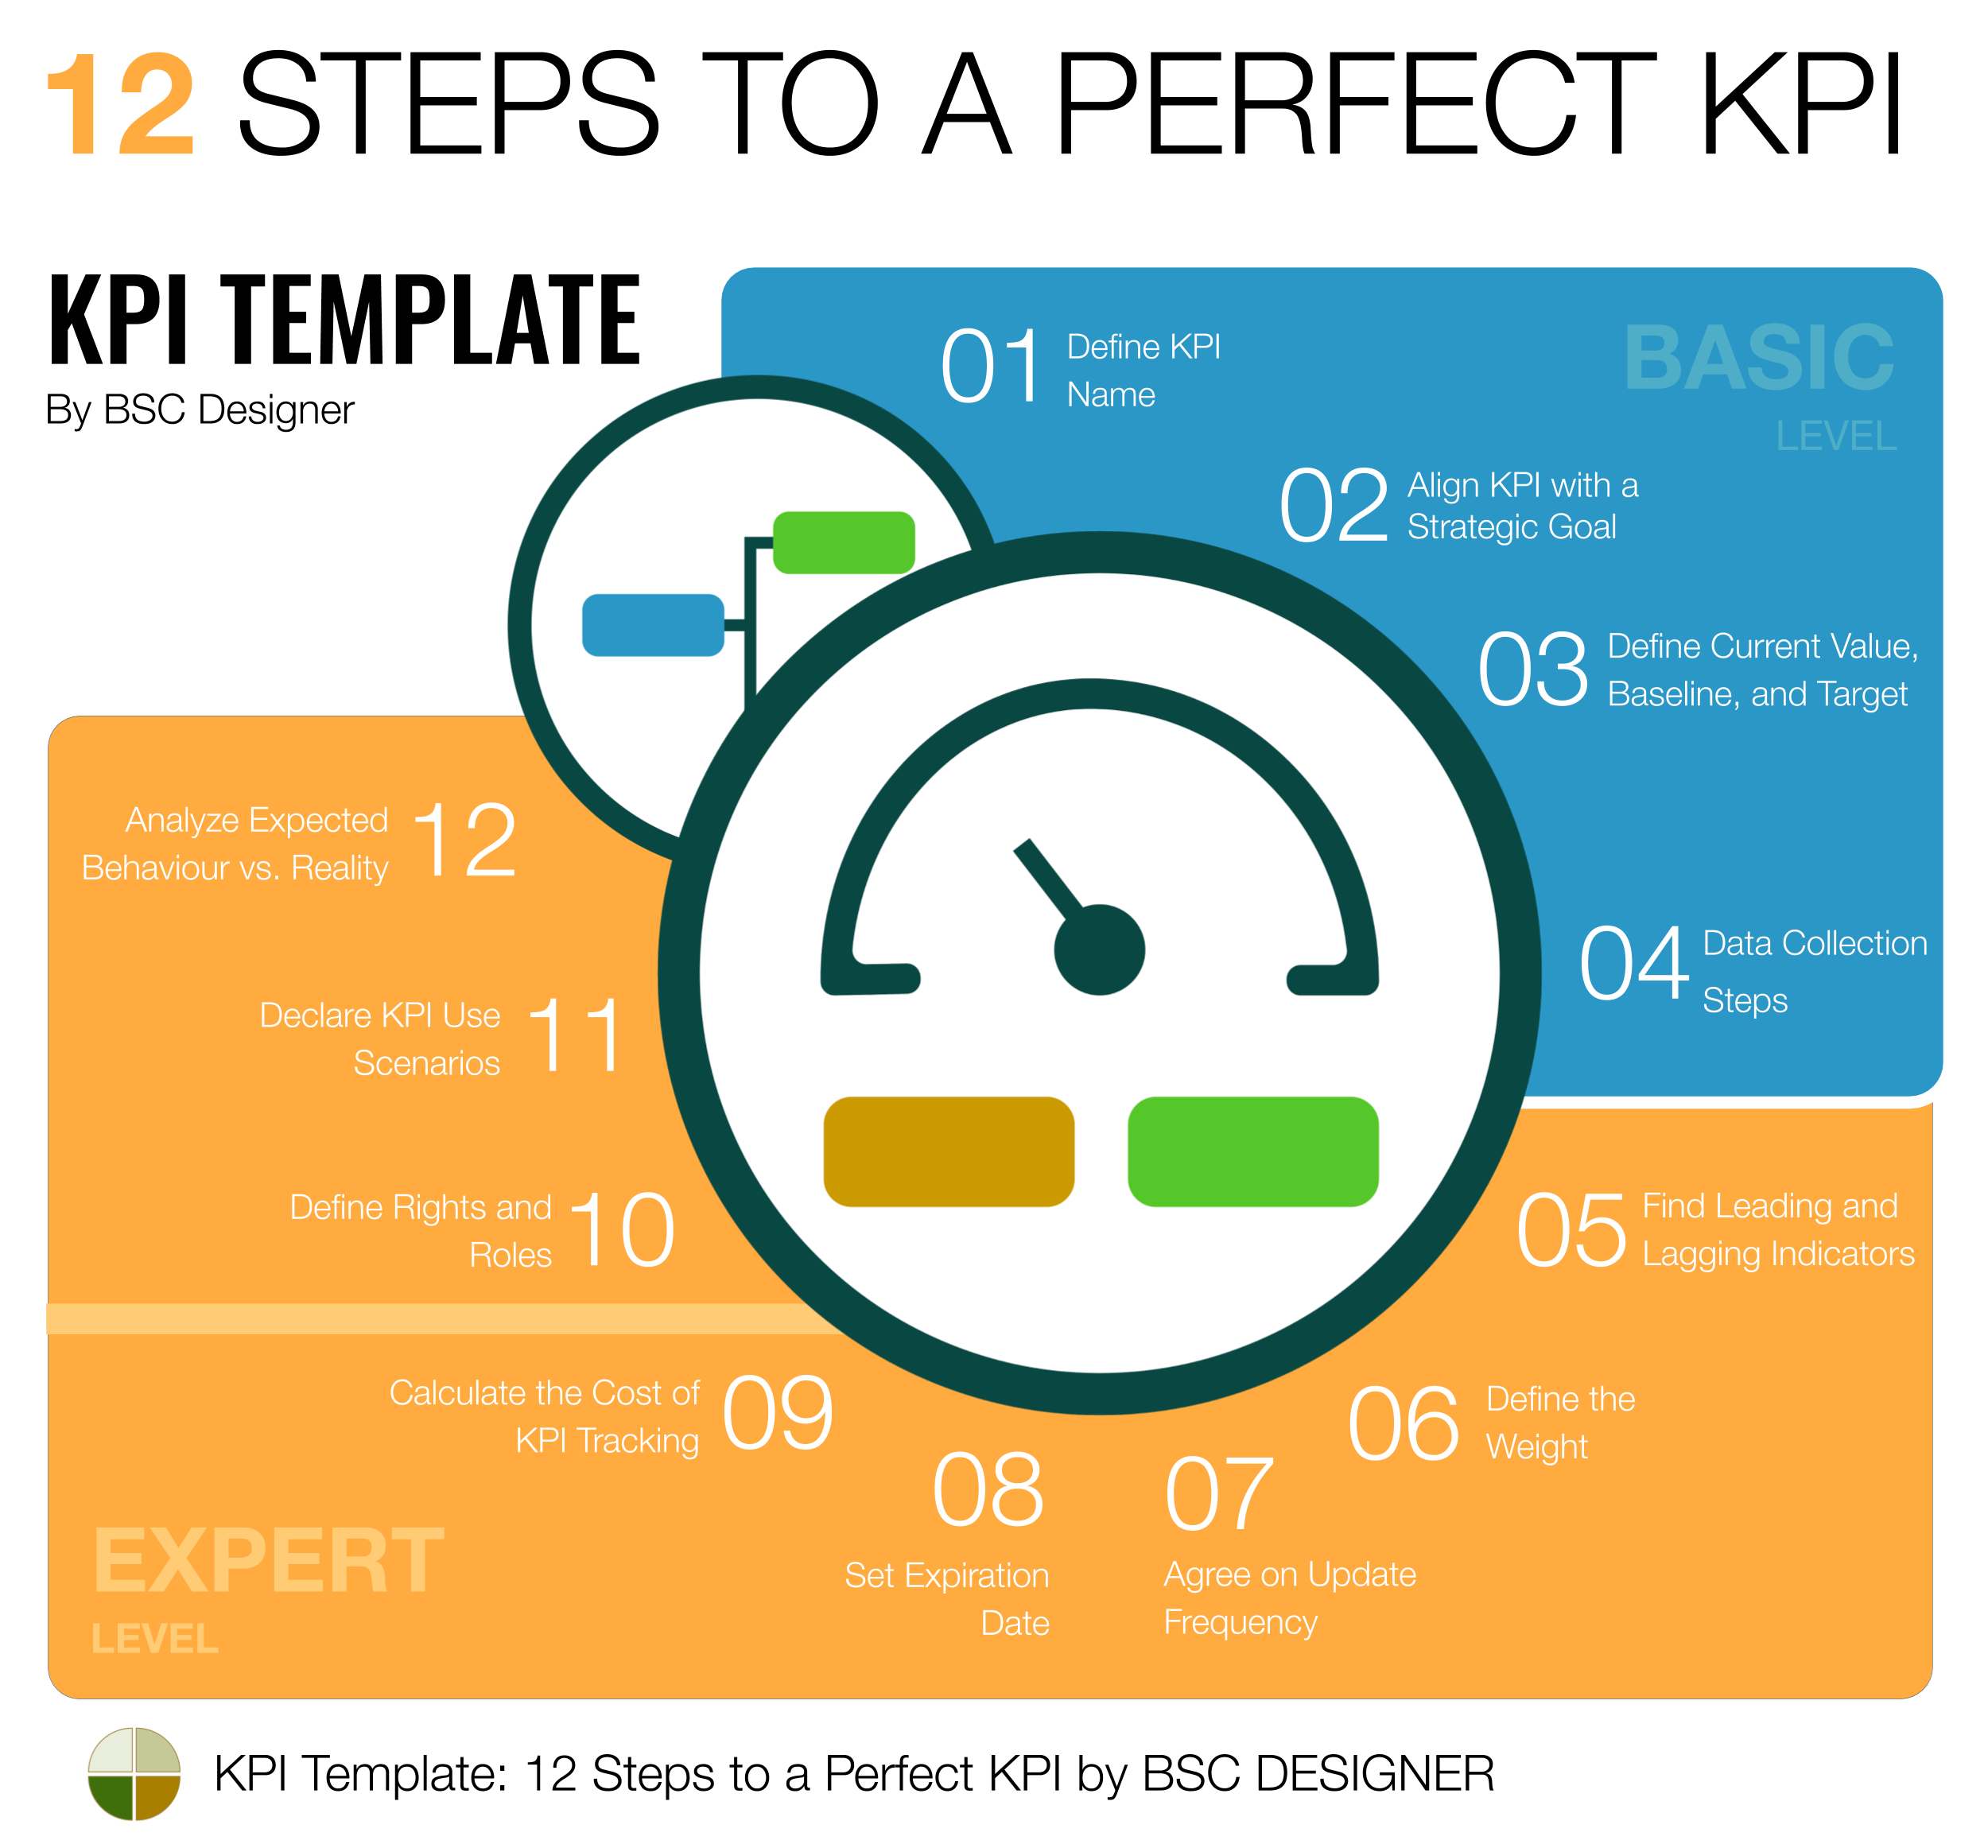
KPI Template: 12 Steps to a Perfect KPI
Here you have a template for your new KPIs. This is an executive version KPI system. The template is divided into:
-
-
- Basic Level – with must-have settings for a KPI
-
and
-
-
- Expert Level – with some ideas to excel your performance indicators
-
For users of BSC Designer software, I’ve added some explanations about automating discussed ideas with the software.
Basic Level
1. Define KPI Name
Avoid mixing together target, time scope, measure units, and KPI name.
For example: “Increase sales by 15% within 1 year” is not a recommended name. A better approach (my arguments are explained in KPI System) is to define separately:
- KPI name (“Sales”)
- KPI optimization function (in this case “increase”)
- KPI target and timeline (current sales + 15%)
- KPI measure units (% or $)
2. Align KPI with a Strategic Goal
The worst thing that can happen with KPI is that it will be measured without any particular purpose. Know the business goal behind the indicator.
Why do you measure certain KPI?
- You measure sales because you plan to increase revenue.
- You measure agent response time because you want to improve customer service.
- You measure the number of lines of code because you … hm… is there a good strategic goal behind it or should we better measure the % of returning problems instead? (like we discussed in the article about quality KPIs).
Strategic word in the title of this paragraph is not just a business jargon. Try to find a goal focused on changing the way you do things, not just on doing what you did before a little bit better. We discussed this before, the difference between strategic and operational goals. Respectively, the best KPIs should be aligned with strategic goals.
3. Define Current Value, Baseline, and Target
What is a current value of the indicator? Do you plan to achieve a certain value or keep the indicator’s value within certain tolerance levels?
You need to normalize the indicator. You need to do it for several reasons:
- Reason 1. We need some reference with which to compare the current indicator value. Customer satisfaction is equal to 70%… it is good or bad? When having reference points (the baseline and the target), we can answer this question.
- Reason 2. We need to put the current value of the KPI on a certain scale to make the indicator comparable with others. Without this, we cannot compare the performance of an indicator measured in “$” with the performance of another indicator measured in “hours.”
Having the baseline and target, we can calculate the performance of the indicator.
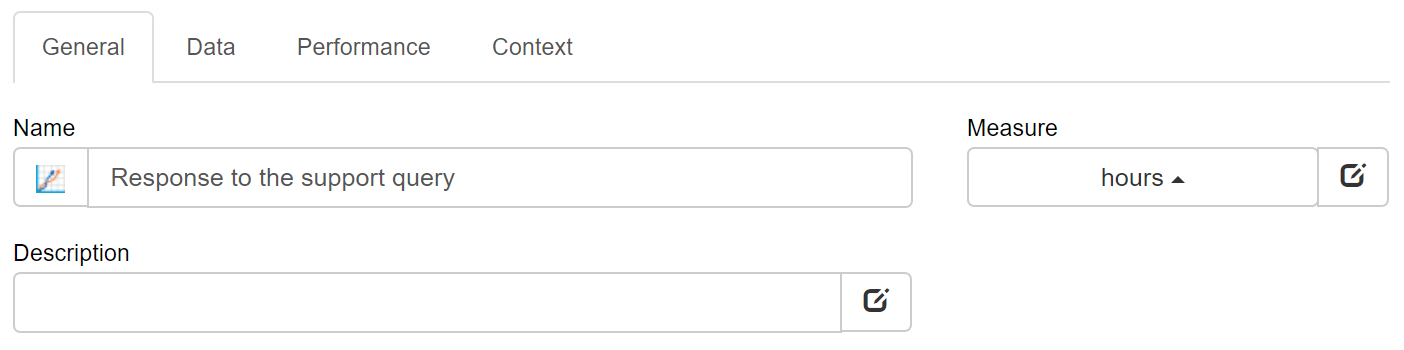
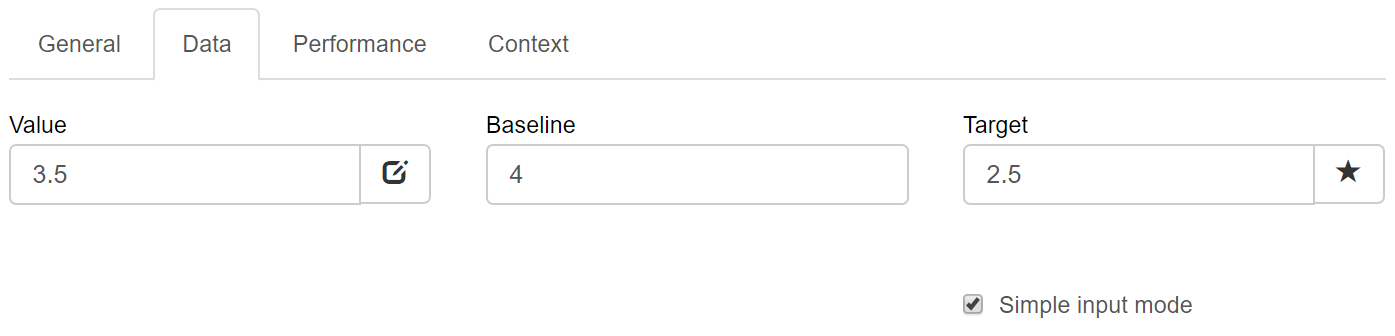 Use the “Performance” tab to select the proper Optimization function. The calculation of performance is done automatically.
4. Define Data Collection Steps
Do you enter the values of the indicator manually? Is it updated from an Excel spreadsheet automatically, via Zapier connector or RESTful API? Do you connect directly to the database?
In the previous step, we defined the baseline and the target. Most likely, these values will be entered manually.What about current value? How do you plan to update it? You need to define a standard procedure that the person responsible for the KPI will follow to update the indicator. The best approach, of course, is to make the update 100% automatic.
We did the basic level. If you have enough resources and political power in your organization, I do recommend that you proceed to the “Expert” level.
Expert Level
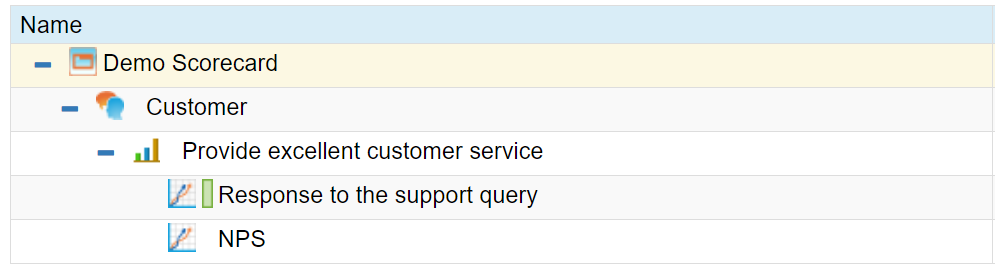
5. Find Leading and Lagging Indicators
In the context of your business goal (see Step 2 above), is your KPI leading or lagging? What is its leading (lagging) pair?
Before, we discussed the difference between leading and lagging indicators:
- Leading indicators are related to success factors and help in predicting the achievement of the goal.
- Lagging indicators are related to the results and help to validate the achievements.
The trick is that we often focus too much on just one type (normally the lagging one) and forget about the other.
Do you need a practical example?
Let’s say we measure NPS (Net Promoter Score) that is the lagging indicator in the context of “Improve customer service” goal, but we don’t track anything related to improving NPS. A leading indicator pair for NPS can be product quality or customer service responsiveness.
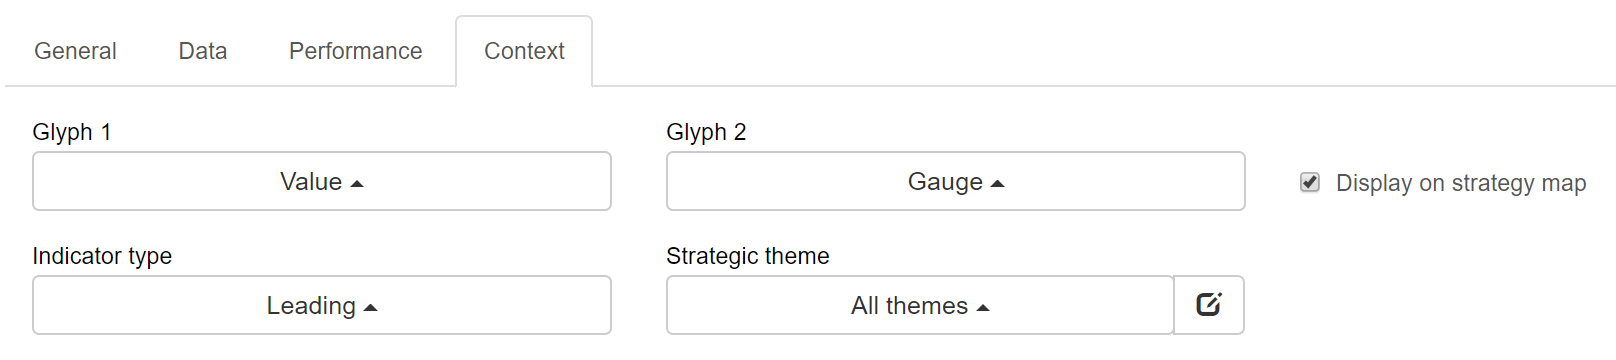
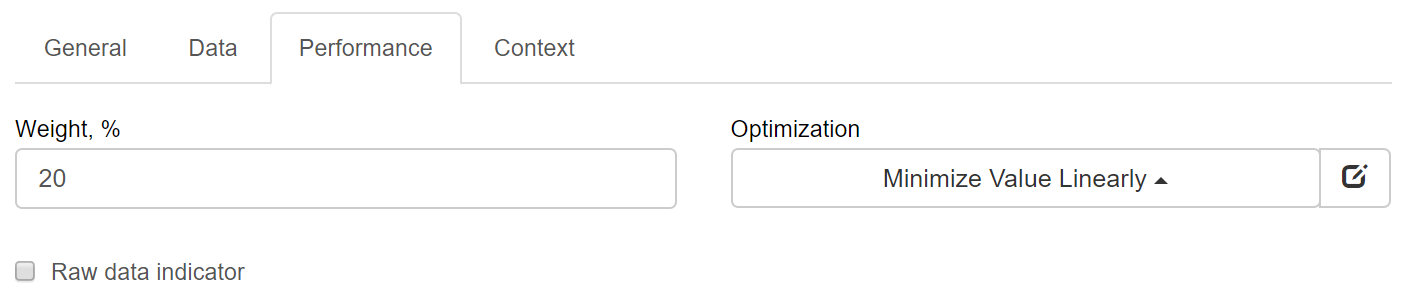
6. Define the Weight
Define the weight of the indicator compared to other indicators aligned with the same goal.
The weight of the indicator and its calculation were explained in the scorecard calculation article. Define the weight for the goals and indicators to be specific about their relevant importance.A classic example:
- In the context of the “Improve customer service” goal, the “Response time” and “First call resolution rate, %” indicators should be calculated with different weights.
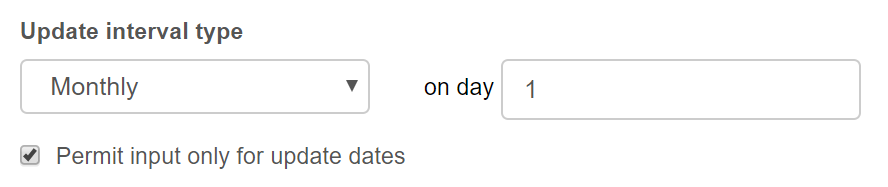
7. Agree on Update Frequency
How often do you plan to update the indicator?
8. Set Expiration Date
Plan to review your indicator regularly. Did the business goal change? Did the cost of measurement increase?
Sometimes, we measure something just because we did it before. Your business strategy changes, respectively, your KPIs should change as well.For example:
A company on a startup stage might be interested in tracking the number of meaningful conversations with their prospective clients (like we discussed in the startup KPIs article).
An established business will also be tracking interactions with clients, but the toolkit and the metrics will be different, like for example, customer surveys.
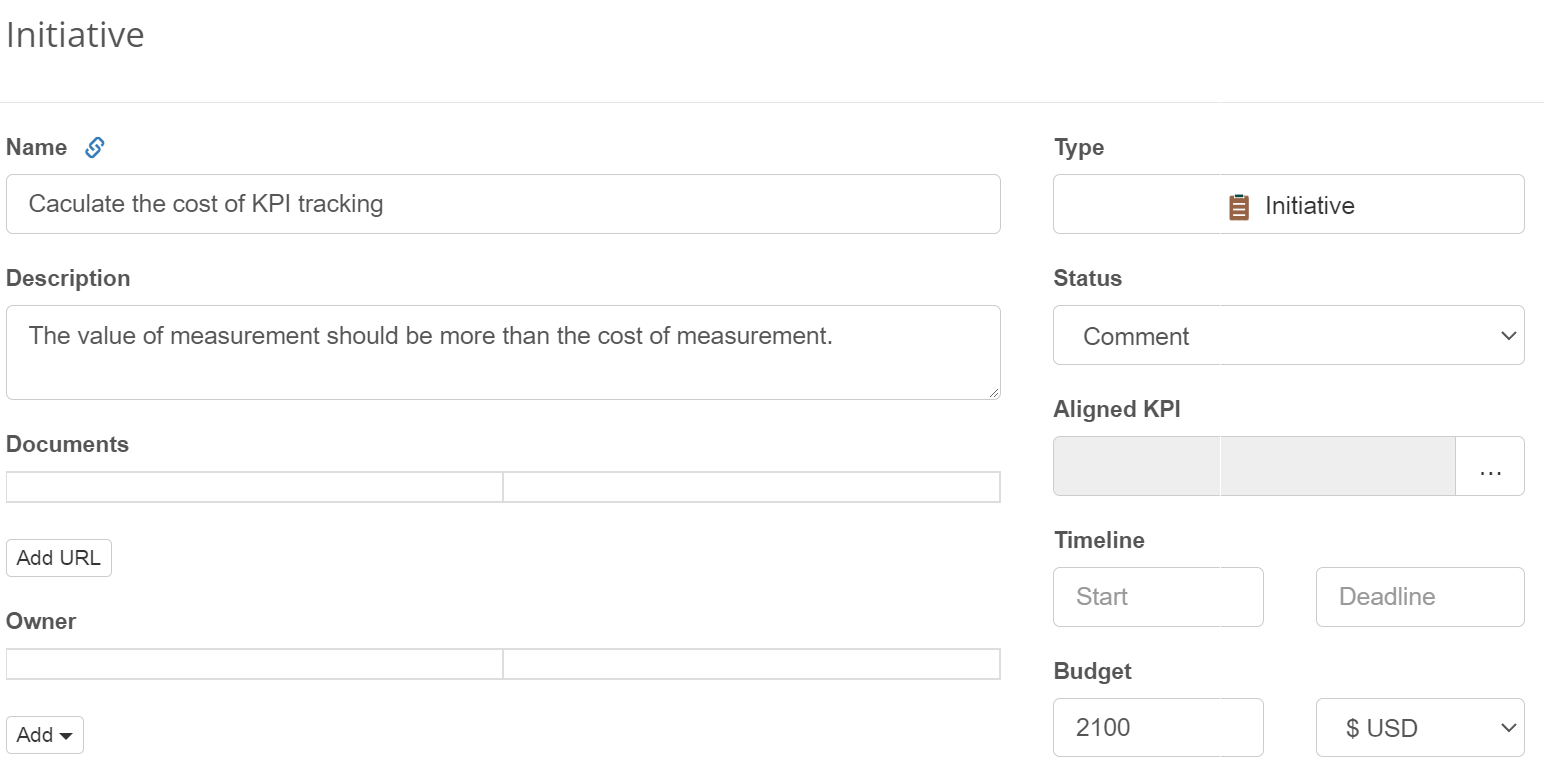
9. Calculate the Cost of KPI Tracking
Obviously, the value of measurement should be more than the cost of measurement.
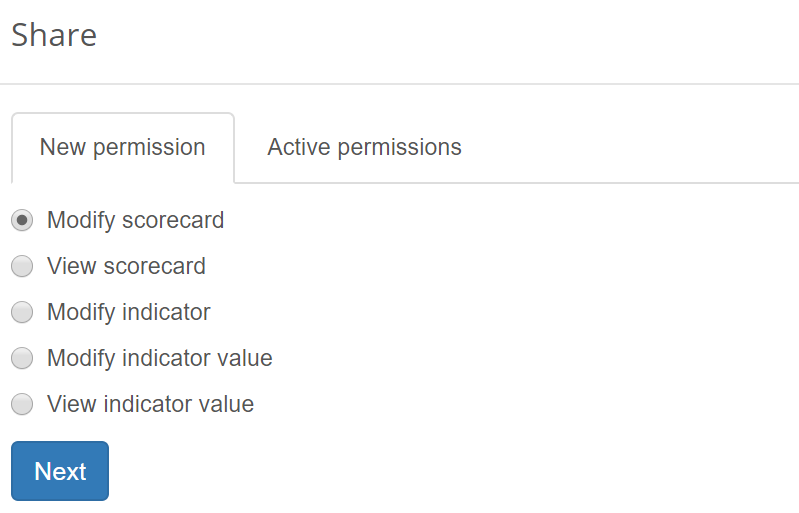
10. Define Rights and Roles
Who has access rights to see this indicator? Who is responsible for data collection? Can this person change historical data? Who is responsible for acting when the indicator goes into the red zone?
Look at the KPIs life-cycle:
- KPI definition
- Data collection
- Data analysis, use, and reporting
- KPI actualization and retirement
Different stakeholders are involved. Decide early on the roles and access rights.
- Decide how transparent you want to be with your team.
Don´t build unnecessary information silos.
In BSC Designer: the administrator of the account can assign access rights on the levels of scorecard or specific indicator. User settings allow limiting access of data input users to the historical data.
The persons responsible can be specified in the Initiatives for the KPIs.
11. Declare KPI Use Scenarios
How do you plan using this indicator? For annual performance reporting? For bonus calculation? For self-control?
Declare KPI usage scenario for two reasons:
- Reason 1 (obvious one): explain how exactly you plan to use the indicator and its findings.
- Reason 2 – achieve a certain trust-level by letting the team know how you are going to use the data obtained and how you are not going to use it.
In my opinion:
The most dangerous case is when you use KPIs to calculate bonuses. We discussed before what will most likely happen.
If you don’t plan to align KPIs with bonuses, then make sure you explain clearly to your team how the metrics will be used. Look at the self-appraisal approach promoted by the OKR framework.
- Probably, your team will finally start loving their KPIs.
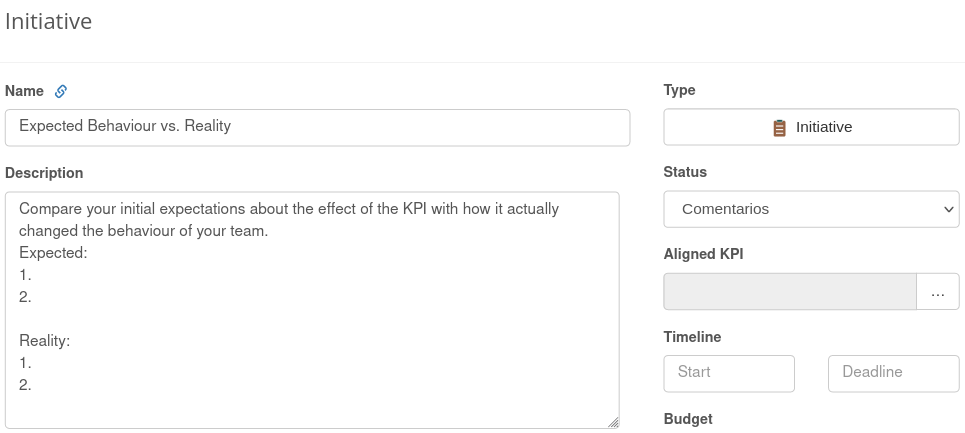
12. Analyze Expected Behaviour vs. Reality
Compare your initial expectations about the effect of the KPI with how it actually changed the behaviour of your team.
For example:
- You implemented near miss reporting in order to improve quality,
but
- This “improvement” resulted in fewer incidents being properly reported…
It might happen, so make sure you plan to review behaviour induced by the KPIs to compare reality with expectations.
Found something unexpected? Plan to update your KPIs!
Why Standard KPIs Don’t Work
It’s easy to find a long list of KPIs on the Internet. Here are some reasons why standard KPIs won’t work for you.
KPI is a model of reality, not the reality
Let’s take “unit market share” as an example. In the “Tim Cook: The Complete Interview” by Sam Grobart, Apple’s CEO shared his thoughts on measuring success:
“I don’t measure our success in unit market share,” “… We’re not in the junk business.”
Tim Cook’s recipe is to focus on doing the right things.
Most standard KPIs are lagging indicators
In other words, these KPIs are very good at telling the story of what has already happened but don’t help much to improve.
It’s good to know revenue per employee of your business; probably, you can benchmark it to other companies and find out that it is too high, but it doesn’t automatically result in the improvement. You need to:
-
-
- Analyze the situation
- Understand the reasons for the challenge that you are facing
- Define success factors
- Quantify them if possible (leading metrics!) and
- Act
-
With standard KPIs, you skip the first three steps, and that’s the reason the action plans based on standard KPIs often fail.
Goals Come First
To finalize the introduction to the KPIs, I’d like to make a simple statement:
Business goals should come first!
KPIs that appear on the scorecard/dashboard should appear there only when you have got a clear idea about the current goals of the organization and how they are connected.The best practice is to create a strategy map first, map your goals, and only then start looking for the ways to measure them. That’s what we have discussed in the Four Perspectives of the Balanced Scorecard
KPIs Library
![]() Here is a KPI library.
Here is a KPI library.
- Use it to get some inspiration about KPIs and support in some way the discussions around your strategy.
- If you have found some KPI that looks interesting but doesn’t resonate with your goals – skip it.
Here is what you will find here:
6 Essential KPIs
Let’s start small.
If you had limited time and resources, what KPIs would you track?
How would you find them? I would recommend looking at these two:
- Look at how things are working now and try to find bottlenecks
- Look at where the money is coming from and what are the success factors of this magic.
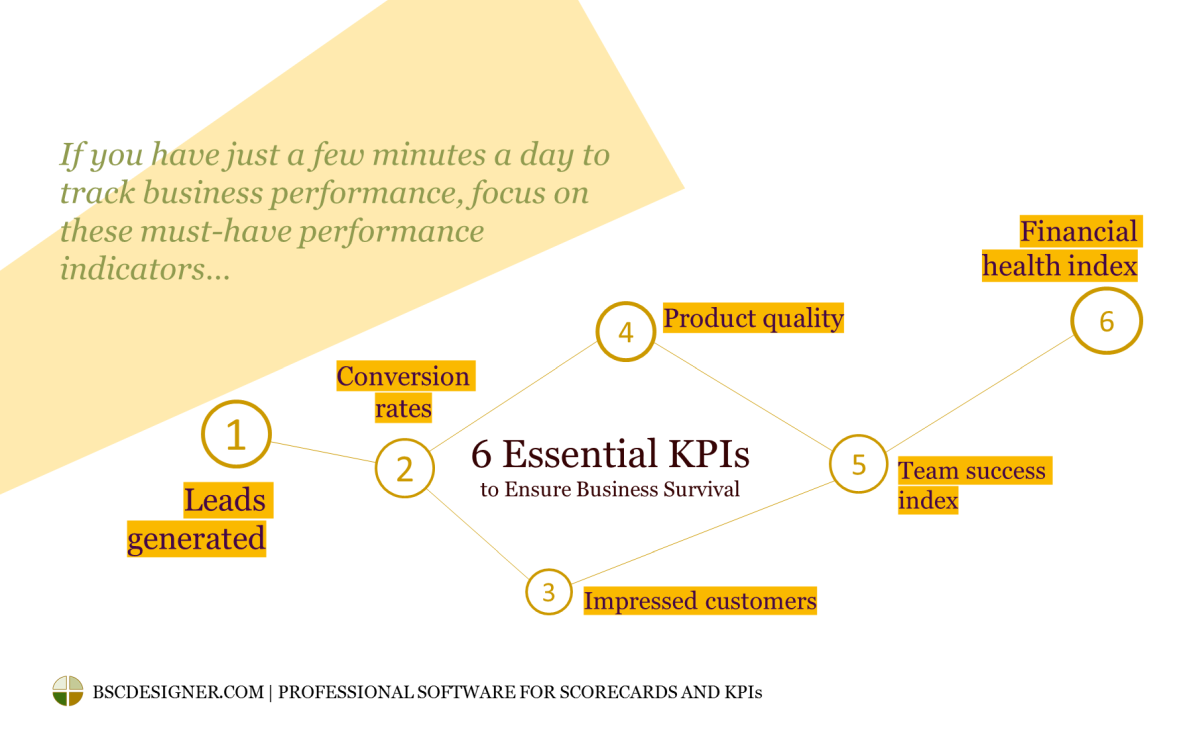
That’s basically what we did in the 6 Essential KPIs to Ensure Business Survival article.
What were the results?
- KPI 1. Leads generated. Acquisition numbers.
- KPI 2. Conversion rates. The most critical ones: like conversions from lead to sales; from first-time purchase to return purchase.
- KPI 3: Impressed customers, %. It’s just about customer service; it’s about powering your word of mouth marketing.
- KPI 4: Perceived product/service quality. We discussed what perceived means in the customer perspective of the Balanced Scorecard.
- KPI 5: Team success index. A set of metrics to track the challenges of your team. Can be just one “retention rate,” or you can define success factors and come up with something interesting.
- KPI 6: Financial health index. A set of financial metrics that make sense in your case – can be just two – acquisition cost (CAC) and customer lifetime value (LTV).
In the original article, you will find some more details and explanations.
Standard KPIs
Below, you will find some standard KPIs from different domains. We have compiled the list of these KPIs from different articles published on our website, so if you want to know more about some of them or understand the business context, just follow the “read more” link.
Customer Service KPIs
- Cost per inbound contact
- First-line resolution rate
- Self-service completion rate
- First contact resolution rate
- Average speed of answer
- Satisfaction by the customer service
- Agent training hours
- Agent occupancy
- Agent satisfaction
- Turnover rate among top performers
Learn more in the customer service scorecard example.
Marketing KPIs
- Sales qualified lead (SQL)
- Total Leads
- Marketing qualified lead (MQL)
- Lead to Marketing Qualified Lead (MQL) Ratio
- SQL to Sale
- Cost of Customer Acquisition (COCA)
- Marketing Expense per Employee
- Marketing Expense as a Percentage of Revenue
- ROI by Marketing Channel
- Customer lifetime value (CLV)
- Revenue per Marketing Qualified Lead (MQL)
- Deals closed
- Media mentions
- Owned reach
- Brand awareness
- Website SEO metrics
- Adjusted Bounce Rate
- Email Marketing Metrics
- Cost per lead (CPL)
- MQL to SQL Ratio
- Net promoter score (NPS)
- Returning visitors
- Referrals and reviews
- Customer Retention
Learn more in marketing scorecard example.
HR KPIs
- Staff engagement
- Commitment to talent management
- Diversity
- Quality of leadership
- Adaptability
- Performance of New Hire in 6 months
- Speed of Hire
- Quality of Hire
- Time To Productivity
- Percentage difference in productivity before and after training
- Percentage of employees that participate in career coaching
- Profit per employee
- Voluntary turnover
- Involuntary turnover
- Involuntary turnover high performers
Focused on quality:
- % of employees coming via referral
- Performance level of new hire after 1 year
- Performance level of new hire after 3 years
- % new hires completing probationary period
- % of new hires present after 1 year
Focused on time:
- Cost To Hire
- Time to Hire
- Profitability of new hire
- Time to find required number of qualified candidates
- Yield ratio
- Time reduction achieved, %
- Cost reduction achieved, %
- Return problems rate, %
- Performance improvement, %
- Improved qualification/skills results, %
- High performers turnover, %
- Employee Engagement Index, %
- Talent’s ROI
- Revenue per FTE employee
- Hiring costs
- Number of HR admin per head
- Time spent on HR administration
- Case Handling Time
- Employee Satisfaction with Case Management
- % of Cases Solved
- Reduced employee turnover
- Time spent training HR SSC staff
- % of mission critical employees retained during the M&A process
- % of mission critical employees retained 6 months after the M&A process
- % of mission critical employees retained 2 years after the process
- Decline in staff engagement during the M&A process
- Decline in productivity during the M&A process
- Time taken to return to pre M&A productivity and engagement levels
- Number of value added roles created during the M&A
- Increase in concentration of exam qualified staff after M&A
Sales KPIs
- Reach rate
- Pas rate
- Conversation to lead conversion rate
- Qualified leads close rate
- Conversion rate to sales
- Quantity of leads needed in sales funnel
- Conversion to qualified leads
- Average sales cycle time
- Time to answer a prospect’s query
- Total cost to gain a new customer
- Revenue per sales rep
- Customer lifetime value
- Returning customers, %
Learn more in sales scorecard example.
IT KPIs
- IT expense as a percentage of total expense
- IT expense per employee
- Support expense per user
- The number of critical problems reported by user
- Business system use
- Time to register a new account
- Account creation success rate
- Availability (uptime)
- Downtime related to security issue
- Mean Time Between Failures (MTBF)
- Mean Time to Repair (MTTR)
- The number of returning problems
- Restore success rate
Learn more in IT scorecard example.
Innovation KPIs
- Idea generating and capturing budget
- Hypothesis testing budget
- R&D budget
- Revenue from new projects
- Royalty income
- Costs optimized
- Perceived value metric (external clients)
- Perceived value metric (internal clients)
- Innovation pipeline index
- Diversity of ideas sources
- Number of touch points with stakeholders
- The number of improvement points found during the review
- Behavior change metric
- Ideas generated
- Idea to systematic discussion rate, %
- Discussion to hypothesis rate, %
- Hypothesis to tested hypothesis rate, %
- Tested hypothesis to implemented rate, %
- % of employees who passed training for innovation
- Training engagement index, %
- Minimal training exam score rate, %
- Innovation training behavior change index
- Time spent on discussing hypothesis
- Tools and funds availability
Learn more in Innovation scorecard example.
Employee engagement
- Resources and Tools Availability
- % of task with high expertise and involvement
- Number of feedback sent to employee
- Number of recognition received by employee
- % of ideas from employee reviewed in details
Learn more in Employee engagement scorecard example.
KPIs Implementation
Learn more about the best practices in implementing KPIs.
Owning KPI vs. Tracking KPIs
The key component of the successful implementation of the measurement system is a proper performance measurement culture.
What is the best measurement culture like?
-
-
- The KPIs are the product of discussion
- The KPIs are not mandated from the top but are organically suggested by your team
- The KPIs help to solve real business problems, not just do routine reporting
- The KPIs are clearly (unambiguously) defined
- The KPIs are not perceived as punishment but a way to make things better
-
How to achieve this? I would recommend checking out this 5-step guide for measurement culture where we discuss the cultural challenges and the ways to address them.
KPI Calculation
Once you have the list of KPIs, you need to do some calculations. These can be basic calculations of the performance score or more advanced calculations of the scorecard. We have discussed the challenge of the KPI and scorecard calculation in this article. Here, you have an executive summary:
1. Define KPIs properly
Define KPI’s values properly: baseline, target, current value.
Don’t mix the idea of target and goal (“improve customer service performance” is the goal and “… by 10%” is the target).
Decide if you need to increase the value (increase profits) of the indicator or decrease it (decrease response time).
2. Normalize KPIs
To make different KPIs comparable, we need to normalize them first.
Think about website visitors measured in “visitors/month” and time on site measured in “minutes.” We need to put both indicators on a certain scale to make them comparable. Learn more about metric normalization.
3. Track Performance and Progress
It makes sense to track separately performance and progress. The difference was explained here.
4. Assign weight to KPIs
The weight of KPI shows the relevant importance of the KPI on the scorecard. KPIs with higher weight will contribute more to the total performance.
5. Automation software is a must
Although you can start with a spreadsheet, it would be hard to scale the project without professional tools like BSC Designer.
Use Cases
Learn from other users of BSC Designer.
- We use BSC Designer for establishing Strategy Maps for our company, establishing strategic goals and KPIs on the BSC and trace the KPIs and targets using the software. >
We are using BSC Designer for a continuous reporting of security KPIs and in the future we may use it for all of our management processes. >
- We use BSC Designer to make a synthesis of a dynamic view of KPIs according to Kaplan and Norton Balanced Scorecard (BSC). >
We needed to set goals and KPIs to monitor, evaluate, review, and manage them using a powerful tool. >

Frequently Asked Questions
Below, you will find some frequently asked questions about KPIs and our answers to those questions. Feel free to ask more questions in the comments at the end of this article.
We are doing fine without any KPIs – do we need some?
It’s like using a GPS in your car. When you drive the route that you are used to driving every day, then most likely you won’t turn a GPS on. Does it mean that you don’t need it in more complex situations? The same can be said about KPIs. The more complex your business environment is, the more you need good KPIs. Above, we have discussed other reasons to use the KPIs.
Does “Implement new HR training program within 1 year” need a KPI?
Let’s look at the goal first. It sounds more like a milestone goal. At the end of the year, one can give a “yes/no” answer to the question of whether the program was implemented or not. The way that the goal is formulated now doesn’t imply an achievement of any performance results, so there is no sense in using key performance indicators.
If you would focus on improving the efficiency of HR training programs or reducing the operational costs, then this could be a good performance goal, and respectively, there can be used performance indicators.
What is a good KPI for “Improve employee morale by 15%” goal?
Let’s start with the way this goal is formulated. The goal, in this case, is “improve employee morale,” and “15%” is an improvement target. I would recommend dividing the goal and the measurement/target. The goal, in this case, is to “Improve employee morale.” A morale index might be used as a metric.
What KPI should we use for the “Double employee productivity” goal?
Many companies have such goals on their scorecards in order to motivate their staff. In my opinion, goals like this one have two major flaws:
- The goal is unrealistic: why exactly do we need to double the productivity; why not increase it by 10% or 30% or by 12.75%?
- It is not clear how to measure the productivity for tasks like marketing, software development, copywriting…?
Having said that, we need to update the goal to something like “Improve employee productivity” and get back to the basics and find proper KPIs.
Do we need software for our scorecard?
You are asking a vendor of such software, but I’ll try to be objective when answering… It depends on how serious you are about KPIs. If you need to maintain KPIs in several perspectives, calculate their performance, take into account their relevant importance, visualize them on strategy maps, then I would go for some professional software like BSC Designer.
I know some Excel gurus who can create a real state of the art scorecard, but the question is how hard is to maintain those scorecards? We have analyzed the cons and pros of this approach in a separate article.
If you don’t have a budget – start with BSC Designer Freeware, and then upgrading to the professional scorecard tool will be easier in the future.
Is a KPI that I have a “leading” or “lagging” one?
These terms are contextual; one KPI is leading or lagging only in the context of a certain business goal. To understand the difference, have a look at this article.
Can we use KPIs for creative tasks?
Yes, it is possible. For example, we have discussed the KPIs for graphic designer. The article starts with an example of how Salvador Dalí quantified artistic talent. A different question is what quantification is relevant in your case.
What is the correct term: KPI, metric or indicator?
When talking about terminology, there is a difference. It is a good idea to understand this difference and use the correct terms in each case. A practical experience, however, shows that the term “KPI” is used interchangeably. To stay on safe ground, I’d use “metric” or “indicator” as terms.
What KPI template do you recommend?
Actually, none of them. There are some popular industry-standard KPIs. Yes, they look very professional, and they might be a good starting point, especially if your boss just wants you to “find some KPIs.” The problem is that the impact of a few tailor-made KPIs designed by your team for your business goals is much higher than the impact of 50+ KPIs found on the Internet.
It feels like my team doesn’t accept new KPIs… What might be the reason?
Two most typical reasons are:
- Those KPIs are not aligned with real business problems
- The KPIs are not the product of the discussion
Have a look at the cultural aspect of performance measurement in your organization.
My employee allowed a KPI to move to the red zone. How should I react as a manager?
In my opinion, this situation is a chance to start a discussion about what can be done better in the future. That’s why we have KPIs: to understand our business better and to prevent problems in the early stages.
How do we cascade KPIs across the company?
Actually, we cascade by business goals. We’ve discussed this in detail in this article.
Do you recommend using KPIs for bonus calculation?
If you do it to control your team in a “carrot-and-stick” style, believe me, they are cleverer than you are, and they will find some ways to game the system. We have discussed possible approaches to the reward challenge in a previous article.
What number of KPIs do you recommend having on a scorecard?
Just a few KPIs will survive the proper discussion process. Others will be deleted or moved to the scorecards of the teams or individuals that work specifically on that problem. A good formula to have in mind is 1 business goal = 2 metrics (one leading/predictive and one lagging/result).
If you could give only one bit of advice about KPIs, what would you suggest?
Create and carefully maintain a proper measurement culture in your organization!
![]() CEO | Author | Speaker
CEO | Author | Speaker
BSC Designer is strategy execution software that enhances strategy formulation and execution through tangible KPIs. Our proprietary strategy implementation system reflects our practical experience in the strategy domain.