Find the detailed analysis of the best KPIs for HR including hire, retention, and ROI metrics. Learn how to describe and execute talent strategy with HR Balanced Scorecard.
Top 5 Talent Management KPIs
Starting small is a good idea when one needs to measure performance. Before, we discussed 6 essential KPIs for any organization. What about the HR department? What are the most important KPIs to track?
Here is my top 5:
- Hire efficiency index – Time to hire, days, Yield Rate, the numbers of interviews per hire
- % of new hires completing probationary period – to validate the hiring budget was spent in a right way
- Training metrics – to make sure that your talents are trained in an effective way
- Engagement index – as a lagging indicator of management skills and leading indicator of the future performance
- Turnover among top performers, % – to make sure your company is a talent magnet
HR Hire
![]()
A journey of a talent in an organization starts with a hiring process. Here are the most popular metrics to track:
- Yield ratio – helps to track the efficiency of the hiring process
- Time to hire – helps to focus on the proper number of interviews and organize them in the best way
- Cost to hire – helps to make sure that recruiting is financially efficient
Let’s discuss these indicators in detail.
Yield Ratio
Yield ratio in HR shows the percentage of candidates from the recruitment sources that were selected for the next stage of a hiring process. It allows HR and CEO focusing recruitment strategy on reaching the right candidates at a lower cost.
- Yield Ratio, % = (Number of leads from recruitment method / Number of candidates invited to interview) x 100%.
In simple words, yield ratio shows the efficiency of the specific recruitment method.
Example of Using Yield Ratio in HR
A company posted information about new positions opened in the job section of a professional community on LinkedIn. During the two weeks, 200 visitors followed the given link, eight of them filled in a contact form and two were shortlisted for an interview.Yield ratio: (2 / 8) x 100% = 25%
The company used online ads to promote the new position. The average cost per click was $1.20 and a company has got 154 clicks; the total cost of the campaign was $200. 20% of visitors (30 candidates) filled in a contact form and sent their CVs. Among these CVs, 12 persons were invited to an interview.Yield ratio: (12 / 30) x 100% = 40%
Yield Ratio and the Cost
The yield ratio for the second case is higher, but we should take into account the cost as well.
In the second case, the cost of getting 12 candidates to interview was $200, while in the first case, the direct cost was zero.
Yield Ratio Doesn’t Tell a Story in a Case of Small Numbers
If you deal with a small number of candidates, then yield ratio won’t tell a story.
Example:
- Three visitors have seen the first ads – one filled in the form, the yield ratio is 33%.
- Four visitors have seen the second ads – two of them filled in a form, the yield ratio is 50%.
The error factor of the yield ratio in this case is too high – we cannot make any decision on which method is better.
Building Yield Pyramid
Knowing the yield ratio on different levels, we can build a yield pyramid.
For example, we plan to open four positions for software developers.
- We know that the interview to hire ratio is 30%, so we need approximately 14 interviews.
- Candidate to the interview ratio is 20% for the selected method, so we need approximately 70 leads from this source.
Time to Hire
Time to hire might be a good indicator of the HR hiring process, but it should be more about the way talent managers spend their time budget than about the time itself.
- On the one hand, time to hire is supposed to show how fast HR is able to process leads and convert them to interviews and later to hires. In this case, it is a lagging indicator for HR with “faster=better” optimization.
- On the other hand, it might indicate how carefully the company examines new talents. In this case, it is the leading indicator for future employee performance.
Time to hire vs. Quality of Hire
What is more important, time to hire or quality of new hires? Let’s start with the time to hire indicator. According to the Recruitment Benchmark Survey1, 53% of executives track “Time to hire.”
Basically, the performance of HR specialists is supposed to be estimated by how quickly he or she fills the opened positions. The speed is important, but this indicator is easy to game – it should be balanced by a few quality indicators.
The strategic goal in this case might sound like:
- Fill positions with high-performing talents
The leading indicator in this case will be:
- Time to hire
The lagging indicators (the ones that validate the quality of new hire) are:
- Performance of new hires (as measured after 1 year and 3 years)
- % of new hires completing probationary period
- % of new hires present after 1 year
Let’s talk more about the leading part of the strategic goal “Fill positions with high-performing talents.” Time to hire is obviously a leading factor, but it doesn’t sound like the main one. It predicts how quickly the organization will be filtering new talents (a good starting point), but it is a poor predictor of the future quality of new hires.
In this case, we need to look more at how talent managers spend their time budget.
Leading Factors of Quality of Hire
Let’s discuss the number of interviews as a leading indicator for future performance of new hires.
What measurement scale can we use for the number of interviews?
- I believe the minimal value for this indicator should be at least one interview.
- What about the maximum value? Well, there are organizations that conduct seven interviews2, so let’s use seven as a maximum number of interviews.
What’s the golden mean for the number of interviews?
According to Todd Carlisle, Google’s director of staffing, after the fourth interview “the candidate’s average score would converge on his final score.”3.
I would mark the green zone for this indicator somewhere between two and four interviews:
- By doing less than two interviews, we are increasing the risks of bad hires because decision makers do not have enough information.
- By doing more than four interviews, we are increasing the risk of bad hires because excellent candidates might simply not survive the hiring process itself.
A good strategy might be to replace formal interviews with less formal phone calls or breakfast meetings.
Cost to Hire
The cost to hire metric summarizes all costs associated with recruitment. Typically, these costs are divided into:
- Internal and
- External
Internal costs are:
- HR salary
- Employee referral bonuses
- Relocation costs
- Training costs
- Tools costs (software license, office space)
External costs are:
- Recruiter / agency compensation / background check service
- Advertising costs
- Events cost (career fairs, on-campus presence, etc.)
The most popular form of this metric is:
- Cost per hire = The sum of Recruiting Costs (Internal and External) / Total number of new hires
What’s the application of this metric?
- HR Budget Planning
Obviously, if your goal is to focus on quality of hires, you should look at other metrics presented in this article. There is nothing wrong with knowing how much things cost for your organization, but as Dr. John Sullivan mentioned in his article, “cost per hire is an evil metric because calculating it takes up time and resources away from measuring the quality of hires.”
HR Retention
![]()
In this part of the article, we will focus on KPIs related to effective talent management.
- Training metrics – learn how to track learning and professional development efforts.
- Tracking soft skills – learn how to track something intangible like leadership.
- Engagement index – engaged employees are the leading factor of higher company performance, learn how to measure and improve it.
- Turnover rate – understand turnover rate, calculate turnover among top performers.
Training Metrics
“What if we train them and they leave?” …
What if we don’t and they stay?!
Training and professional development are key factors of preparing your organization for the current and future challenges. How to quantify and measure training initiatives in the company?
Training Costs
Let’s start with the costs. A typical mistake of tracking training costs is limiting it to the onboarding training only. The best practice is to track both:
- Training costs for new hires
- Professional development costs for existing employees
Training Penetration Rate
Another important process-oriented metric shows the percent of employees trained:
- Training penetration rate, %
Low penetration rate might be an indication of one of the problems:
- No alignment between training and the company’s goals
- Inappropriate training format – bad location/timing, engagement problem for elearning initiatives
- Insufficient sponsorship from top managers
Time to Complete Training
How long does it take to complete a training?
- Time to complete training, hours
Is another process-oriented indicator. It correlates with the cost of training and might be a good indicator of the efficiency of the training program.
Training Effectiveness Metric
We can name a number of other process-related metrics, but those metrics will not make much sense until we find proper lagging metrics for training that will provide timely feedback on our training efforts.
How to find those effectiveness metrics?A Kirkpatrick levels model is very useful for this challenge. We have discussed this model and its application to the training effectiveness of KPIs in the previous article. Here, you have an executive summary.
The effectiveness of the training can be measured in four levels:
- Immediate reaction – how well the employees accepted training emotionally. That’s what conference organizers typically measure when they ask for after-talk feedback.
- Learning outcomes – an estimation of the information that was assimilated by the trainees. That’s what HRs measure using after-training tests.
- Behaviour – the tangible impact of the training on the behaviour of employee, e.g., if your team actually implemented the ideas learnt.
- Impact – while the change in the behaviour is a good starting point, we need to make sure that this change resulted into the business performance improvement.
In the mentioned article, you will find more ideas about how to find the metrics for this four level model. Another interesting topic is how to apply this approach to measuring soft-skills training – we’ll discuss it below.
Measuring Soft Skills
Let’s discuss how one can quantify and measure the effectiveness of soft skill training like, for example, leadership training.
I suggest starting with a classical approach – getting feedback from the persons involved. A kind of 360-degree feedback.
That’s the simplest way to get some rough estimation about how the training was:
- We can ask the trainer
- We can ask the trainees
- We can ask their boss
Present their answers on some scale, calculate an average, and here we have a desired number. The estimation will be subjective and obviously biased, but at least we have some starting point.
Soft Skills Training – Quantify Training Goals
How to get more realistic measurement results?
We need to get a better understanding about leadership training. We need to understand how it is supposed to help with the current goals of the organization.
You paid for this leadership training and there is supposed to be some tangible reason behind this decision. Try to find and isolate this reason. For example, your turnover rate is too high compared to the industry average, or there are too many internal conflicts. Well, here you have your KPI, quantify those factors to find the lagging indicator for the leadership.
As we have discussed in the “Calculating Talent ROI” chapter – you will probably not find the dollar value for the leadership training, but at least you will quantify on the value created for your organization on the internal customers.
Soft Skills Training – Leading Metrics
Those were lagging indicators. What about leading ones?
How can we predict the success of the training? Well, it depends on the training; here are my three favorite success factors:
- Intrinsic motivation of the trainees
- Alignment between training topics and business challenges
- Sponsorship and support by top managers
Do you want to have some good KPIs? Well, my recommendation is – “Do something measurable!” In the example below, I explain what I mean.
Engagement KPIs
Employee engagement is one of the leading factors of employee´s performance. Respectively, high employee engagement leads to overall organization success.
What is NOT Employee Engagement?
Before discussing employee engagement, I’d like to make it clear what does NOT fit into the concept of engagement. Although the concepts sometimes overlap, employee engagement is not:
- Employee satisfaction
- Employee motivation
- Employee happiness
What is Employee Engagement?
First of all, it is a feeling, like love is. And we cannot quantify feelings; what we can quantify is the perception of the feelings. For example, using “proxy questions” that serve as some indicators of the degree of the examined feeling.
We can even invent a scale for employee engagement from “fully absorbed about their work” to those who are “actively damaging the organization.”
Quantifying Employee Engagement – Q12 Index
One of the recognized approaches to quantifying employee engagement is The Gallup Q12 Index.
Gallup regularly publishes the “State of the Global Workplace” where, among other data, the engagement index of employees worldwide is presented. Since 2014, this report says that “just 15% of employees worldwide are engaged in their job.”
How useful is this index?
The absolute value (15%) is probably useful only for the purposes of benchmarking, e.g., tracking annually how employees from different countries answer the same set of questions.
If you are not gathering statistics, then I guess, your interest in employee engagement is about measuring and improving it. If that’s the case, I do recommend having a look at the same list of Q12 questions and try applying it to the business realities of your organization.
Here are the questions of The Gallup Q12 Index, let’s try to quantify them.
| Q12 Question | Ideas to quantify |
| 1. Do you know what is expected of you at work? | We can quantify the question itself as:
The improvement plan might be as simple as creating a ¨role requirements¨ document and revising it for clear language and up-to-date information. For some roles, a good strategy map might be a solution. |
| 2. Do you have the materials and equipment to do your work right? |
Beyond obvious ideas, think about software licenses, internal tools that free employees up from routine tasks. |
| 3. At work, do you have the opportunity to do what you do best every day? | It’s hard to say how different employees understand this question. My personal perception is a balance between tasks that require my expertise (like writing this article) and tasks that I consider a necessary evil (like filling administrative forms).
|
| 4. In the last seven days, have you received recognition or praise for doing good work? |
As you can imagine a routine “thank you” email every seven days won’t work. One of the best practice ideas is to split large tasks into smaller tangible chunks so that both employee and manager have a better control over their progress and respectively had more specific reasons to praise for doing good work. |
| 5. Does your supervisor or someone at work seem to care about you as a person? | The “caring” aspect is probably a lagging indicator of the general climate in the company’s office.
|
| 6. Is there someone at work who encourages your development? |
|
| 7. At work, do your opinions seem to count? | In the context of this question, I’m thinking about the innovation system that we have discussed before.
The metric that you might be looking for in this case is on the Innovation scorecard:
|
| 8. Does the mission/purpose of your company make you feel your job is important? | I would split this question into more specific ones:
In the cascading article,we discussed how to cascade goals across the levels of organization. The mission (as a top level goal) needs to be cascaded and explained on different levels in a similar way.
|
| 9. Are your associates (fellow employees) committed to doing quality work? | A proper measurement culture is one of the ways to approach this challenge.
The quality scorecard itself will also work as a powerful tool. |
| 10. Do you have a best friend at work? | Not sure, if/how this should be quantified on the business scorecard. If you have some ideas, feel free to share in the comments. |
| 11. In the last six months, has someone at work talked to you about your progress? | Similar to question 4, but this time we are looking at a larger time scale. |
| 12. In the last year, have you had opportunities to learn and grow? |
|
The Gallup Q12 is a good starting point for your employee engagement index, but it doesn’t mean that you have to copy it. I would recommend starting to review the questions from the viewpoint of your organization.
Employee Moral
What about employee morale? How is it different from engagement? Can we quantify morale?
The terms “morale” and “engagement” are often used interchangeably. In my opinion, they are not the same:
Think about employee morale (“happiness” and similar) as a leading factor of employee engagement.
Morale or happiness are feelings that contribute to the employee engagement, but the connection is not straightforward. Happy employees are not necessarily the most engaged ones.
How to quantify and measure morale? The easiest way – ask your employees. Do it the form of a light-weight survey, use a smartphone app, use a “mood” widget for your project management tool, or simply look around and do what most human beings do naturally – recognize behaviour and the body language of people around you.
For some more practical examples, look at the military strategists. A classical example, in this case, is Von Clausewitz, who emphasized4 the importance of morale factors.
Turnover Rate
High turnover rate is traditionally perceived as something negative. Well, it’s not always the case. Let’s see what turnover indicators one needs on the performance dashboard.
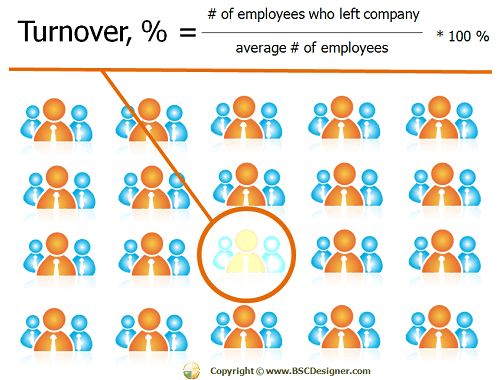
The turnover formula is:
- Turnover, % = ((Number of employees who left company during the period) / (Average Number of Employees for the Period)) * 100%
Where
- Average Number of Employees for the Period = ((Number of Employees at the beginning of period) + (Number of Employees at the end of the period))/2
For example:
- In the beginning of the year, a company has 51 employees;
- At the end of the year, the company has 54 employees;
- During the year, 12 employees left the company
- Turnover, % = 12 / 52,5 = 22%
Is high turnover rate negative? A short answer is:
- If your high-performing employee left your company, then it is negative.
If you replaced someone who was under-performing with “fresh blood,” then high turnover will result in a positive change in your organization.
A simple conclusion that we can:
- Instead of tracking “turnover rate,” track “high-performer turnover rate.”
Let me illustrate this idea by taking the Apple company as an example. As long as Apple is considered a “cool” place to work5, this company prefers investing more in hiring and training than in keeping turnover low.
Check out the latest data by Pay Scale. When I checked the list, “Eastman Kodak Company” was in first place with 20 years’ median employee tenure, while Apple’s median tenure was 2.3 years.
Apple works as a talent filter and magnet, keeping high-performers turnover lower and poor-performers turnover high.
Instead of using a simple turnover rate, I suggest focusing on turnover rate among high-performing employees. Here is the formula:
- High-Performing Employee Turnover, % = ((Number of high-performing employees who left company during the period) / (Average Number of Employees for the Period)) * 100%
Related metrics:
- Average length of employment = Sum of all tenures / Number of FTE
Finance for HR
![]()
The ideas and results of HR presented in the boardroom are always questioned from the financial point of view. Here are some finance-related metrics that will support the arguments of talent managers.
Revenue per employee
The good thing about this KPI is that one can find revenue and employees data online. For example, search for “annual ranking of the fastest-growing private companies” by Inc.com, you can compare it with your data.
By the definition, the revenue per employee is calculated as:
- Revenue per employee = (Total revenue / The number of FTE employees) x 100
The number of employees might vary during the reporting period, so companies take an average value. Also, if a company employs part-time employees, then for this formula, it is necessary to use FTE (full time employee equivalent).
It makes sense to compare the revenue per employee with the industry average to have another point of view on the company’s efficiency.
What Does Revenue per Employee Mean?
Don’t expect too much from this indicator. In the world of disrupting technologies, these numbers might be tricky.
Let’s take Apple´s revenue as an example. With $2.13 million per FTE compared to average $0.47 million per FTE, Apple looks a “little bit” understaffed. Should they immediately invest in changing the situation and hire more employees? I doubt it.
Still, this metric allows getting a rough estimation of how a company is compared to others.
Calculating Talent ROI
A number of good ROI indicators could define the boardroom credibility of the HR specialist. Let’s see if ROI makes sense in the talent management domain.
A general ROI (Return of Investment) formula is simple:
- ROI (%) = (Net profit / Investment) * 100
When applying it to HR, we face two challenges. We need to calculate:
- The “Investment” part and
- The “Profit” part
As for the investment part, its calculation is relatively easy; we have to summarize the costs associated with an employee:
- Cost to hire
- Cost of training
- Workspace and equipment costs
- Cost to manage
- Compensation: salary + benefits
The main challenge is with the Profit part. Its dollar value can be quantified for those who work in sales but for other employees, it won’t make a lot of sense:
- Calculating a precise dollar value of a customer service specialist or a software engineer doesn’t look like a realistic task.
In this case, I would suggest shifting the focus from a dollar value to something that is easier to quantify but is still relevant for the ultimate performance:
- A value created by the employee for the customers
Let’s take customer service as an example. How can the value created for a customer be quantified? We can start with basic metrics like:
- Timely answer (customers like fast answers)
- Repeat problems rate (customers appreciate solutions that work)
Or we can quantify something less tangible:
- % of impressed customers
- Level of trust gained
- Wow experience provided
If you are looking for some good examples of how to impress customers, check out the “Raving Fans!” book [Raving Fans! Ken Blanchard, Sheldon Bowles, Collins, 1998].
I think the idea with calculating ROI by using customer value instead of dollar value is clear now.
What about those who don’t deal with the customers, like for example, IT unit? Actually, they deal with customers as well, but in their case, we need to think about the value they create for internal customers.
HR Reward and Compensation
The metrics for reward and compensation is the most disputable topic in the HR domain. Let’s discuss if/how one should link reward to KPIs.
I have shared my point of view on this topic in the Compensation and Reward KPI Best Practices article.
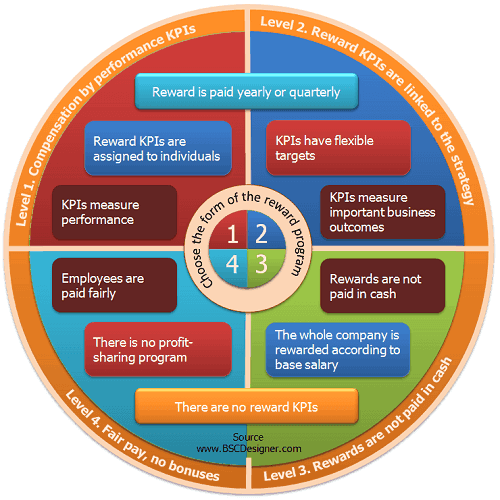
You will find an executive summary below. If you are curious about underlying arguments, I would recommend consulting the original article.
- There is no “one size fits all” in reward – we discussed at least four levels; your level depends on geography and type of your business.
- Linking reward to the performance KPIs is generally a bad idea. Top performers will feel pressured by the targets and will probably leave; low performers will start looking for ways to game the system (and they will find them)
- Pay fair salary
- Shift from rewarding individuals to rewarding the whole company
- Avoid rewards in cash – stock purchased work better
HR Strategy
![]()
Solving talent management challenges is not just about tracking some KPIs. One needs to understand where these challenges are coming from and how to address them. In this chapter, we’ll discuss possible strategies for HR and how to formulate them using the Balanced Scorecard Framework.
HR Shared Service
HR shared service is one of the popular ways that organizations use to optimize the costs of talent management. The transition to this model sounds like a logic step to save on scale. At the same time, new questions related to the quality of provided service and respective internal customer satisfaction increase their importance6. In the context of cost optimisation, we have discussed similar challenges in the procurement KPIs article.
We invited Kazim Ladimeji, the director of https://thecareercafe.co.uk to share his experience on the topic:
Most of you will be familiar with the HR Shared Service Center model, (HR SSC), which operates alongside specialist HR Centers of Excellence and Strategic HR Business Partners. The idea is that the HR SSC acts like a first/second line customer service center for staff, freeing up time for HR specialists in the centers of excellence, and helps HR Business partners to deliver strategic, valued added HR interventions for the individual business units.
The HR Shared Service model has become increasingly popular, and current estimates suggest that 75% of the Fortune 5007 use some kind of shared services model.
Even though HR shared services are becoming the norm amongst multinationals and public sector organizations, we should not take them for granted as they can’t be considered an outright success. For example, this white paper by the Hacket Group8, citing recent SHRM research suggests that it may be too early for self-congratulatory back slapping, as while cost reduction is undeniable, customer service levels in HR SSCs leave a lot to be desired.
The study found that the metrics to evaluate customer/user satisfaction were not actually present on most business scorecards which means that customer satisfaction was not on the radar of most companies.
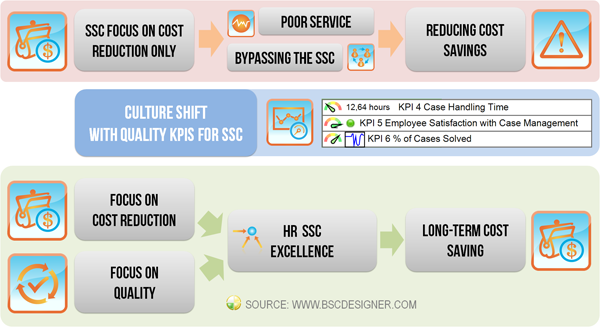
KPIs for HR SSC
We suggest that companies focus their scorecards on both scale economy and quality KPIs.
HR SSC Scale Economy KPIs
- Reduce hiring costs
- Reduce the number of HR admin per head
- Reduce the time spent on HR administration
- Case handling time
HR SSC Quality KPIs
- Time spent training HR SSC staff
- Employee satisfaction with case management
- Reduced employee turnover
Strategic Priorities for HR
When formulating HR strategy by following the Balanced Scorecard approach, we need to understand what the challenges are that we have to address.
We invited Kazim Ladimeji, the director of https://thecareercafe.co.uk to share his experience on the topic.
Aleksey: What are the key trends that talent specialists need to take into account today?
Kazim: The business world is having to deal with change at an unprecedented rate, largely due to the modern technological revolution and today’s consumer’s insatiable urge for mass customization, technological innovation and instant gratification.
There are 9 key trends that will be impacting the external HR environment, and these are:
- Explosion in wearable technology in the work-place (IDC Research)
- Low wage economy, so people are working two jobs (Economic Policy Institute)
- Studies showing employees beginning to value employer honesty above all else (Randstad)
- Employee engagement levels continue to stay at rock bottom (Gallup)
- Increasing intergenerational tension in the workplace (Vital Smarts )
- A wider move to ‘inclusion’ and not just diversity (Global Diversity & Talent Strategies)
- Increasing dependence on data-backed decision-making (Bersin by Deloitte)
- Entering a 4-year period of very high staff turnover/low loyalty (Hay group)
- Demand for talent continuing to outstrip supply (Manpower)
Aleksey: SWOT analysis is one of the business tools that managers can use to sort out their thoughts about possible improvement strategies. Let’s discuss the example of SWOT application in the talent management domain.
Kazim: There will be many external pressures acting on your business and HR function, and there are many potential strategies you can adopt to help meet these challenges.
The best way to see through the fog is to conduct a simple SWOT analysis, much like we’ve prepared below to help you decide your modern HR priorities and focus your balanced scorecard.
- Located right next to a University campus.
- Able to attract talent in specific areas.
- Pretty good training programmes in specific areas.
- Managers good at motivating staff to meet monthly deadlines.
- Pretty good compensation and benefits offering.
- Bring a greater focus on ‘inclusion’ as well as diversity to widen access to talent.
- Explosion in wearable technology in the work-place creates opportunities to use mobile apps to motivate staff.
- Make more use of big data to improve decision-making.
- Lack of trust and respect in management.
- Struggling to attract talent in specific areas.
- Employee turnover levels above industry standards.
- Middle managers and especially disengaged.
- Demand for talent continuing to outstrip supply.
- Entering a 4-year period of very high staff turnover/low loyalty.
- Employee engagement levels continue to stay at rock bottom.
- Low wage economy so people working two jobs.
- Explosion in wearable technology in the work-place creating privacy issues.
- Increasing intergenerational tension in the workplace.
Aleksey: What outcomes of the SWOT analysis would you implement in the HR strategy?
Kazim: You may, of course, have your own priorities but based on the SWOT analysis above, four key HR priorities have emerged, and these need to be reflected in the HR Balanced Scorecard if it is to be relevant.
- A drastic need to upgrade retention programmes due to an up-coming period of high staff turnover.
- New talent attraction strategy required as talent shortages are getting worse.
- Putting data and statistics at the heart of HR decision-making.
- Widening the potential talent pool for position by greater ‘inclusion.’
Aleksey: Thank you Kazim. I believe our readers will find the mentioned trends and an example of HR SWOT analysis useful for their strategy scorecards.
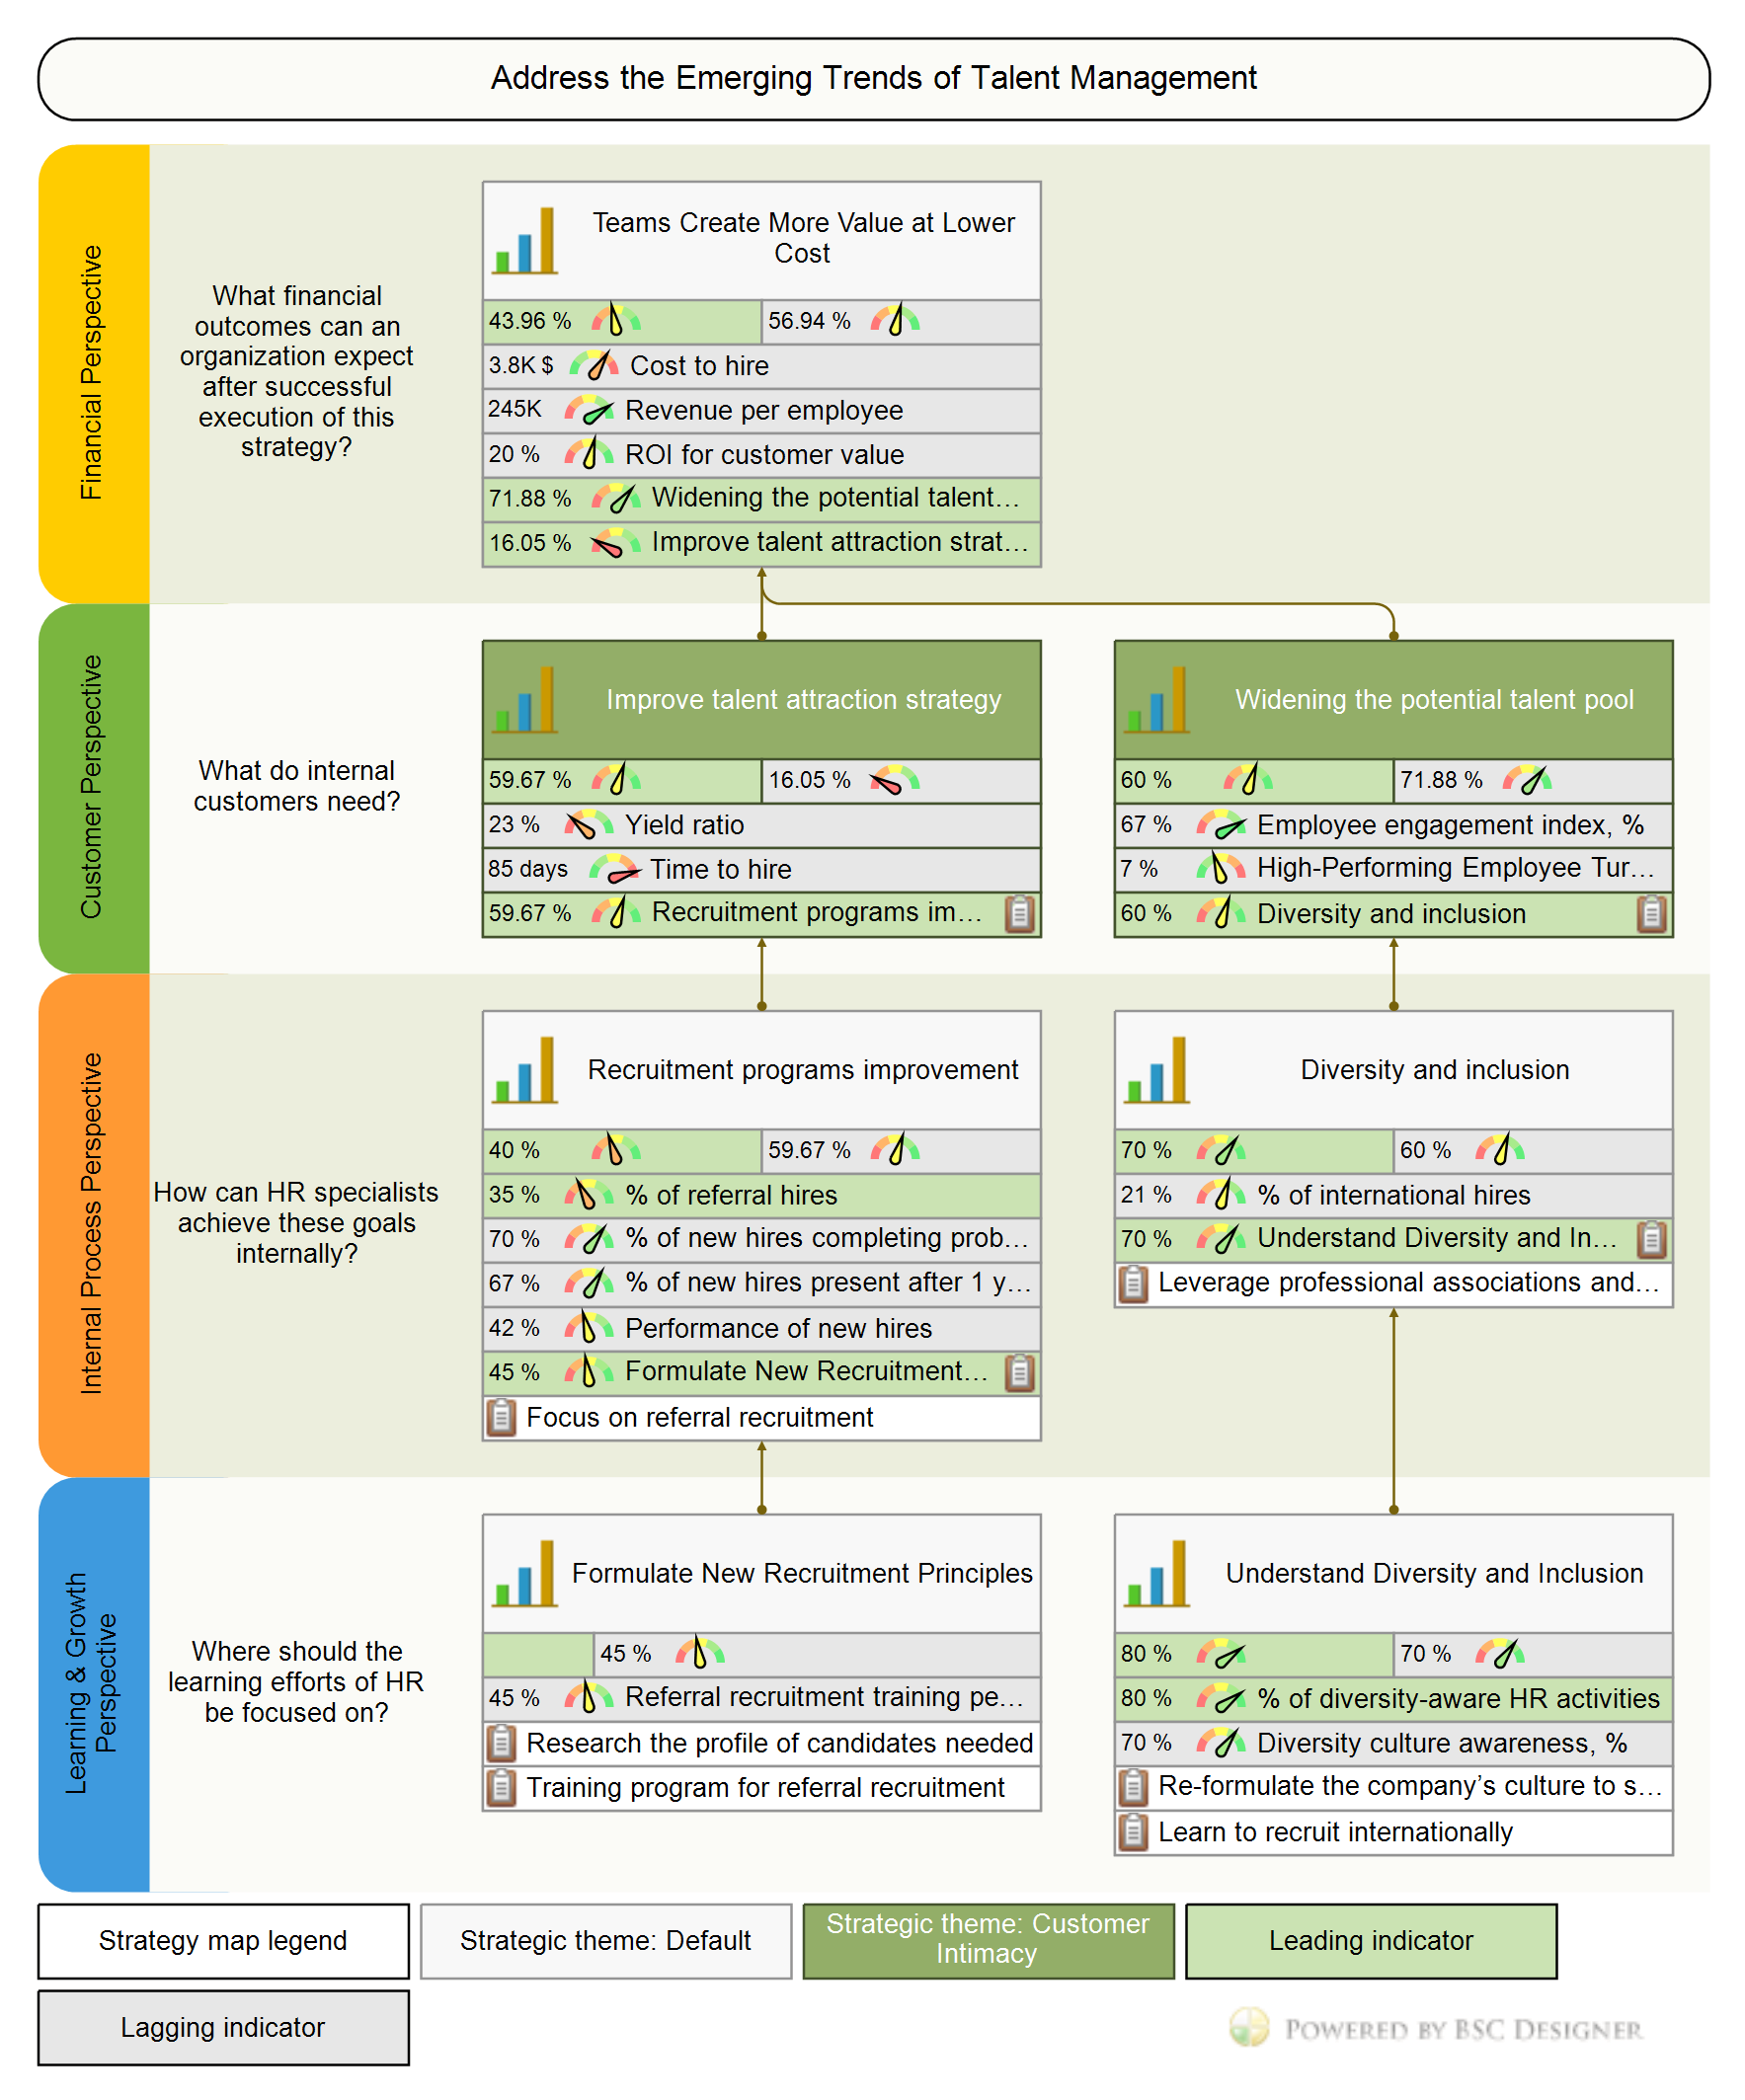
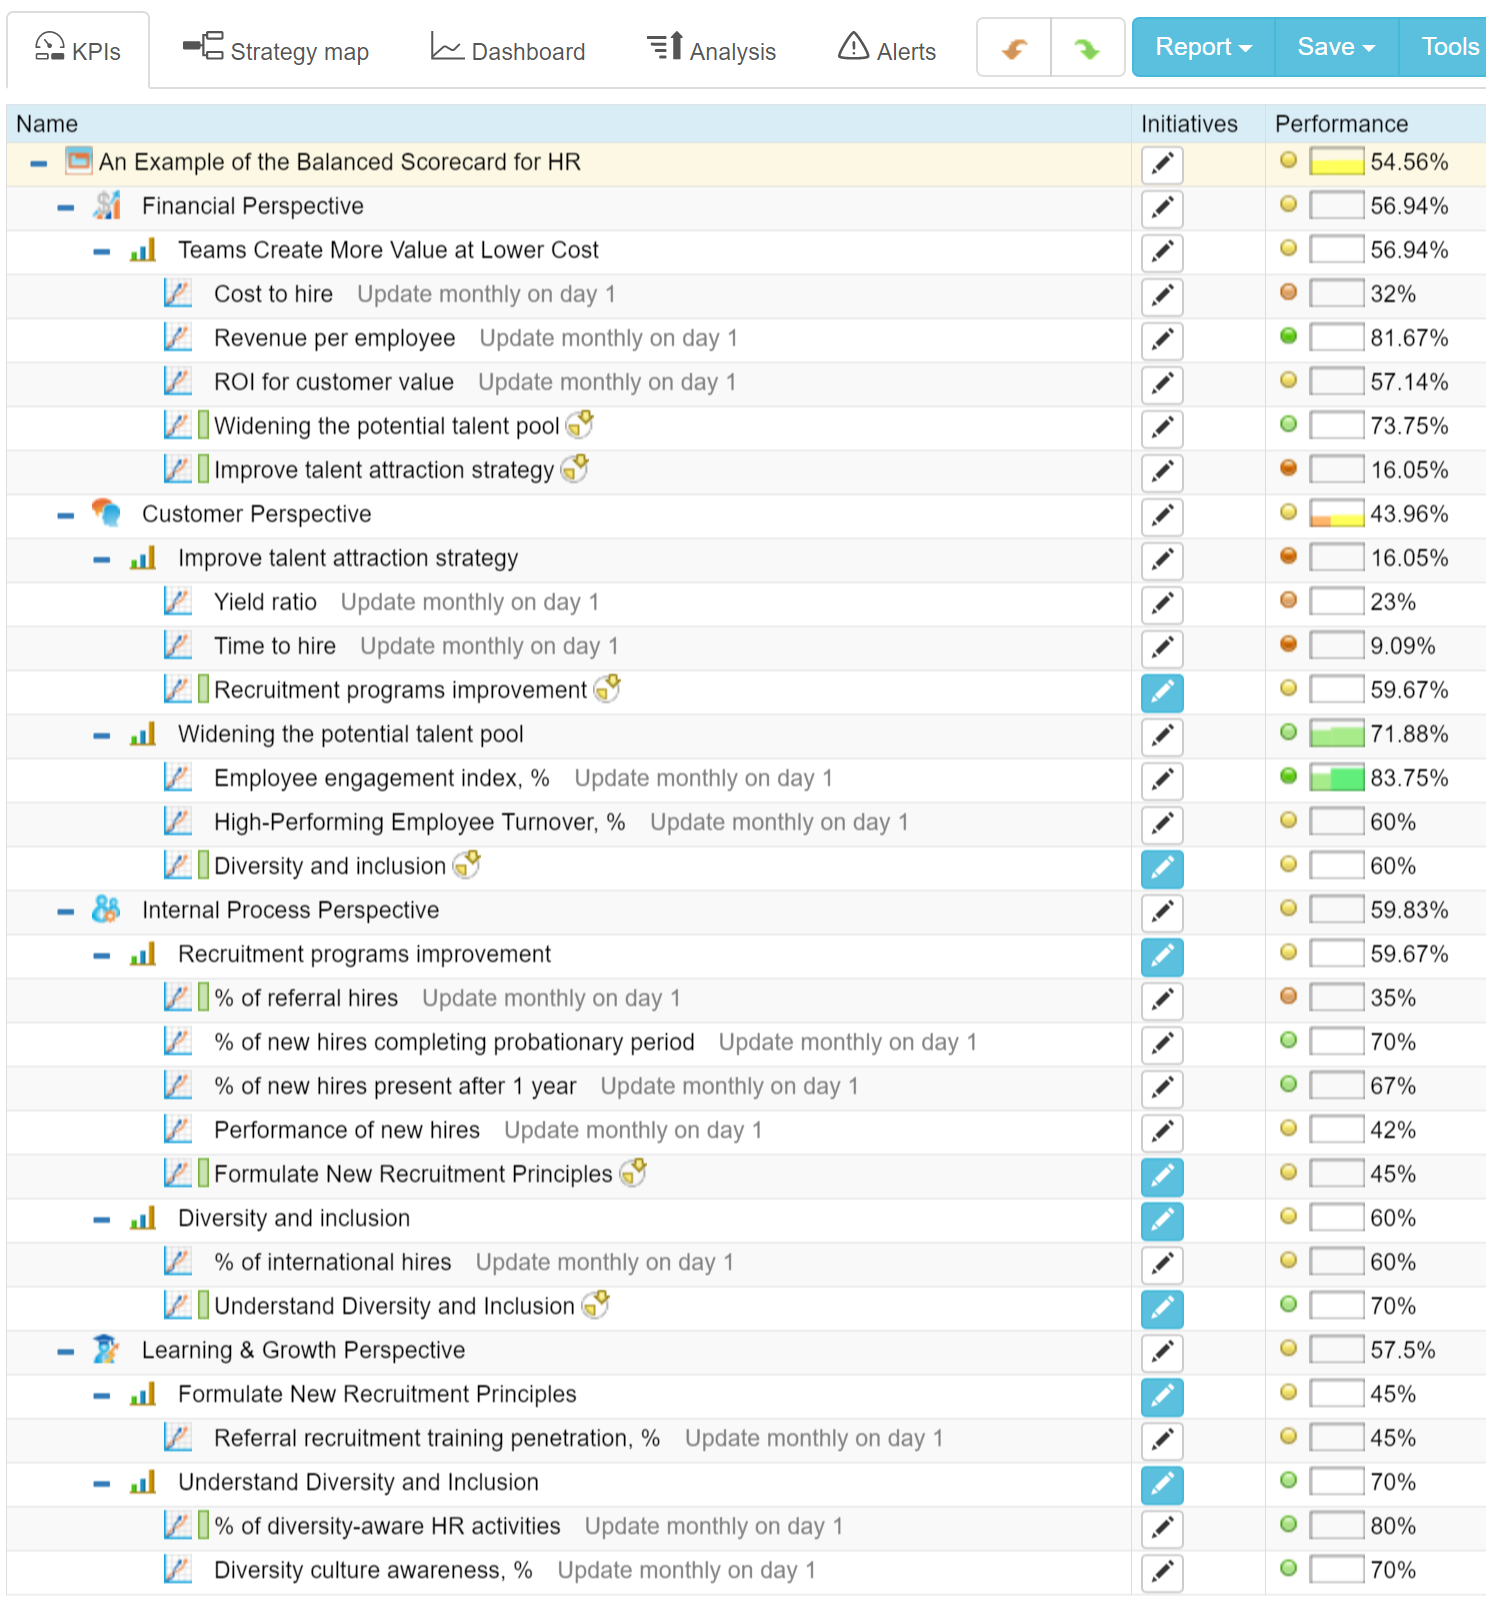
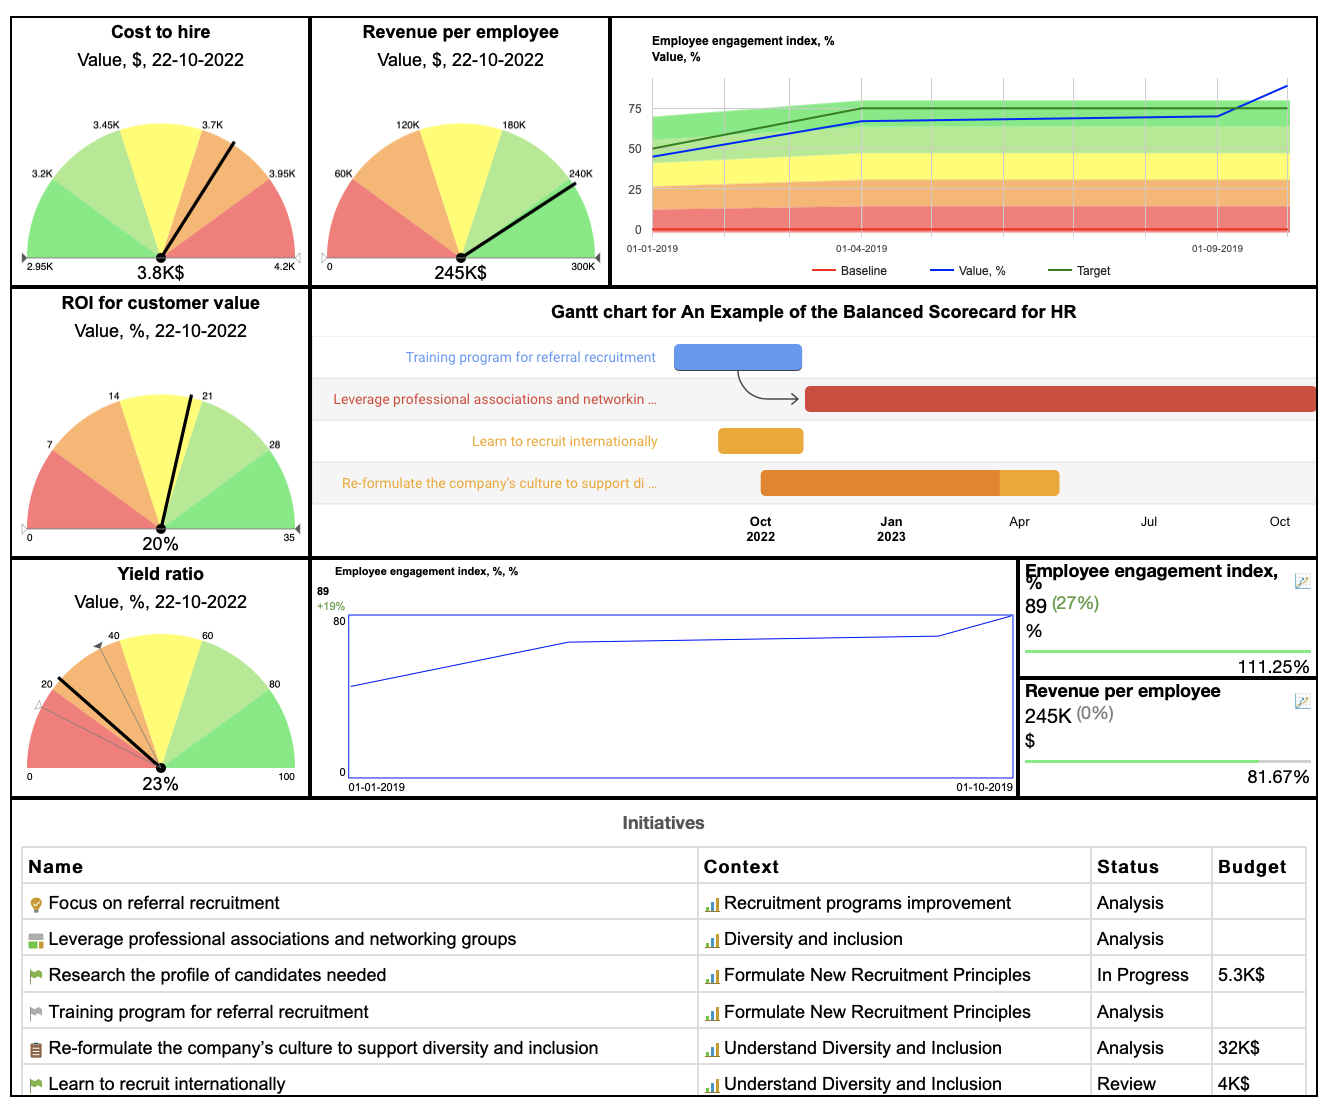
An Example of the Balanced Scorecard for HR
![]()
Now, let’s use the findings of this article, and build a Balanced Scorecard for HR.
Customer Perspective
Who are the customers of HR? Other business units who need good specialists to execute their strategies. What do HR customers need? Following the trends discussed above, we can formulate these two goals.
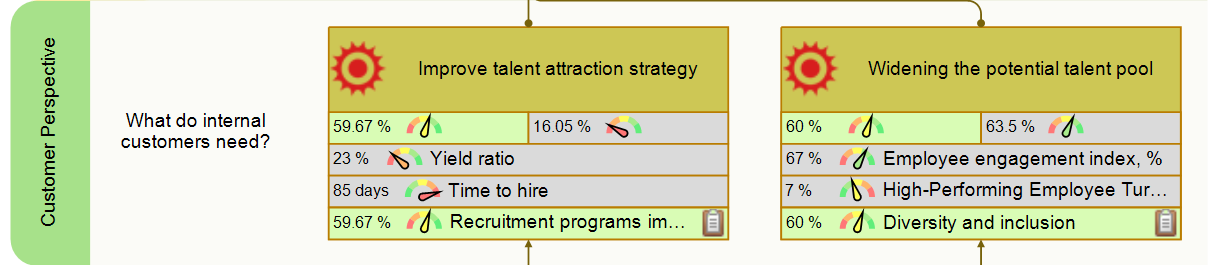
Goal 1. Improve talent attraction strategy
Measured by lagging metrics:
- Yield ratio
- Time to hire
- Cost to hire
Leading performance comes from the “Recruitment programs improvement” goal from the Internal perspective.
Goal 2. Widening the potential talent pool
Measured by lagging metrics:
- Employee engagement index, %
- High-Performing Employee Turnover, %
Leading performance comes from the “Diversity and inclusion” goal from the Internal Perspective.
Internal Processes Perspective
How can HR specialists achieve these goals internally?
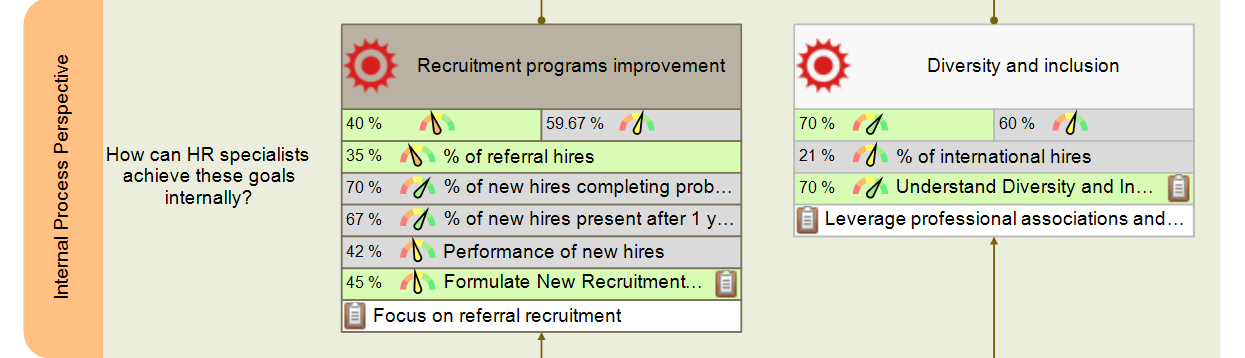
Goal 1 Recruitment programs improvement
Measured by leading metric:
- % of referral hires
Measured by lagging metrics:
- % of new hires completing probationary period
- % of new hires present after 1 year
- Performance of new hires (as measured after 1 year and 3 years)
Possible initiatives:
- Focus on referral recruitment

Goal 2 Diversity and inclusion
Measured by lagging metric:
- % of international hires
- Other Diversity and inclusion metrics (a specific metric is formulated depending on the diversity dimension that is monitored)
Possible initiatives:
- Leverage professional associations and networking groups
Learn more about articulating a strategy for diversity and inclusion.
Learning and growth perspective
Where should the learning efforts of HR be focused on?
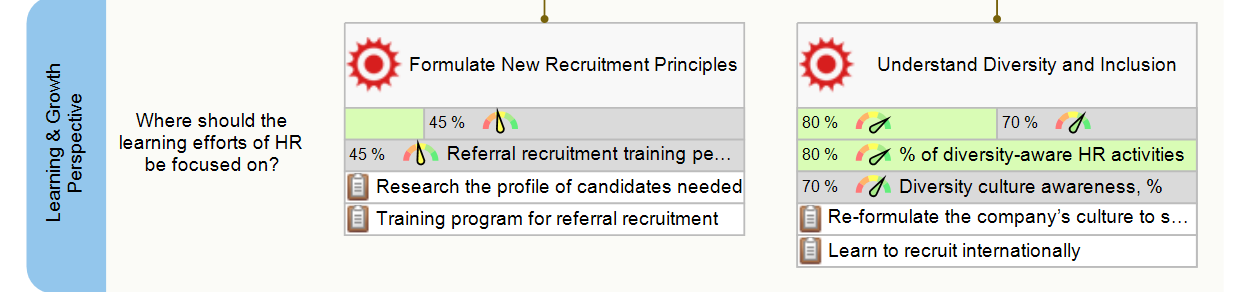
Goal 1 Formulate New Recruitment Principles
Measured by lagging metric:
- Referral recruitment training penetration, %
Possible initiatives:
- Research the profile of candidates needed
- Training program for referral recruitment
Goal 2 Understand Diversity and Inclusion
Measured by leading metric:
- % of diversity-aware HR activities
Measure by lagging metric:
- Diversity culture awareness, %
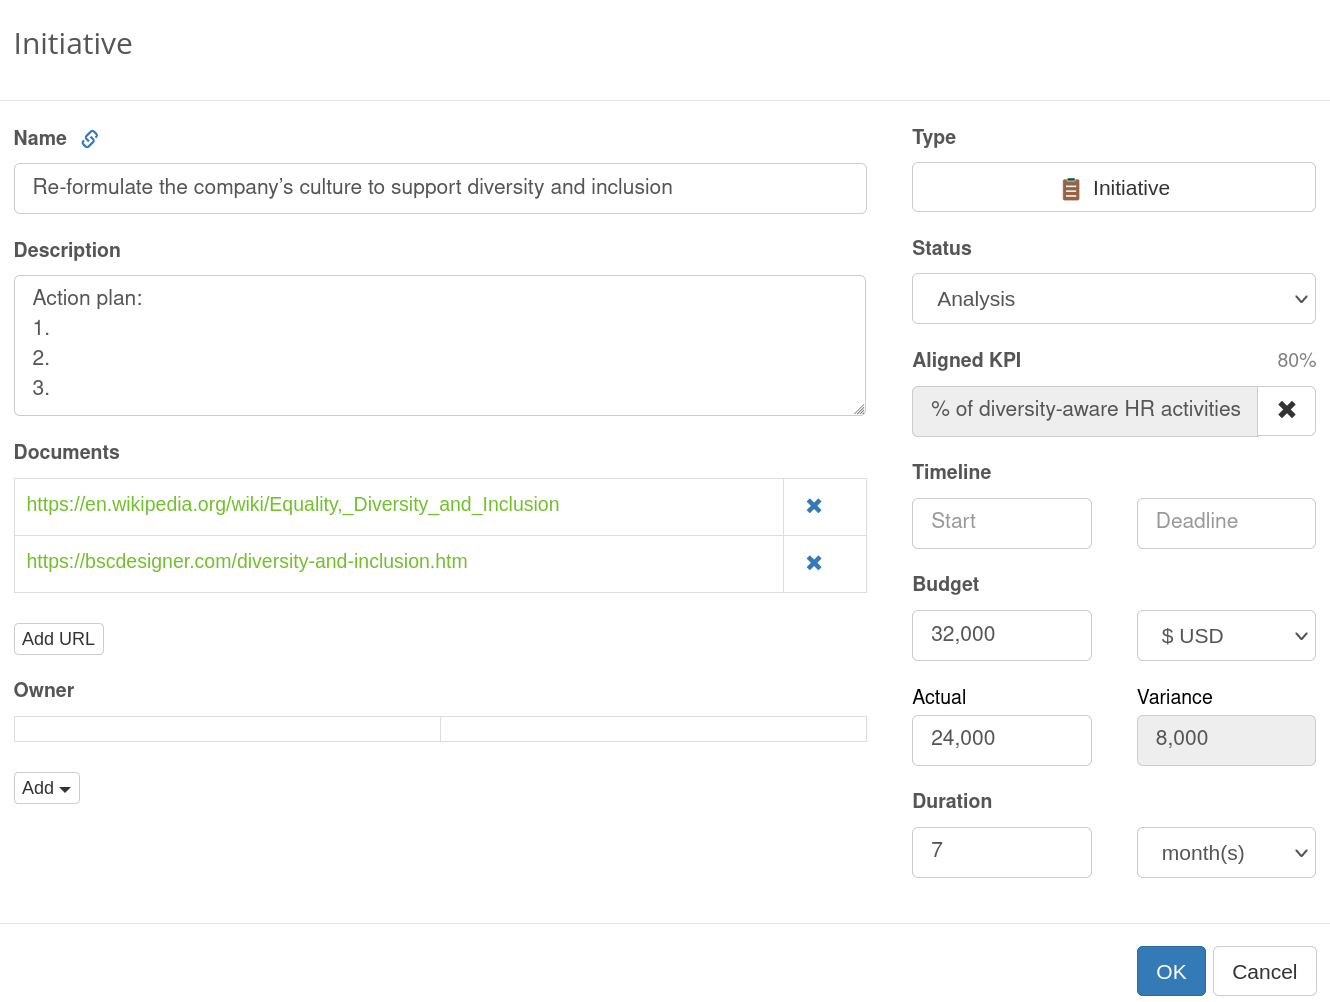
Possible initiatives:
- Re-formulate the company’s culture to support diversity and inclusion
- Learn to recruit internationally

Financial Perspective
What financial outcomes can an organization expect after successful execution of this strategy?
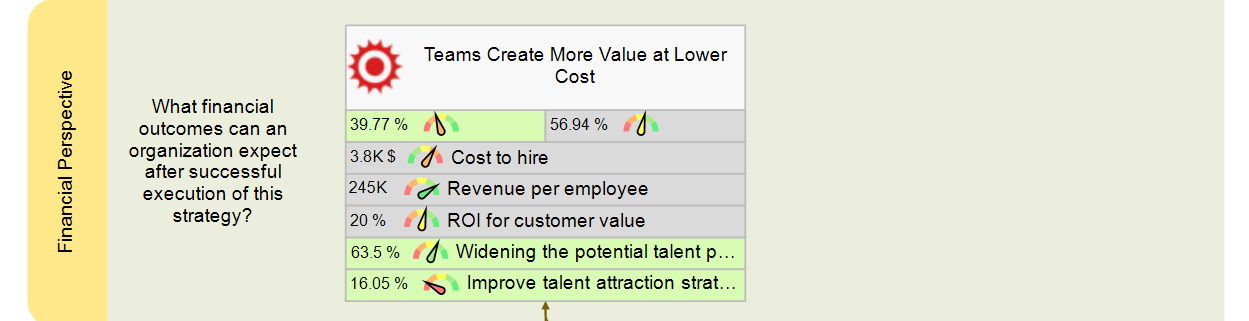
Goal 1 Teams Create More Value at Lower Cost
Measured by lagging metrics:
- Cost to hire
- Revenue per employee
- ROI for customer value
Cascading HR Goals
A good strategy is a product of discussion. You can use the template of the HR scorecard from this article as a starting point for your own strategy discussion.
Make sure that top managers from different business units contribute to this discussion. Probably, they will come up with some great goals and KPIs not mentioned in this article.
Finally, the goals of the HR scorecard have to resonate with the overall strategy of the organization.
Takeaways
Here are some final thoughts:
- The most important HR KPIs are those that are aligned with your HR strategy.
- We have discussed many talent metrics in this article but only used a few on the final strategy scorecard.
- Formulate your HR strategy to address the emerging trends of talent management, then find the proper KPIs to track your success.
- Follow our
 Strategy Implementation System to align stakeholders, strategic ambitions, and business frameworks into a comprehensive strategy.
 - Automate strategic planning with BSC Designer by organizing goals, initiatives, risks, and KPIs into scorecards.
More About Strategic Planning


- Recruitment Benchmark Survey Results, 2013, NovoGroup ↩
- With Positions to Fill, Employers Wait for Perfection, Catherine Rampell, 2013. The New York Times ↩
- The Happiness Machine. How Google became such a great place to work. Farhad Manjoo, 2013 ↩
- Von Clausewitz on War: Six Lessons for the Modern Strategist ↩
- Apple’s Employees Have a Hell of a Ride, Steve Denning, 2012, Forbes ↩
- Shared Service Center – the 2nd Generation, PWC, Paul Horowitz, Charles Aird ↩
- Can shared services provide a quality HR service?, Katie Jacobs, 2014, HR Magazine ↩
- Saving Shared Services, Robert J. Grossman, HR Magazine, 2010 ↩
![]() CEO | Author | Speaker
CEO | Author | Speaker
BSC Designer is strategy execution software that enhances strategy formulation and execution through tangible KPIs. Our proprietary strategy implementation system reflects our practical experience in the strategy domain.