This case study examines the common challenges faced by clients of BSC Designer within the aviation domain, including airlines, airports, and quality control groups, in the context of strategic planning and performance management.
Conceptually, we can classify the challenges into two categories:
- Challenges related to strategic alignment and strategy architecture in general
- Challenges related to performance measurement
Strategic Alignment and Strategy Architecture
The complexity of the operational landscape in the aviation domain requires the use of various strategic tools to sense the environment and develop appropriate response plans.
While several industry-accepted business frameworks effectively address these challenges, strategic alignment remains a root cause of ineffective strategy implementation and execution.
The users of BSC Designer software address this challenge by:
- Implementing readily available business framework templates within the software
- Making use of a strategy architecture based on aligned scorecards
Business Frameworks in Aviation Domain
Here are some examples of how the business frameworks are applied in the aviation domain:
| Tools | Application Context |
|---|---|
| PESTEL analysis | Analysis and design of response strategies for the changing external environment, including economic, geopolitical, and competitive landscapes. |
| Scenario Planning | Challenges related to climate change and extreme weather events emphasize the need for effective business continuity strategies and thorough scenario planning within the aviation sector. |
| Scorecard templates for supply chain, and governance. | New requirements for sustainability reporting, such as CSRD in Europe, affect the way organizations manage their stakeholders, governance, supply chain, and sustainability reporting. |
| Template for quality and safety scorecard | Formulating quality and safety-related strategies and tracking leading performance indicators aligned with success factors. |
| Contextual and data alignment | Demonstrating how the organization’s strategy supports SDGs 2030 by establishing proper context or specific connections through reporting indicators. |
| Stakeholders analysis and management | The increasing number and needs of stakeholders require dedicated stakeholder analysis and management with sub-strategies tailored for specific stakeholder groups1. |
| Ansoff Matrix | Evolving economic environments encourage aviation organizations to explore alternative growth strategies, including the integration of premium and low-cost models and strategies within an airline. |
| Diversity and Inclusion Template | Successful operation in diverse cultural environments requires the implementation of a diversity and inclusion strategy. The diversity and inclusion scorecard template serves as a starting point for such strategies. |
| Template for innovation processes and Five Forces for competitive analysis | To achieve long-term competitive advantage, companies must design a systematic innovation process. Singapore Airlines serves as an excellent example of successful implementation of an innovation strategy2. |
In practice, the use of these tools leads to the development of multiple strategy and function scorecards, each varying in their level of detail and degree of strategy decomposition. Integrating these diverse scorecards into a comprehensive strategy proves challenging within the constraints of a monolithic strategy architecture with a single hierarchical structure.
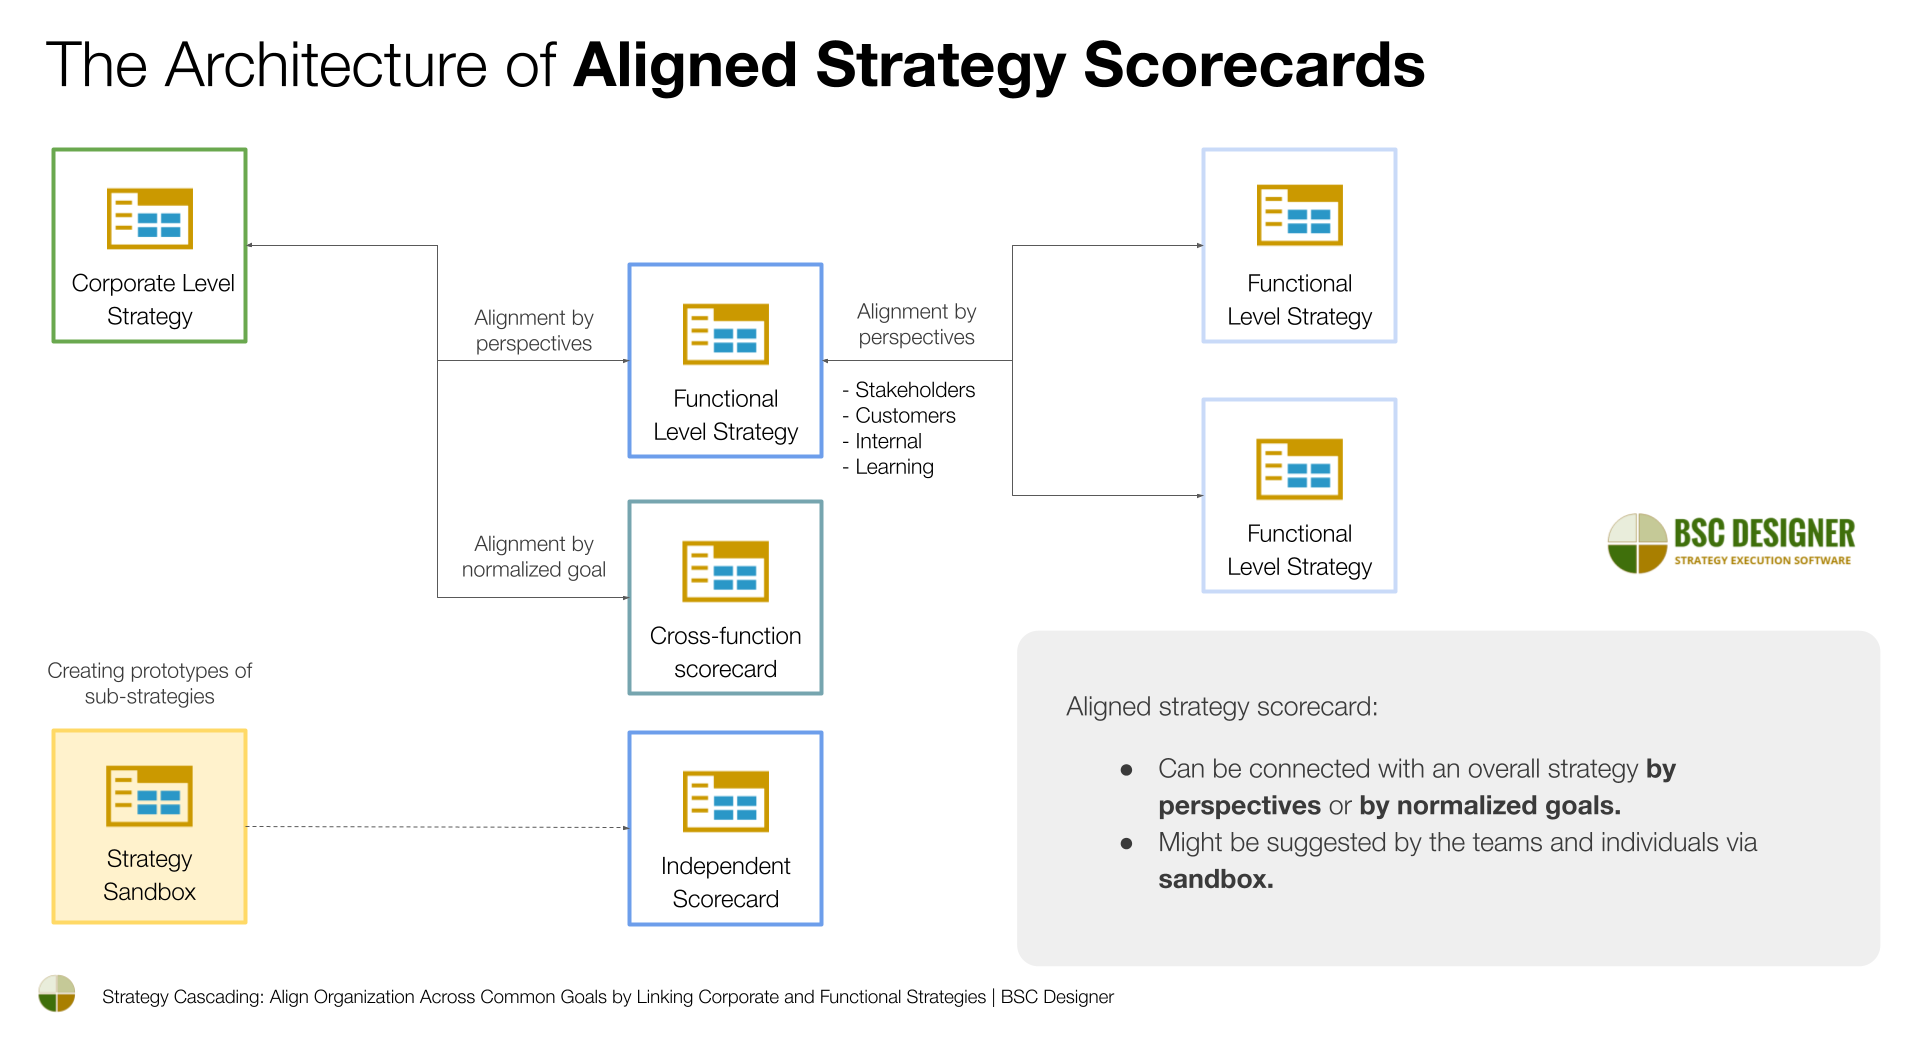
In contrast, a strategy architecture based on aligned strategy scorecards proves to be more suitable for the mentioned challenges:
- There are independent strategy and functional scorecards (sustainability, governance, region-specific strategies, results of PESTEL analysis, scenarios, etc.).
- The independent strategy and function scorecards can be aligned to provide necessary context for each other and automate performance calculation.
- Scaling the best practices across different branches of the organization is as simple as creating a copy of successful sub-strategies and adjusting them to the needs of the new business unit.
Performance Measurement in Aviation
At the performance measurement level, we identified behavior patterns typical for users in the aviation domain:
- Using a binary paradigm for performance measurement instead of a gradual measurement
- Paying attention to leading indicators, especially in safety-related disciplines
Binary Paradigm for Performance Measurement
In general business practices, it’s typical to see a gradual progress scale, where metrics have certain progress thresholds for acceptable levels.
For example:
- % of employees trained with a “green” threshold of 85%
- Equipment maintained according to plan, %, with a 95% threshold
A typical requirement of clients in the aviation industry is a binary paradigm for measurement.
For example:
- The indicator “% of employees trained” is considered in the green zone only when 100% of employees are trained according to the standard.
- The only acceptable target for the indicator “Equipment maintained according to plan” is 100%.
To automate this concept with BSC Designer, users leverage the binary performance function. To change the performance function:
- Select an indicator.
- Switch to the Performance tab.
- Select “Binary Maximize” in the Optimization list.

With this configuration, we can track, for example, the “% of employees trained” by updating the data in the “Value” field.
Applying the “binary” optimization function ensures that any value below the target (100% in this case) will result in 0% progress. Once the indicator reaches the target, its progress will be 100%.
In the case where the indicator is of the “less value is better performance type,” follow the same steps, but use the “Binary Minimize” optimization function.
Leading Factors and Indicators
Most companies in the aviation domain that we have worked with pay special attention to quantifying success factors with leading indicators when managing their performance.
For example, in the functional scorecards related to safety:
- It’s typical to see a number of lagging indicators that quantify safety, such as the number of accidents of a certain type.
- At the same time, there are leading indicators aligned with success factors or prevention plans.
The focus on leading indicators is not limited to the safety function. We observed the same pattern in the sustainability measurements of many airlines, such as in the sustainability reports of Qatar Airways Group.
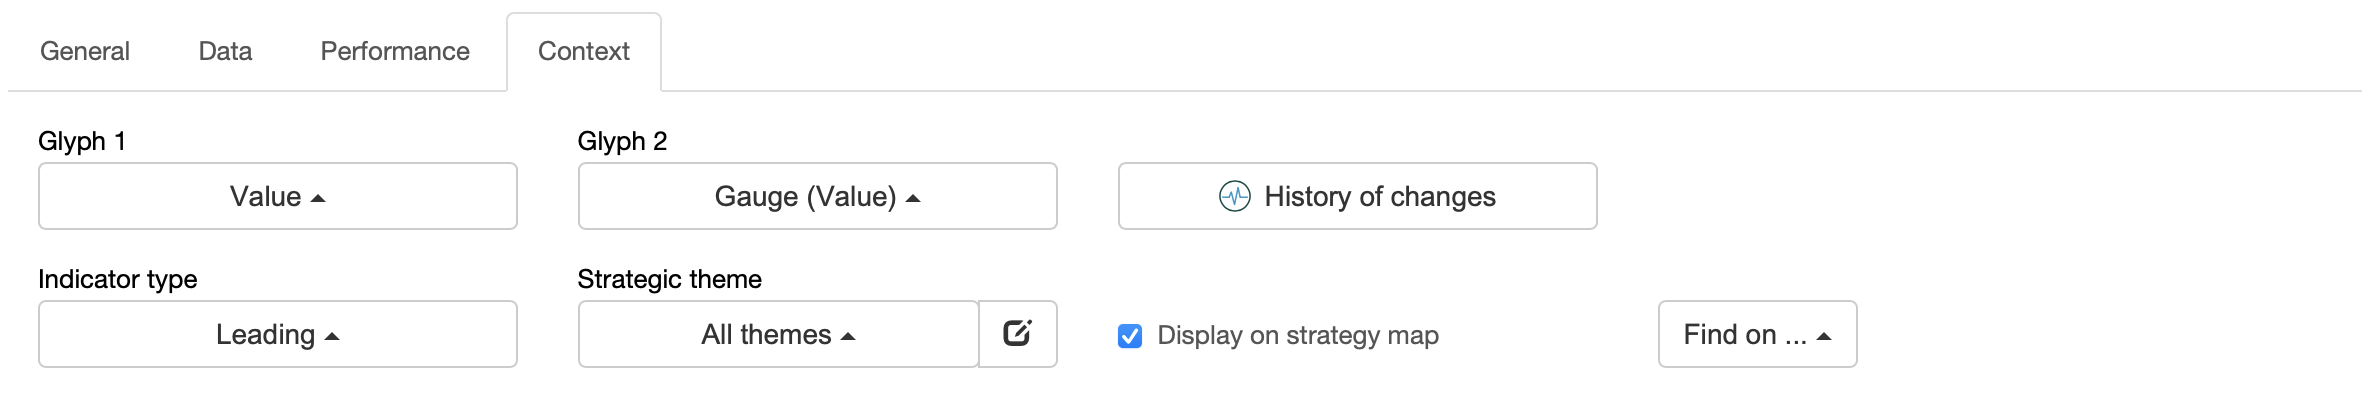
To manage leading indicators in BSC Designer:
- Choose any indicator
- Navigate to the Context tab
- Update the indicator type to ‘Leading‘”
The impact of leading and lagging indicators on the performance of their aligned goals is as follows:
- The performance of leading indicators contributes to the leading performance of the goal (seen on the map in the green rectangle under the goal’s name).
- The performance of lagging indicators contributes to the lagging performance of the goal (grey rectangle under the goal).
If the goal is aligned with another goal by data, it contributes to the other goal through its lagging performance.
Increased Adoption of Data Governance and Risk Functions in the Aviation Sector
Regarding the software automation level, we observed that users in the aviation sector were more engaged in adopting specific software functions.
- Data localization: As a more regulated industry, clients requested to host their accounts in the data center in their region.
- Security mechanics: The use of security mechanisms built into the software, such as two-factor authorization, audit trail, and data locking for historical data.
- Risk identification: A significant number of goals have their risks identified with risk definitions and key risk indicators.
- Adapting terminology: Clients from the aviation domain more frequently included additional properties to the KPI via custom fields.
- Reporting for stakeholders: The use of custom report profiles, as well as scheduled reports, is significantly higher.
Summary
This case study addresses challenges in strategic planning and performance management within the aviation industry.
Key highlights include:
- The application of various business frameworks to address the evolving demands within the aviation sector
- The rationale behind organizations using strategy architecture based on aligned scorecards over a monolithic approach
- The prevalent use of a binary measurement paradigm and the emphasis on leading indicators
Lastly, we illustrate how BSC Designer, a specialized strategic planning software, effectively addresses and resolves these challenges in real-world scenarios.
- Strategic Planning in the Airport Industry, National Academies of Sciences, Engineering, and Medicine, 2009 ↩
- The Globe: Singapore Airlines’ Balancing Act, Loizos Heracleous, Jochen Wirtz, 2010, HBR ↩
BSC Designer is strategy execution software that enhances strategy formulation and execution through KPIs, strategy maps, and dashboards. Our proprietary strategy implementation system guides companies in practical application of strategic planning.