Safety KPIs can be divided into the lagging ones that help to quantify something that has already happened (incidents and injuries) and leading metrics that work proactively and help to prevent future safety events.
Key topics:
- Safety KPIs
- Strategy map for safety
- Examples, including KPIs for safety in the context of Covid-19
Most likely, you already have a long list of lagging metrics like:
- Reported Accidents/Incidents
- Lost Time Injury Frequency Rate
I suggest spending most of the time talking about preventive/leading KPIs for safety.
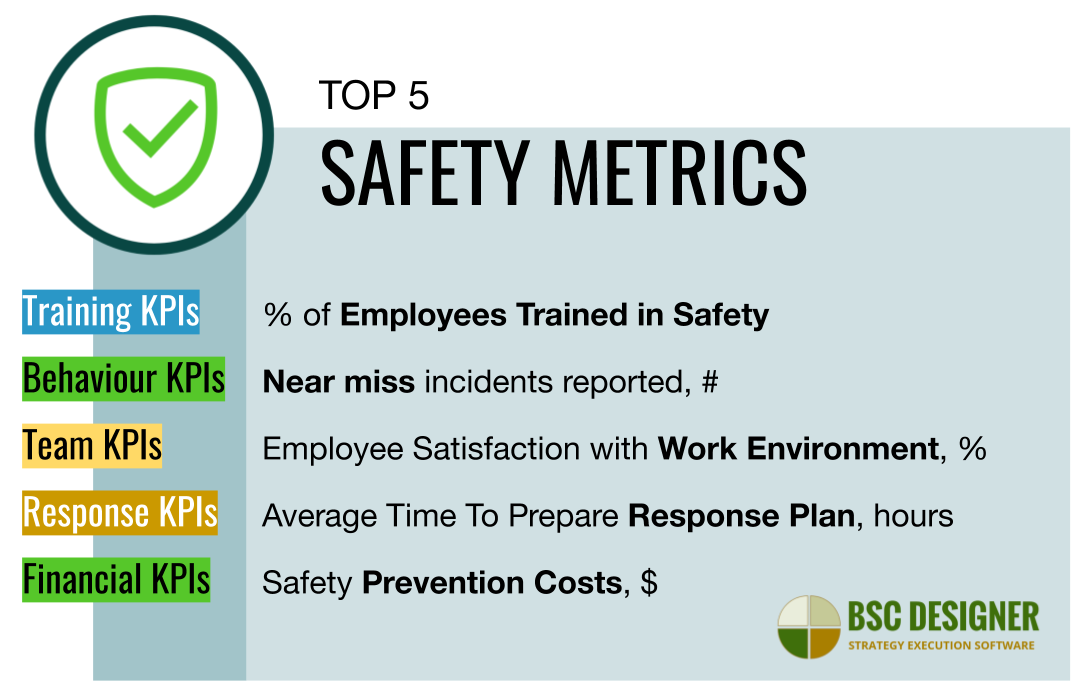
Leading Indicators for Safety
Looking at leading factors of safety, we can define several areas of interest.
Training KPIs
Basic training in safety is a leading factor of a safer environment:
- % of Management Trained in Safety
- % of Employees Trained in Safety
There is a training scorecard that can be used to track safety training initiatives on four different levels.
Behaviour KPIs
Passing safety training doesn’t mean that the actual behaviour became safer; we need to look at:
- Number and type of unsafe behaviours reported
- Near miss incidents reported (we discussed near miss in detail in Quality scorecard)
Team KPIs
High employees morale leads to fewer safety incidents. Look at:
- Average Overtime Hours Per Person
- Employee Satisfaction with Work Environment
- Employee Engagement
Response KPIs
Safety issues need to be fixed fast:
- Average Time To Prepare Response Plan
- Average Time To Resolution of Reported Issue
Financial KPIs
There should always be a budget for safety.
- Safety Prevention Costs
Similar to the cost of low quality, we can use cost of low safety as a decision factor when finding budget for new safety initiatives:
- Cost of Low Safety
- Cost of High safety
Equipment KPIs
Broken equipment doesn’t necessary mean a safety issue, but it could be a leading factor:
- Equipment Breakdowns
- % of Equipment where Preventive Maintenance Was Performed
Inspection KPIs
Safety environment should be formally validated:
- Number of audits or inspections performed
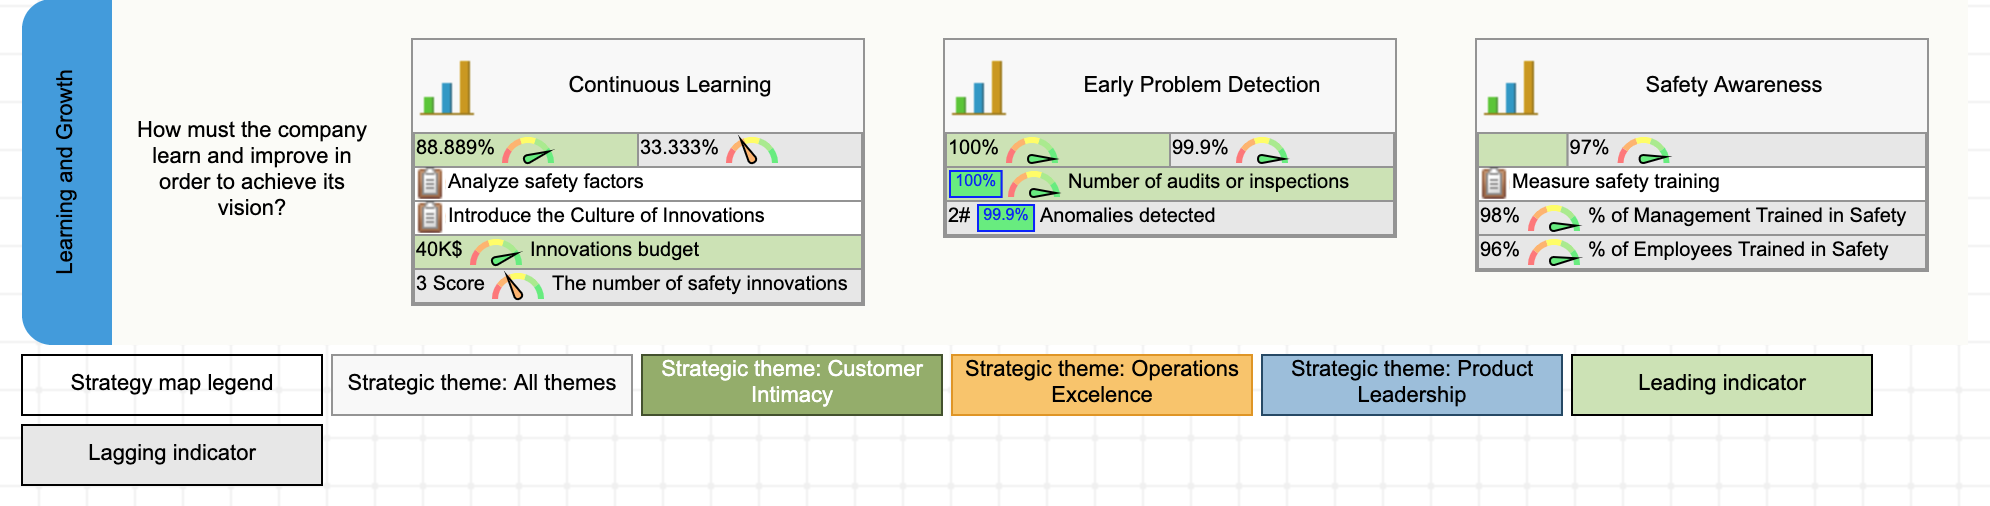
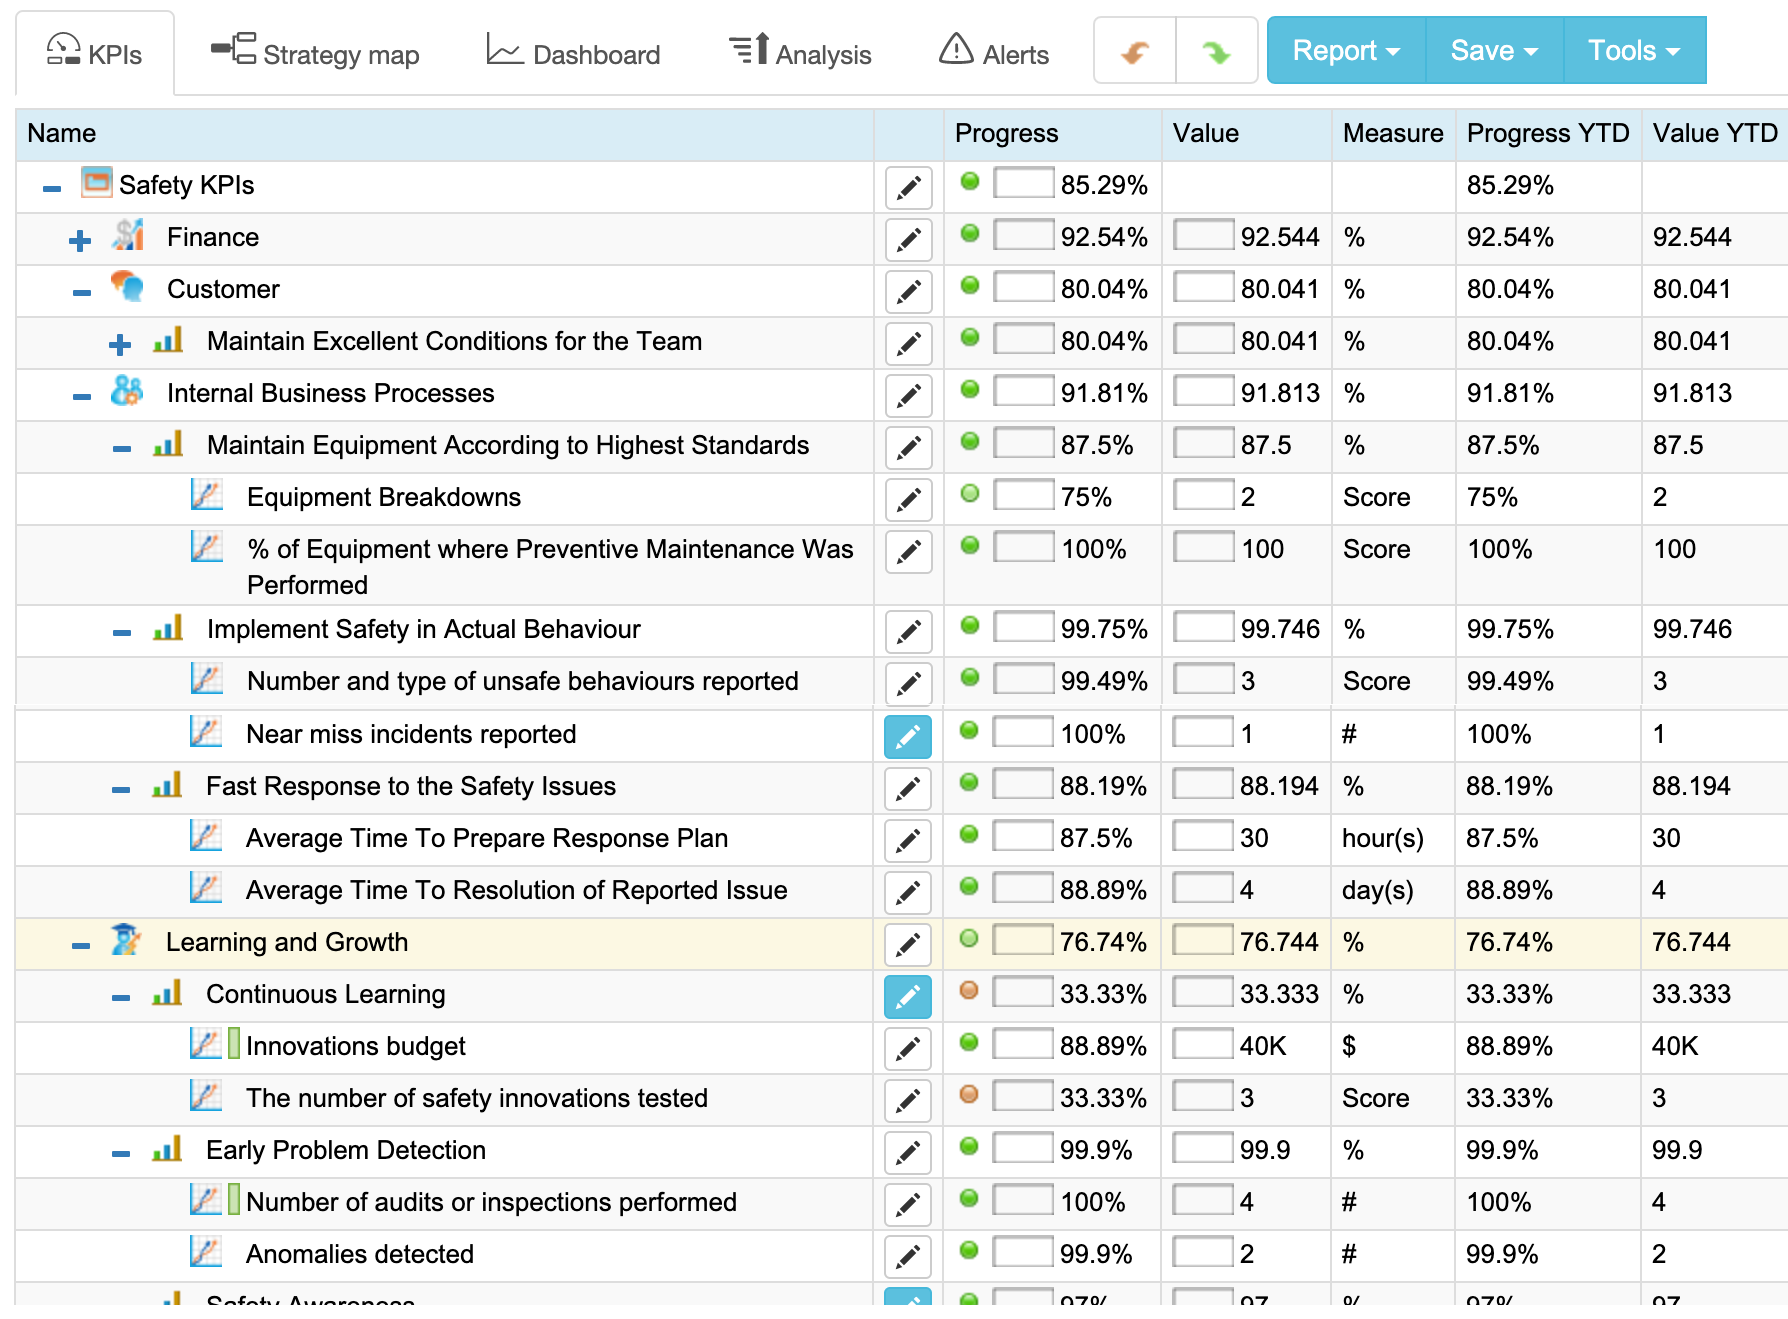
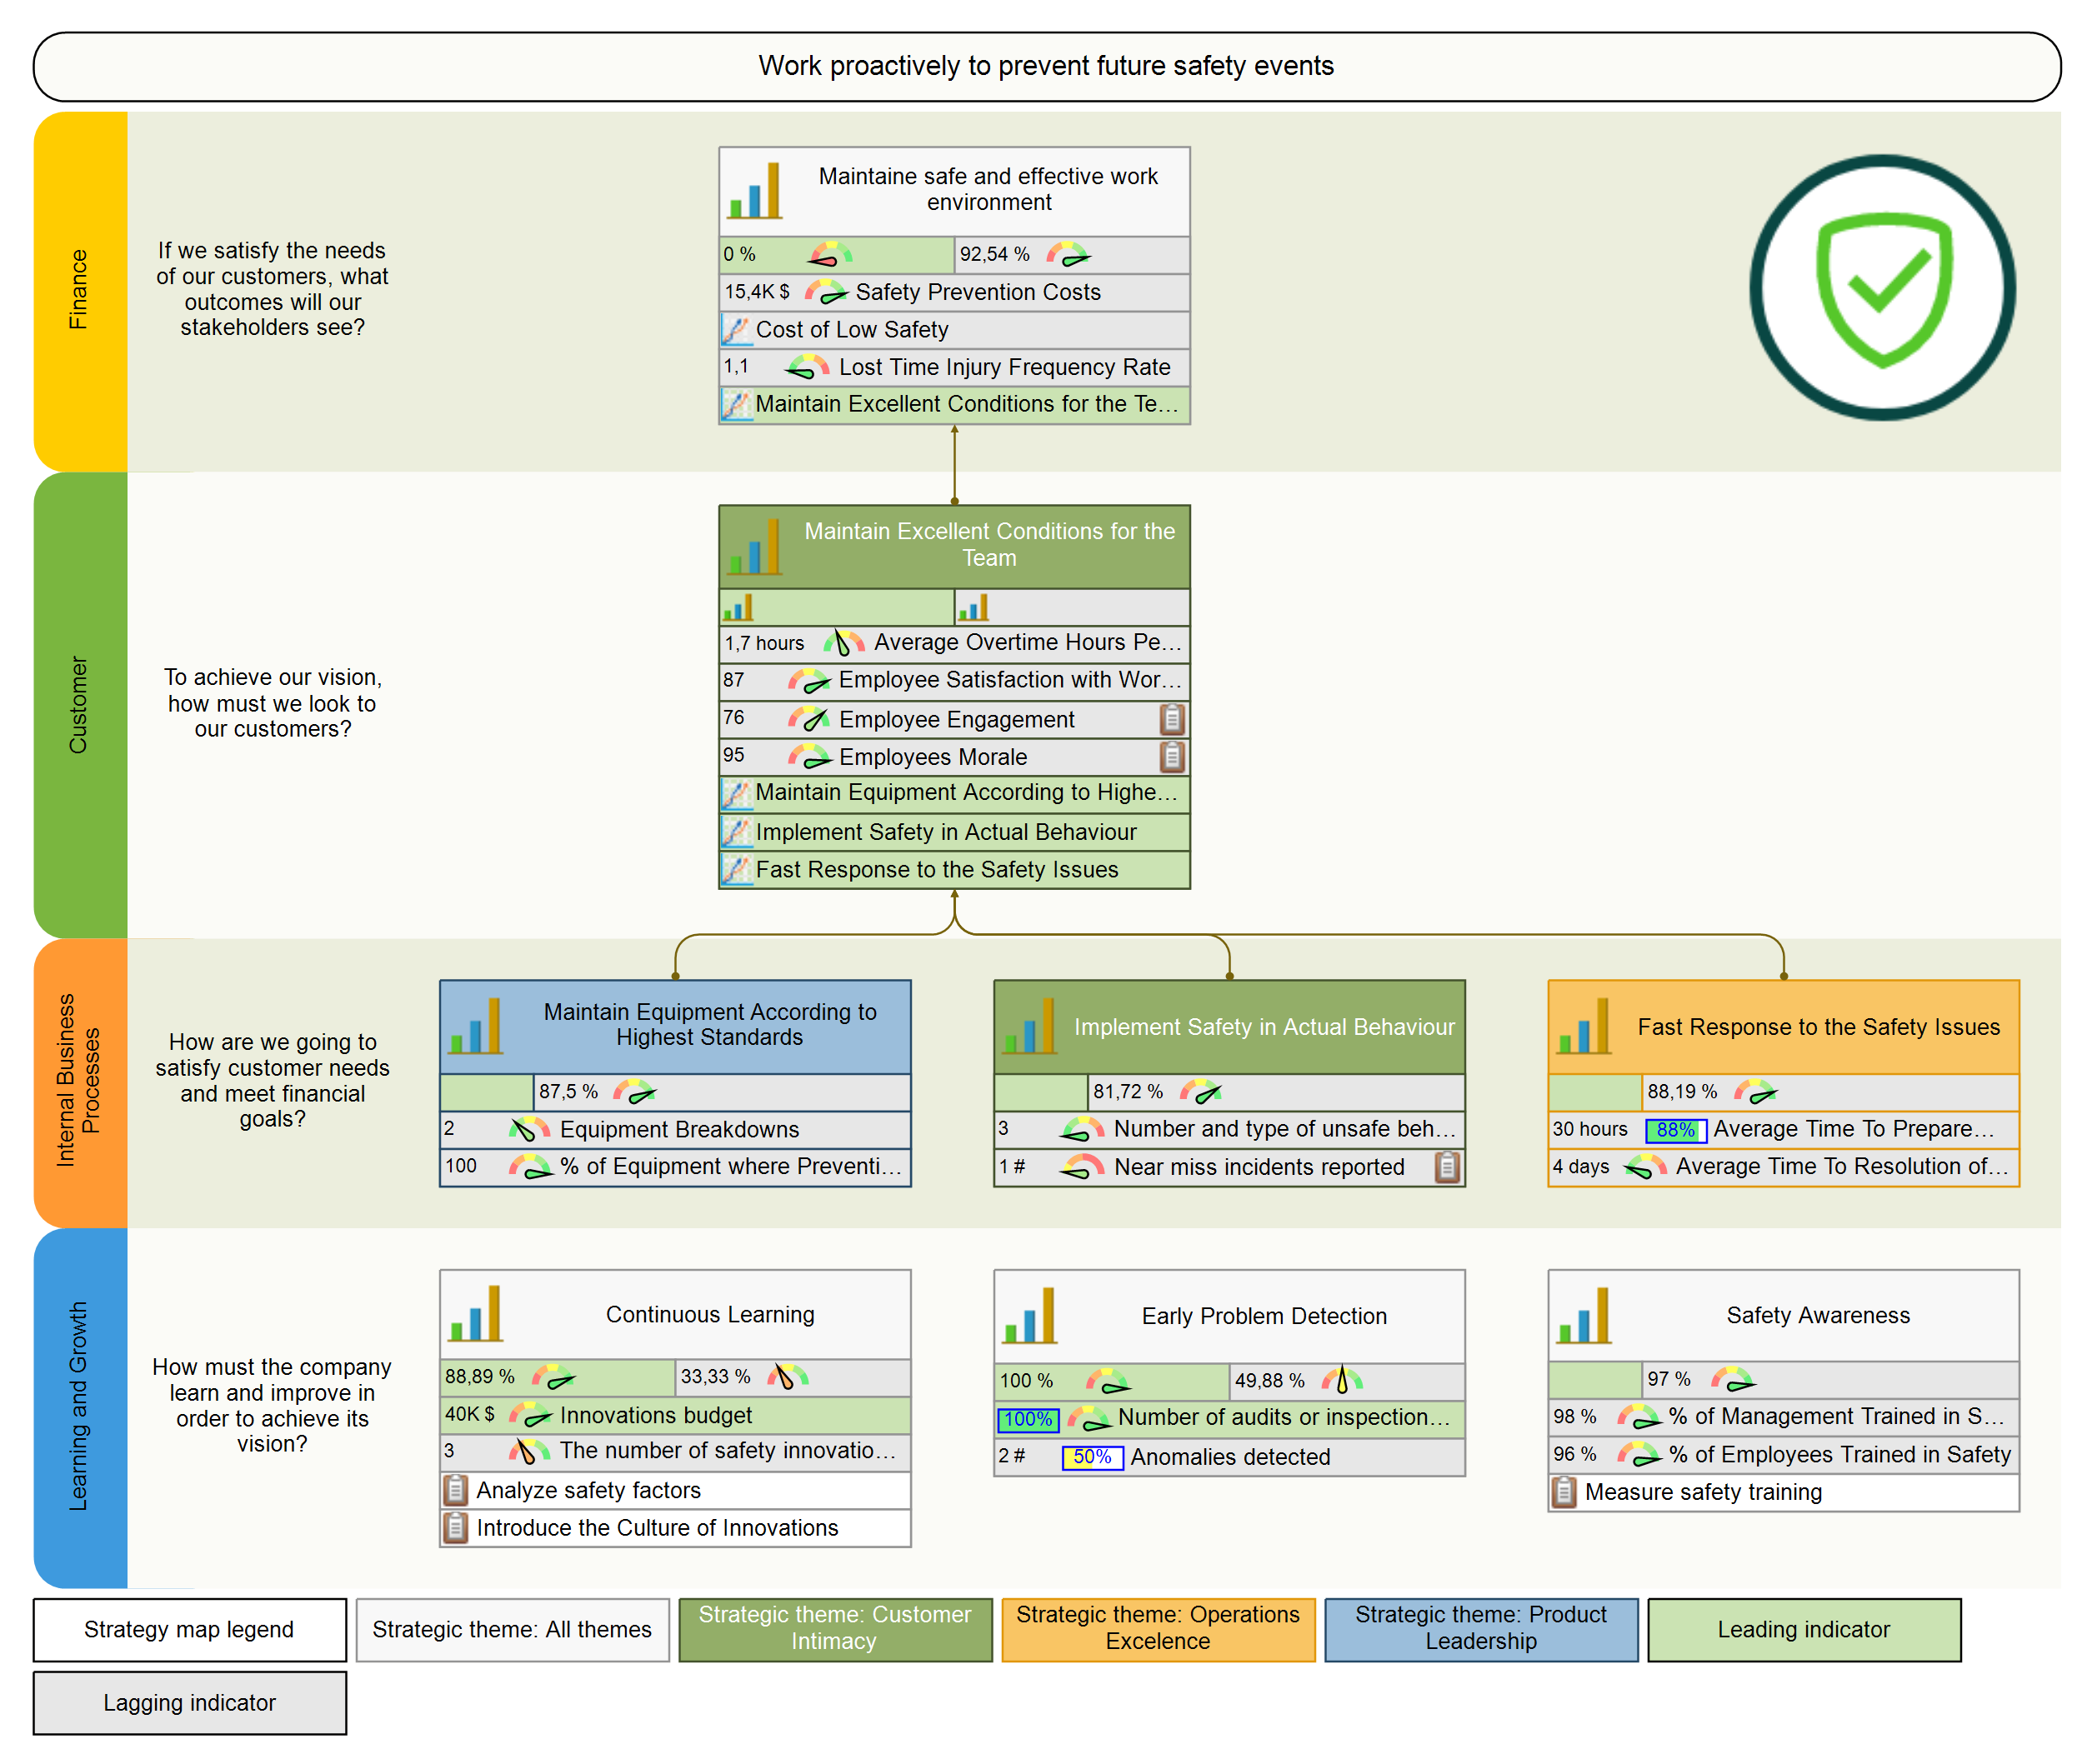
Strategy Map for Safety
Here you have an example of the Balanced Scorecard strategy map for safety automated with BSC Designer Online software.
Alcoa Example: Priority of Safety over Financial KPIs
What if someone were to tell you that to improve the overall performance of your company, you need to focus all your efforts on … worker’s safety? Your current safety indicators are in the green zone, and their values are even better than the ones all over the industry. What a surprise when a new CEO is talking to the investors and shareholders, not about ROI, investments, and financial efficiency, but about … safety.
Focus on Safety Metrics
That’s what Paul O’Neill did when he came to Alcoa in 1987 as chairman and CEO. Alcoa deals with molten aluminum, and their injury rate per 100 worker per year was 1.86 (quite good compared to the national rate in the U.S. that was 5 incidents per 100 workers). The new CEO established a goal – “achieve zero injuries level” at the organization where people handle molten metals.
Did the company achieve this goal? Today, Alcoa publishes their safety data in real time1. When I was writing this article, the rate was at 0.120. In other words, on average, workers at Alcoa take less risk in getting injured than employees of a software company or a legal office.
Alcoa´s Action Plan
How did this company do this?
- They became “obsessed” with safety!
Any safety incident was reported within 24 hours to the management. The reports contained an analysis of the situation and the prevention plan for the future. They were really serious about it, and one top manager was even fired for not reporting a safety incident. Safety was not just a part of the bureaucratic reports; it was in the focus.
- There was always a budget for improving safety – from installing new sensors and proactive maintenance to training people about safety; they even implemented an email system to … report about safety problems more efficiently.
Side Effect of Focus on Safety
There was a “side effect” of this focus. People started sharing other ideas, and some of them lead to some significant process improvements. And more importantly, the financial results of the company were improving as well.
To learn the full story, you can start with this article2 by Pulitzer Prize–winning business reporter Charles Duhigg. If you liked the story, I do recommend reading a book 3, where Charles Duhigg explores the nature of habits (or their business analog – routines) by giving some great examples of how to improve organizational performance.
Qatar Airways Group Example: Understanding Context of Measurement
Another interesting example is the Qatar Airways Group. They are really serious about measuring, reporting, and improving safety:
- They know how to interpret the data obtained
- They know their lagging metrics but focus a lot on leading factors
- They cascaded the strategy well from top level goals to specific initiatives
According to the Sustainability Report 20184 one of the measures of safety performance that they used was a classical Lost Time Injury Frequency Rate (LTIFR) KPI:
- The value of the indicator was decreasing starting from the year 2012, showing excellent progress.
- From 2015 to 2017, there was almost no improvement in LTIFR
The trick is that the “no improvement” period correlates with the rapid expansion of the group. That’s a good example of how important the business context is for interpreting the value of any metric.
Another best practice that the group follows: the sustainability report features just few lagging indicators for safety but talks a lot about safety success factors (that can be quantified with the leading metrics discussed above) and proactive safety procedures, such as:
- Workspace safety inspections and
- Safety engagement
Finally, in their strategic plan, we can find some safety-related themes like:
- Training and awareness
- Health and Safety Management System
- Safety Communities
- Fire Safety
That is further cascaded into sub-themes, specific projects, and progress estimation.
Covid-19: Impact on Safety KPIs
In the context of pandemic Covid-19, safety KPIs need to be adjusted:
The success factors of employee safety can be quantified by:
- Awareness training penetration, % as well as
- Application of preventive measures, %
The outcomes of the safety measures in the context of the Coronavirus can be measured by a:
- % of behavior actually adjusted according to the requirements.
The gap between the expected and implemented will show the efficiency of the measures implemented.
The goal “Maintain excellent conditions for the team” can be expanded with the work-from-home initiatives, where the employer needs to focus on:
- Doing awareness training on the work-from-home model
- Providing tools and materials needed for remote work
- Establishing clear performance measurement standards
The Covid-19 impact goes far beyond updating safety policies. We recommend using the business continuity strategy map template to analyze the overall impact of the Coronavirus on your organization and prepare a response strategy.
What's next?- Follow our
 Strategy Implementation System to align stakeholders, strategic ambitions, and business frameworks into a comprehensive strategy.
 - Automate strategic planning with BSC Designer by organizing goals, initiatives, risks, and KPIs into scorecards.
More About Strategic Planning


- Zero Is Possible, Alcoa Worldwide website. ↩
- How ‘Keystone Habits’ Transformed a Corporation, Charles Duhigg, 2012, The Huffington Post. ↩
- The Power of Habit: Why We Do What We Do in Life and Business, Charles Duhigg, 2014, Random House. ↩
- Safety Performance section, Sustainability Report 2018, Qatar Airways Group ↩
![]() CEO | Author | Speaker
CEO | Author | Speaker
BSC Designer is strategy execution software that enhances strategy formulation and execution through tangible KPIs. Our proprietary strategy implementation system reflects our practical experience in the strategy domain.
Interesting thoughts about cornerstone of Barça’s (FC Barcelona) identity: “Coaches and players may come and go, but the cornerstone of Barça’s
identity is La Masía (The Farmhouse), the club’s youth academy.”
https://hbr.org/2015/06/what-makes-fc-barcelona-such-a-successful-business
Elon Musk during Tesla AI Day 2022 about Full Self Driving:
“The fundamental metric to optimise against is … how many miles the car can drive on full autonomy before the safety critical intervention is required” https://youtu.be/Y4tS0iVkFbg Interesting metric to take into account when quantifying safety