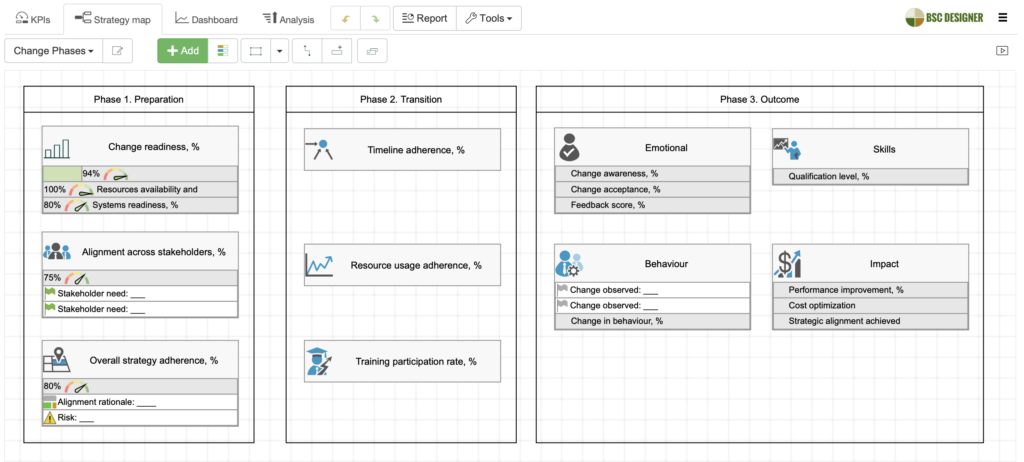
A change management framework with KPIs according to the three phases of change: (1) preparation, (2) transition and (3) outcome.
What is Change Management?
Change management is a disciplined approach to reproducing previously tested best practices under slightly different conditions (new stakeholders involved, natural changes in the environment, etc.)
In contrast to innovation, change is more tangible. We are working in the area of known and are implementing according to the previously tested best practices, such as validated results of innovations.
The template from this article helps with establishing a systematic approach to change by quantifying the change in these phases:
- Phase 1. Preparation phase
- Phase 2. Transition phase
- Phase 3. Outcome phase
In the ITIL section, we review the change management metrics in the IT domain.
KPIs for Phase 1 – Preparation
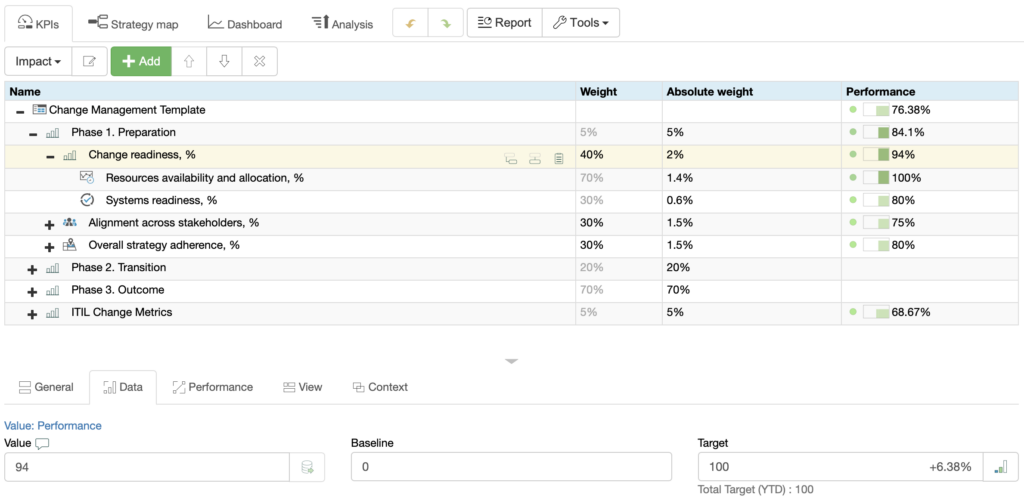
The main indicator, in this case, is weighted index Change readiness, %.
The index can be a combination of:
- Resources availability or resources allocation, % Use the VRIO framework for a formal analysis.
- Systems readiness, % Analyze the business systems and relevant dependencies to find the blocking points.
We can also consider:
- Alignment across stakeholders, %. Use the results of a stakeholder analysis to align the change strategy with the needs of key stakeholders.
- Overall strategy adherence, %. Check if the suggested change and the way to implement it is aligned with the company’s vision. Ideally, the change initiative should be aligned with a specific goal on a strategy map.
Example
Let’s use improvement of internal knowledge base as an example. The change consists in uploading more response templates for support agents.
The metrics of change readiness are easy to quantify:
- We have all the resources available, so we change the current value for Resources availability and allocation, % [weight = 70%] to 100%
- Certain business systems still need some adjustments, the value of Systems readiness, % [weight = 30%] is 80%
Taking into account the weights of the indicators in the index, the change readiness is now 94%.
The main stakeholders involved are support agents and end users:
- The need of support agents is to have previously approved response templates.
- The need of the customers is getting a quick answer without needing to contact customer service with the same question again.
We use the template to map the needs of the stakeholders and specify the estimated state of the indicator.
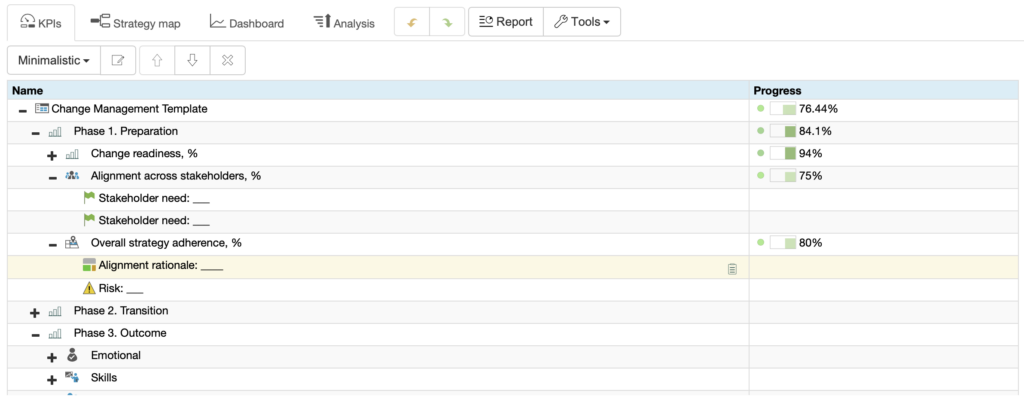
In terms of strategy adherence:
- The alignment rationale is that time-proven response templates will help customer service specialists to serve clients better and reduce general costs.
- Possible risk: template-based answers might be perceived by customers negatively; the risk mitigation plan is to track customer satisfaction and adjust template usage accordingly.
The suggested change is 100% aligned with the strategy.
KPIs for Phase 2 – Transition
In contrast to innovation, where we deal with a hypothesis, change management is about predictable process. Respectively, we can use process metrics, such as:
- Timeline adherence, %
- Resource usage adherence, %
In most cases, change involves employees and gaining new skills. Respectively, one of the metrics for the transition phase can be:
- Training participation rate, %
Example
In our example:
- We can plan that the whole transition to the updated knowledge base will take 2 months. This gives us a target value for the Timeline adherence.
- Once the new knowledge base is released, we have to train all agents to use it. The target for the Training participation rate should be 100%. We plan to achieve this within 2 weeks after the release date.
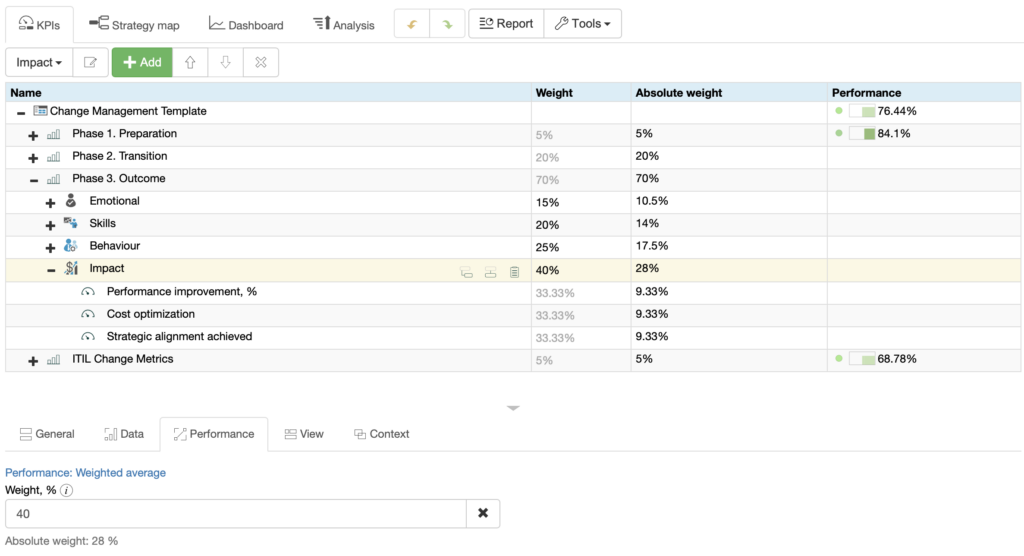
KPIs for Phase 3 – Outcome
In most cases, change management involves employee training and adjusting certain behaviour patterns. The results of change can be quantified on different levels. For example, on these four:
- Emotional – how your team perceived the change
- Skills – how the qualification of team members changed
- Behaviour – how the actual behaviour of employees changed
- Impact – validate once again, if the change affected overall performance as expected
For the emotional level, we can look at:
- Change awareness, %
- Employee buy-in, % or Change acceptance, %
- Feedback score, %
For the skills level, we can track:
- Qualification level, % (for example, according to the tests relevant to the change)
For the behaviour level, we can look at:
- Change in behaviour, %. For example, after implementation of the internal knowledge base, first line employees can answer a higher percentage of questions without escalating them to the engineering team.
For the impact level, we need to track actual business impact:
- Performance improvement or For example, we can confirm that the costs of customer support reduced over a period of time.
Example
Let’s see how we can quantify the results of change for our example:
- Emotional level. We’ll do an internal survey, asking support agents for their opinion about the new knowledge base.
- Skills level. As part of the change training, we’ll do a competence test.
- Behaviour level. Most importantly, we will look at how the actual behaviour of the support agents has changed. For example, we can post random questions and check if/how support agents use the new knowledge base.
- Impact level. Finally, we’ll plan to review the dynamic of the performance within a quarter to make sure that the new knowledge base actually helps us in cutting costs and improving overall customer satisfaction.
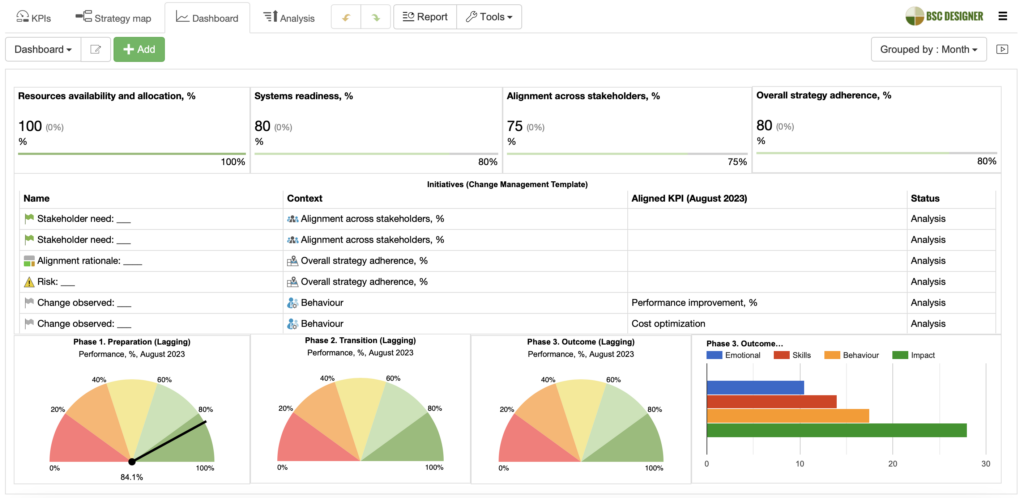
Change Management Dashboard
We can visualise the defined change indicators on the dashboard:
Change Metrics According to ITIL
ITIL suggests a different view on change focusing on process in the context of the IT domain.
Following the ITIL guidelines, we should be looking at the dynamic of the values (improvement or reduction of the indicator’s value). Users of BSC Designer can configure the view profile to display the ‘Dynamic’ column.
Dynamic of change:
- The number of change requests over a period of time.
- The number of change requests in backlog. An indicator of how fast your team is implementing the change requests.
- Average implementation time. Should be measured separately for different types of changes.
- Average review time.
- Average approval time.
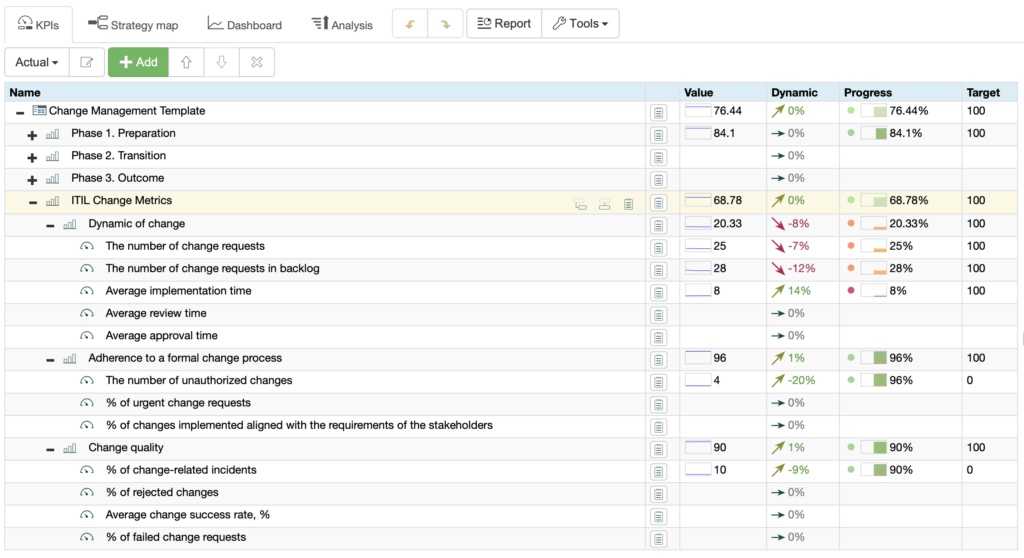
Adherence to a formal change process:
- The number of unauthorized changes. An indicator of adherence to a formal within team.
- % of changes implemented aligned with the requirements of the stakeholders (a lagging version of ‘Alignment across stakeholders, %)’
- % of urgent change requests.
Change quality:
- % of change-related incidents.
- % of rejected changes.
- Average change success rate, %. An aggregated indicator for the impact of changes over a period of time.
- % of failed change requests. The failure criteria might be not meeting minimal impact level.
The Difference Between Innovation and Change
Sometimes, the terms “innovation” and “change” are used interchangeably. Here is a comparison table that outlines some important differences between innovation and change first.
| Innovation | Change | |
| Is primarily focused on… | Unknown/Uncertainty | Known/Certainty |
| It’s about… | Testing hypothesis, e.g. moving from known A to unknown B | Executing plan, e.g. transition (for team and systems) from known A to known B |
| Guided by… | Insights (hopefully related to the mission and strategy) that will become a hypothesis and will eventually be converted into the best practices | Validated best practices that need to be implemented on a larger scale |
| Based on… | Hypothesis | Plan |
| It helps to… | Create something new | Reorganize something that already exists |
| Compared to each other | Innovation is always about change | Change is not necessarily an innovation |
Measurement for Change Management in a Nutshell
Let’s summarize how we can approach measuring a change:
- Change readiness index. Build your change readiness index. Make sure you know the context for the change (a goal on the strategy map), and that context is measurable (by the metrics aligned with the goal). Get the necessary political (stakeholders buy-in) and physical resources.
- Quantify transition phase. As long as change is about moving from known A to known B, the main metrics of the transition phase will be process efficiency. Add training efficiency KPIs if the change implies the need for new skills.
- Validate outcomes. Close the change loop using validation metrics. Makes sure that your team accepted the change emotionally, have the necessary skills, and actually changed their behaviour. The long-term positive impact on performance is implied, but it’s better to track it.
- Follow our
 Strategy Implementation System to align stakeholders, strategic ambitions, and business frameworks into a comprehensive strategy.
 - Automate strategic planning with BSC Designer by organizing goals, initiatives, risks, and KPIs into scorecards.
More About Strategic Planning


![]() CEO | Author | Speaker
CEO | Author | Speaker
BSC Designer is strategy execution software that enhances strategy formulation and execution through tangible KPIs. Our proprietary strategy implementation system reflects our practical experience in the strategy domain.