Examine growth opportunities within the competitive landscape, defined by four perspectives. Learn how to integrate Blue Ocean analysis into strategic planning.
The Role in the Strategic Planning Ecosystem
In 2004, the Blue Ocean Strategy was introduced in a Harvard Business Review article, offering a fresh perspective on markets without direct competition, shaped by the outcomes of innovation.
In the ‘Comparison of Strategic Planning Tools and Frameworks,’ we feature a diagram that categorizes various strategic planning tools according to their application area and decomposition method. The Blue Ocean Strategy corresponds to the “Strategic Analysis” segment of the diagram. The suggested decomposition method involves assessing the impact of factors on overall performance and defining them as follows:
- Factors that impact negatively on performance and need to be eliminated
- Factors that impact negatively but can only be reduced
- Existing factors that positively impact performance and need improvement
- Factors that don’t exist yet but may need to be created
Considering the causality between these factors and the expected performance improvement, we can place this framework into the segment that corresponds to the decomposition by “cause and effect.”
By its application area, Blue Ocean Strategy closely aligns with the VRIO framework in its pursuit of sustainable competitive advantages and complements the Ansoff Matrix as another tool to support the choice of one strategy over another.
Competitive Analysis
Once the factors are defined, our focus shifts to understanding our performance in relation to these factors and comparing it with the performance of our competitors.
In our template, we use the example of “Excessive bureaucracy.” Within this factor, we outline:
- Our performance
- The performance of Competitor 1
- The performance of Competitor 2
To quantify performance in this scenario, we use “Time to introduce new policy,” measured on a scale from 15 days to 120 days. The optimization function for this indicator is set to “Minimize value linearly.” The software then normalizes the indicator, essentially converting “days” into “percentages.” For instance, reducing the time to implement new policies to 15 days would result in 100% performance.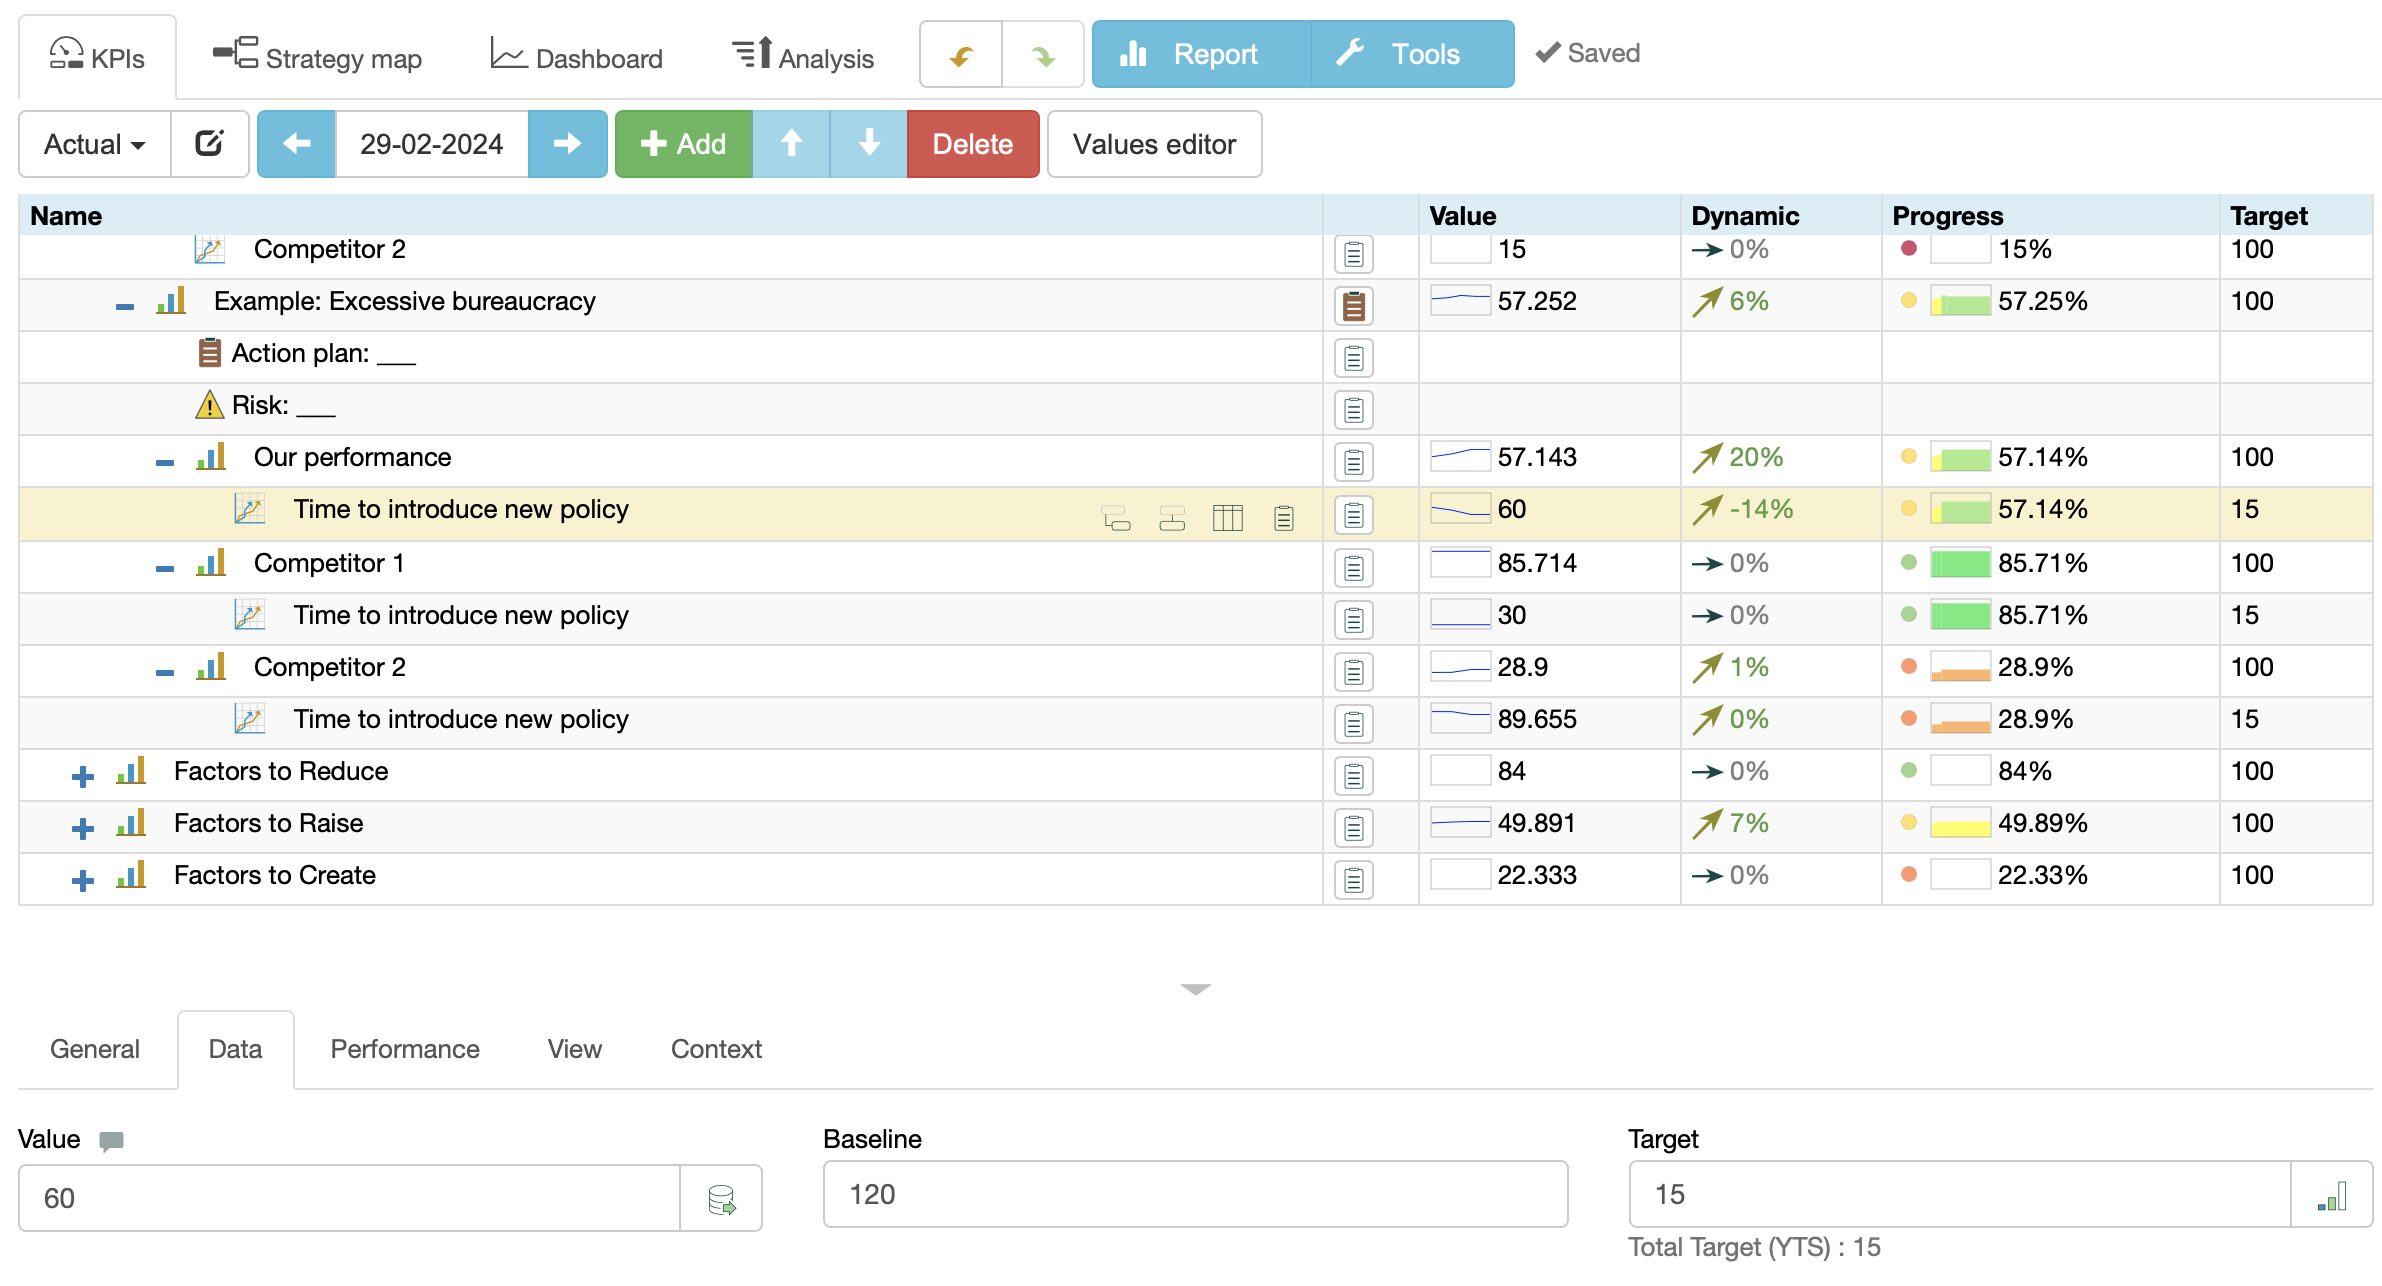
Using normalized values is crucial in this context, as it provides the freedom to construct an index of indicators to quantify excessive bureaucracy. Our organization’s index can be detailed, whereas competitive organizations might use one or two indicators. Once the software normalizes the data, it becomes comparable.
Action Plans for Improvement Goals
At this point, we have identified a factor we aim to eliminate – “Excessive bureaucracy,” and we have also defined the metric that quantifies it – “Time to introduce new policy.” To initiate work on this factor, we currently lack an action plan.
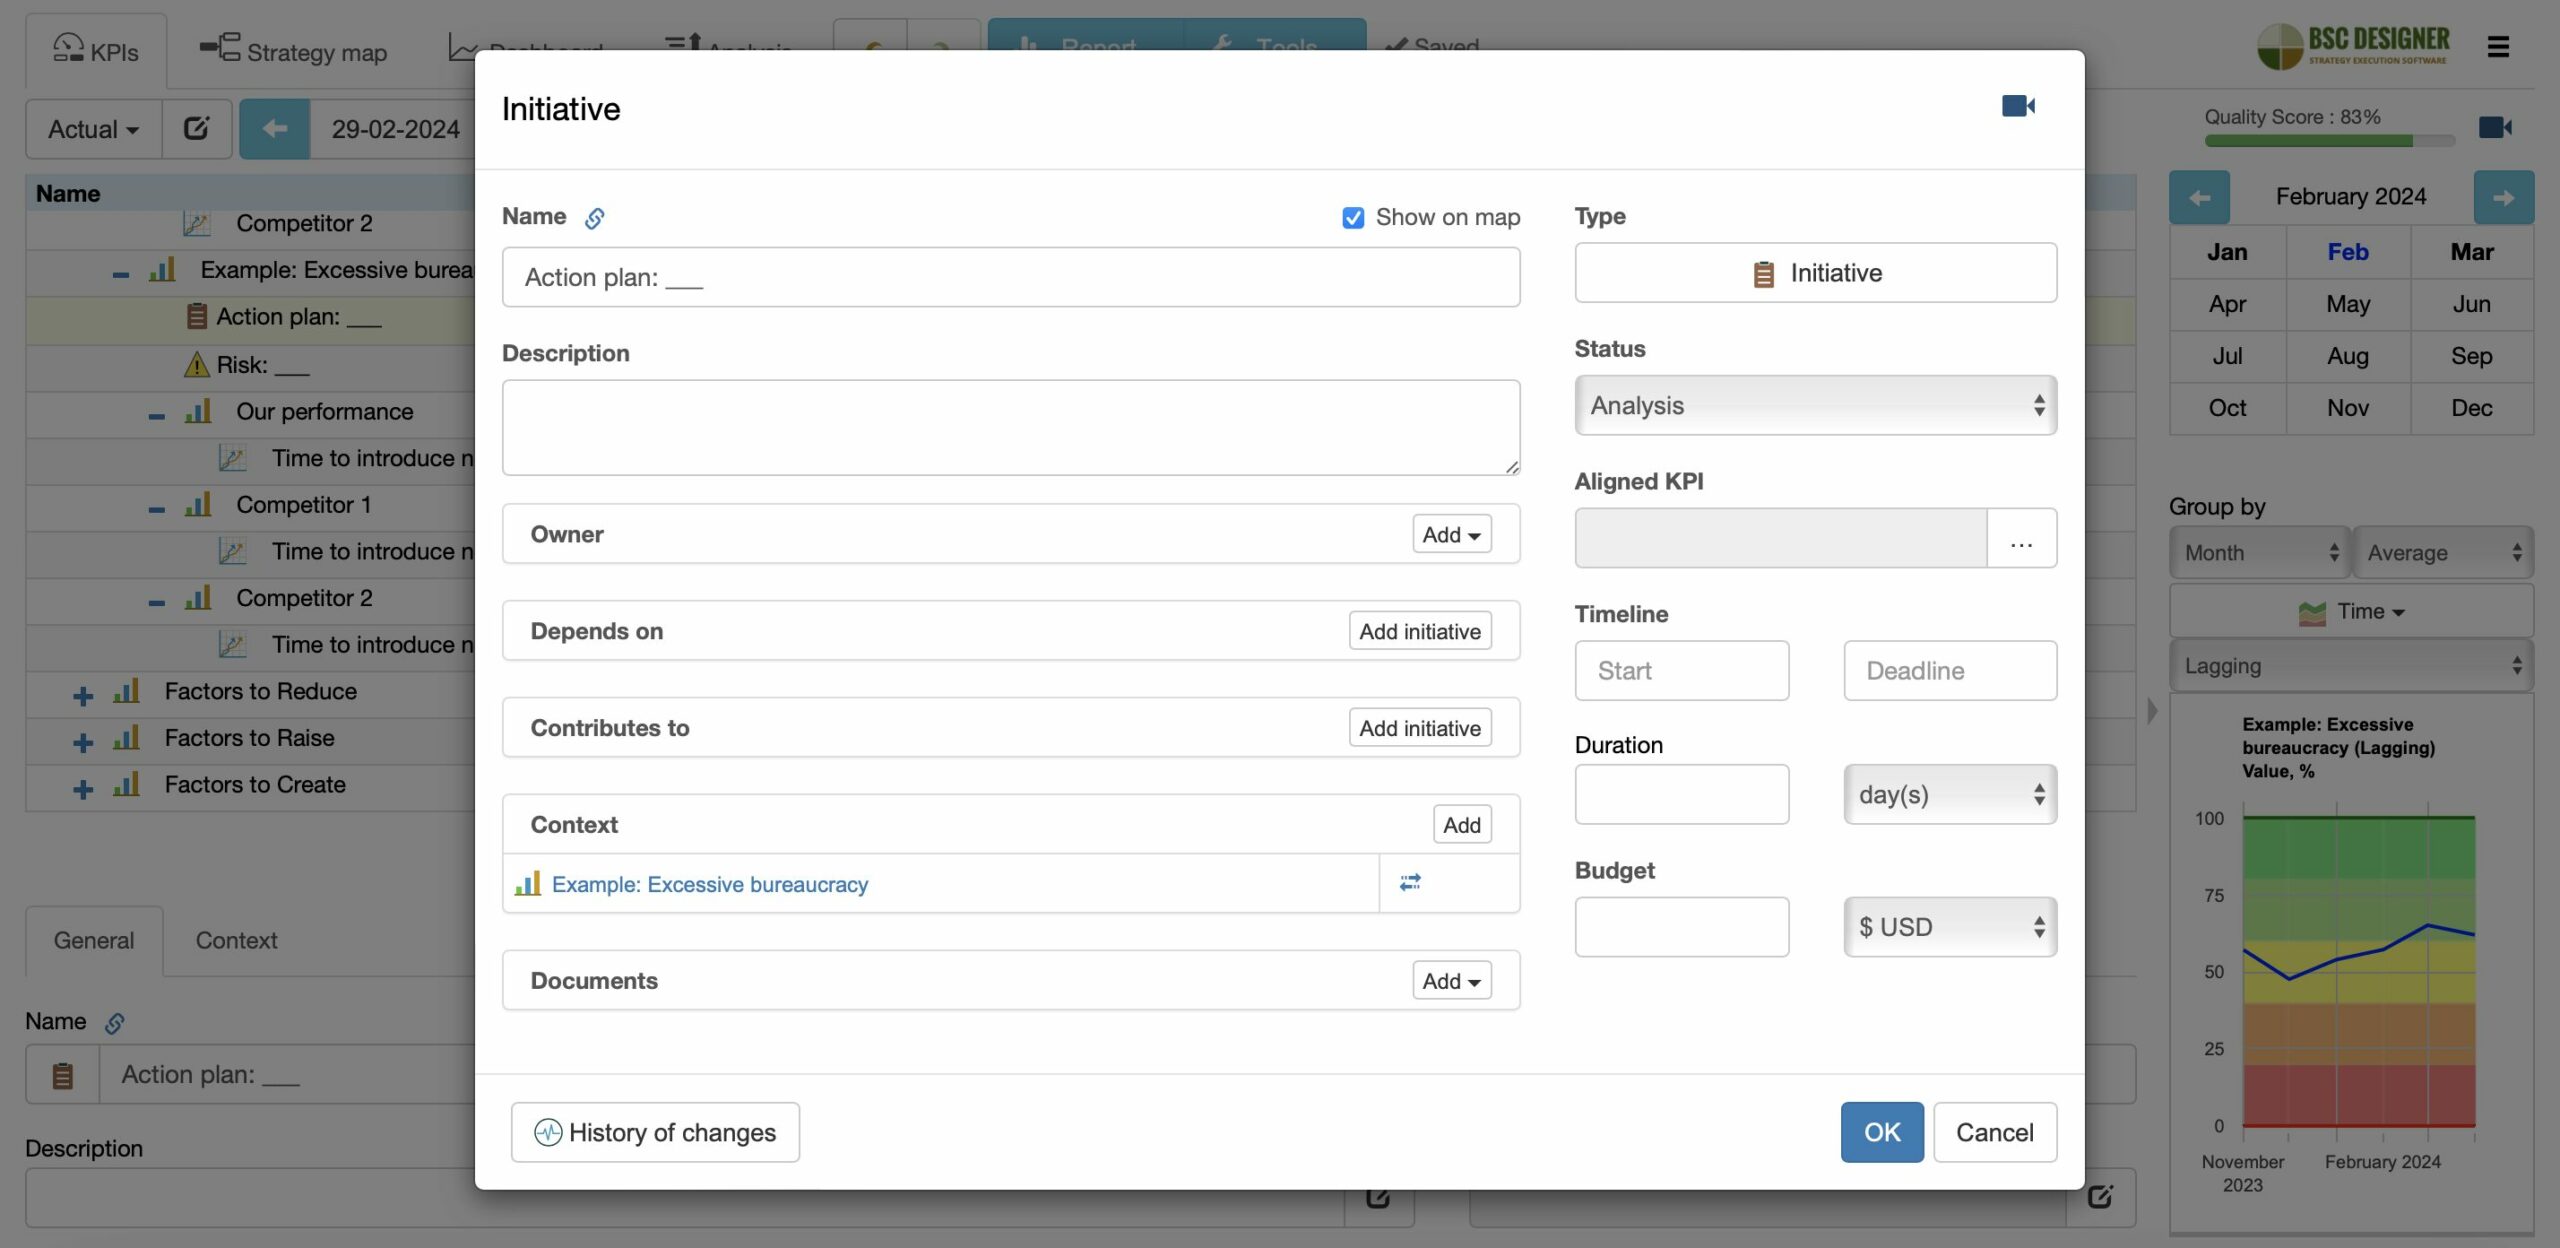
To define the action plan, we use the Initiatives button, where we can create a new initiative and specify its properties:
- Name and description
- Select the indicator that will measure the progress of this initiative
- Timeline and budget
- Assign owner
- Define dependencies of the initiative
- Upload relevant documents
In strategic planning, we consistently confront the effects of uncertainty. By outlining the risks associated with our goals, we provide our team with valuable information about the context they are dealing with. To add a risk, we follow the same steps as those for an initiative, changing the type of the item to “Risk.”
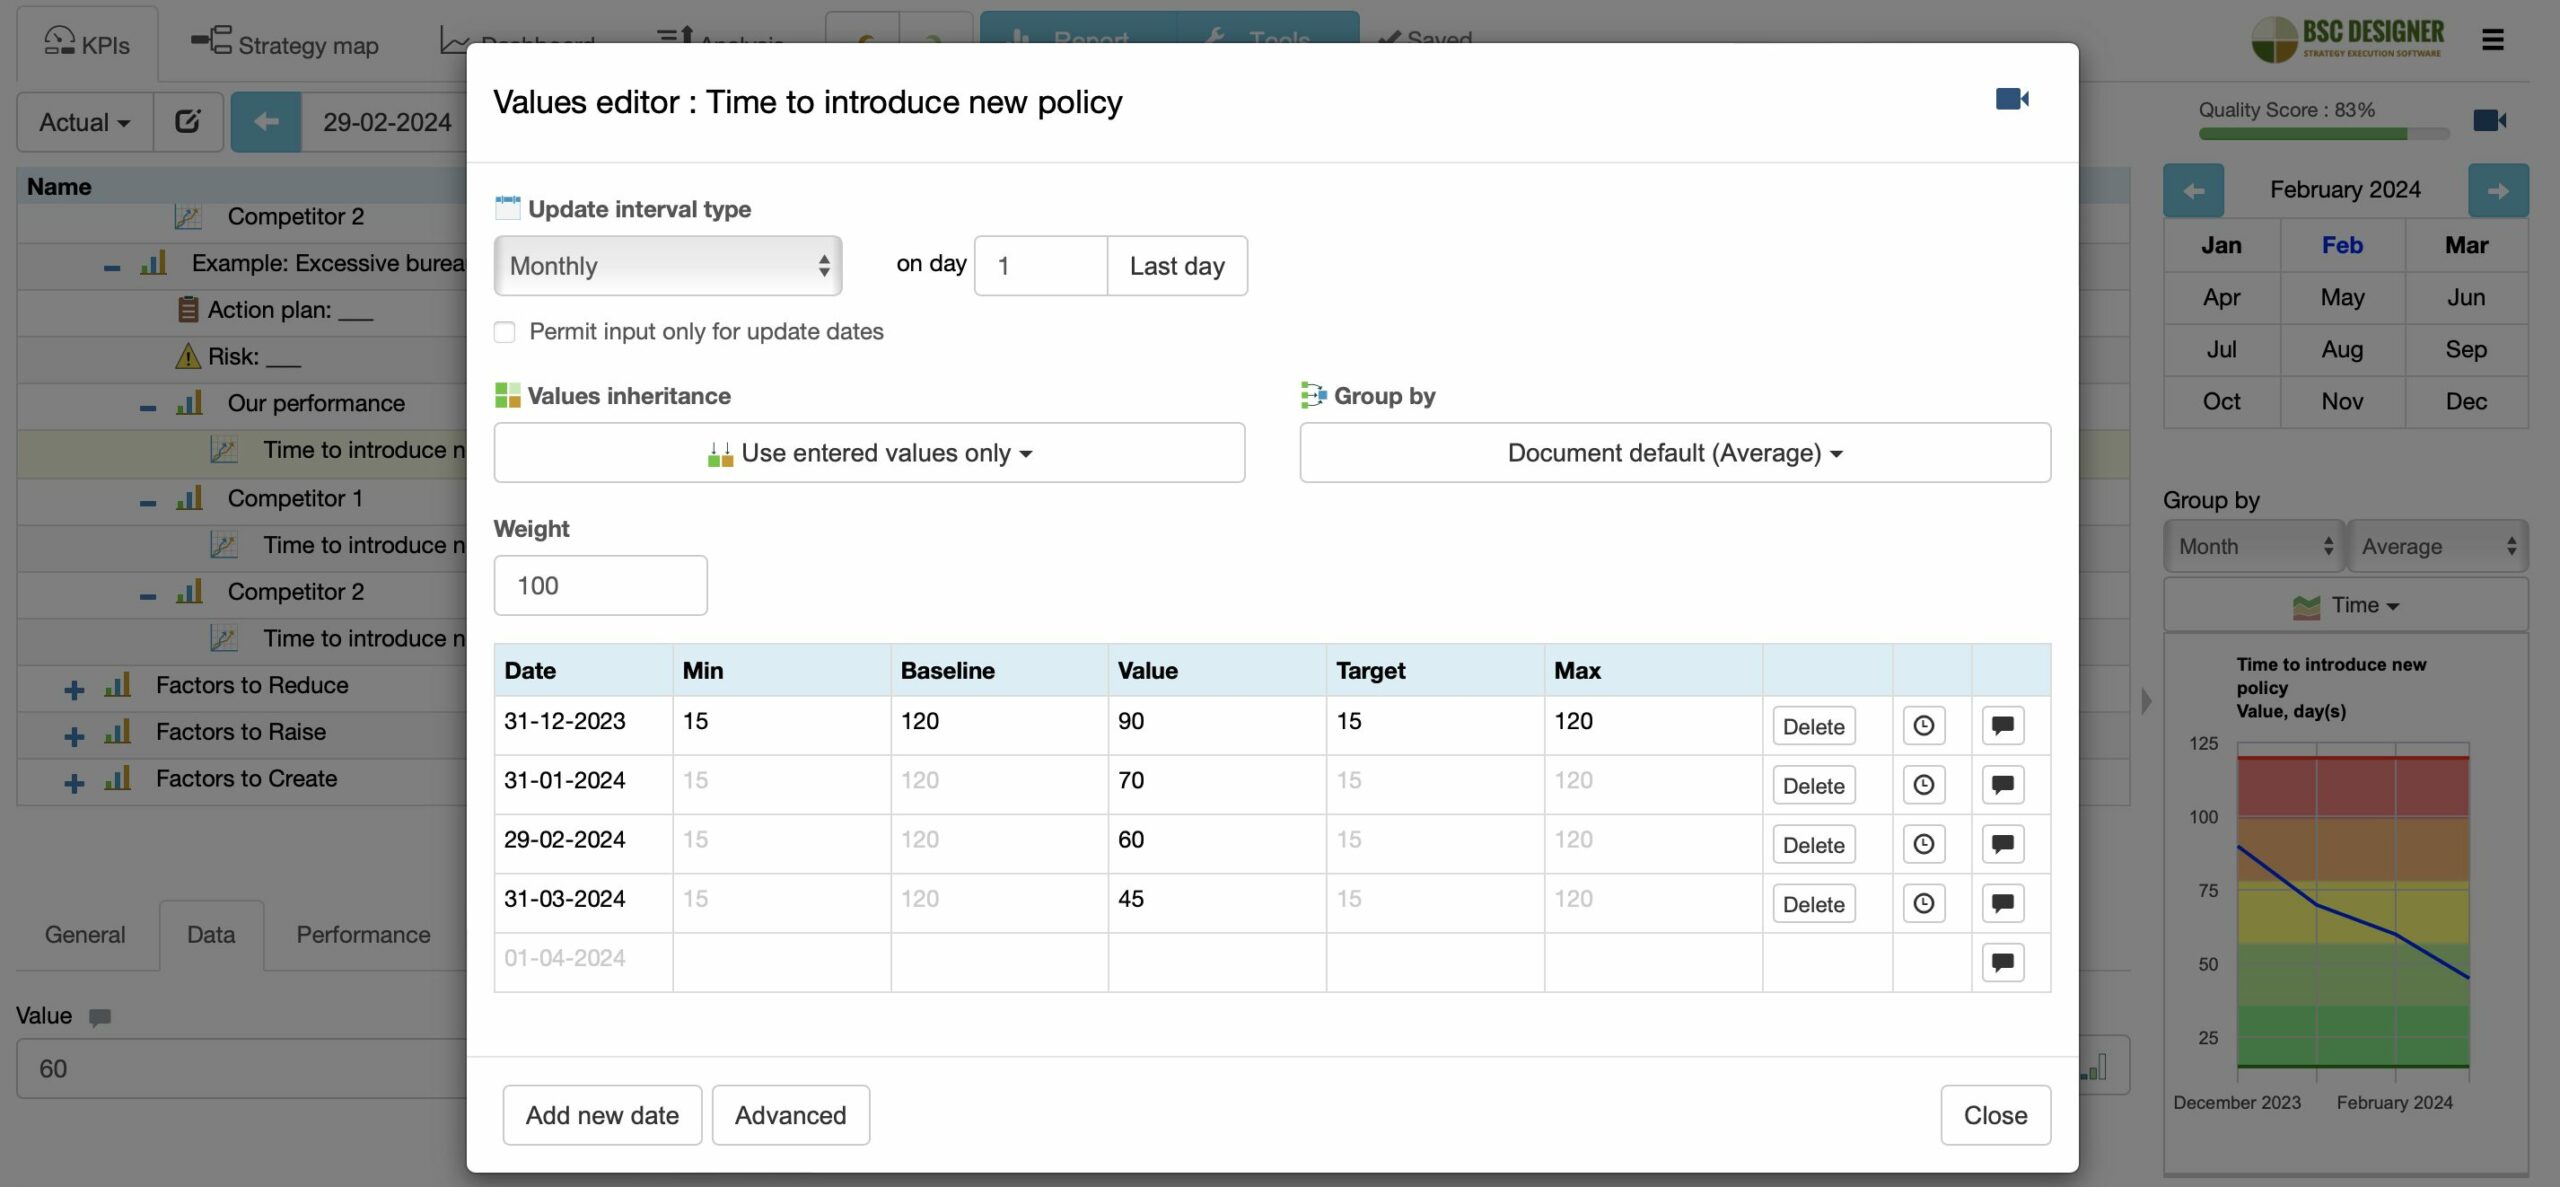
Tracking Metrics over Time
We used the Values Editor to input data for the “Time to introduce new policy” over time. Through the Values Editor, we can see that:
- This indicator is updated monthly.
- Its grouping type is average, meaning that if I wish to view the annual aggregated value, the software would calculate it as the average.
- We used the table below to input data for the coming months, allowing us to track the metric’s evolution over time.
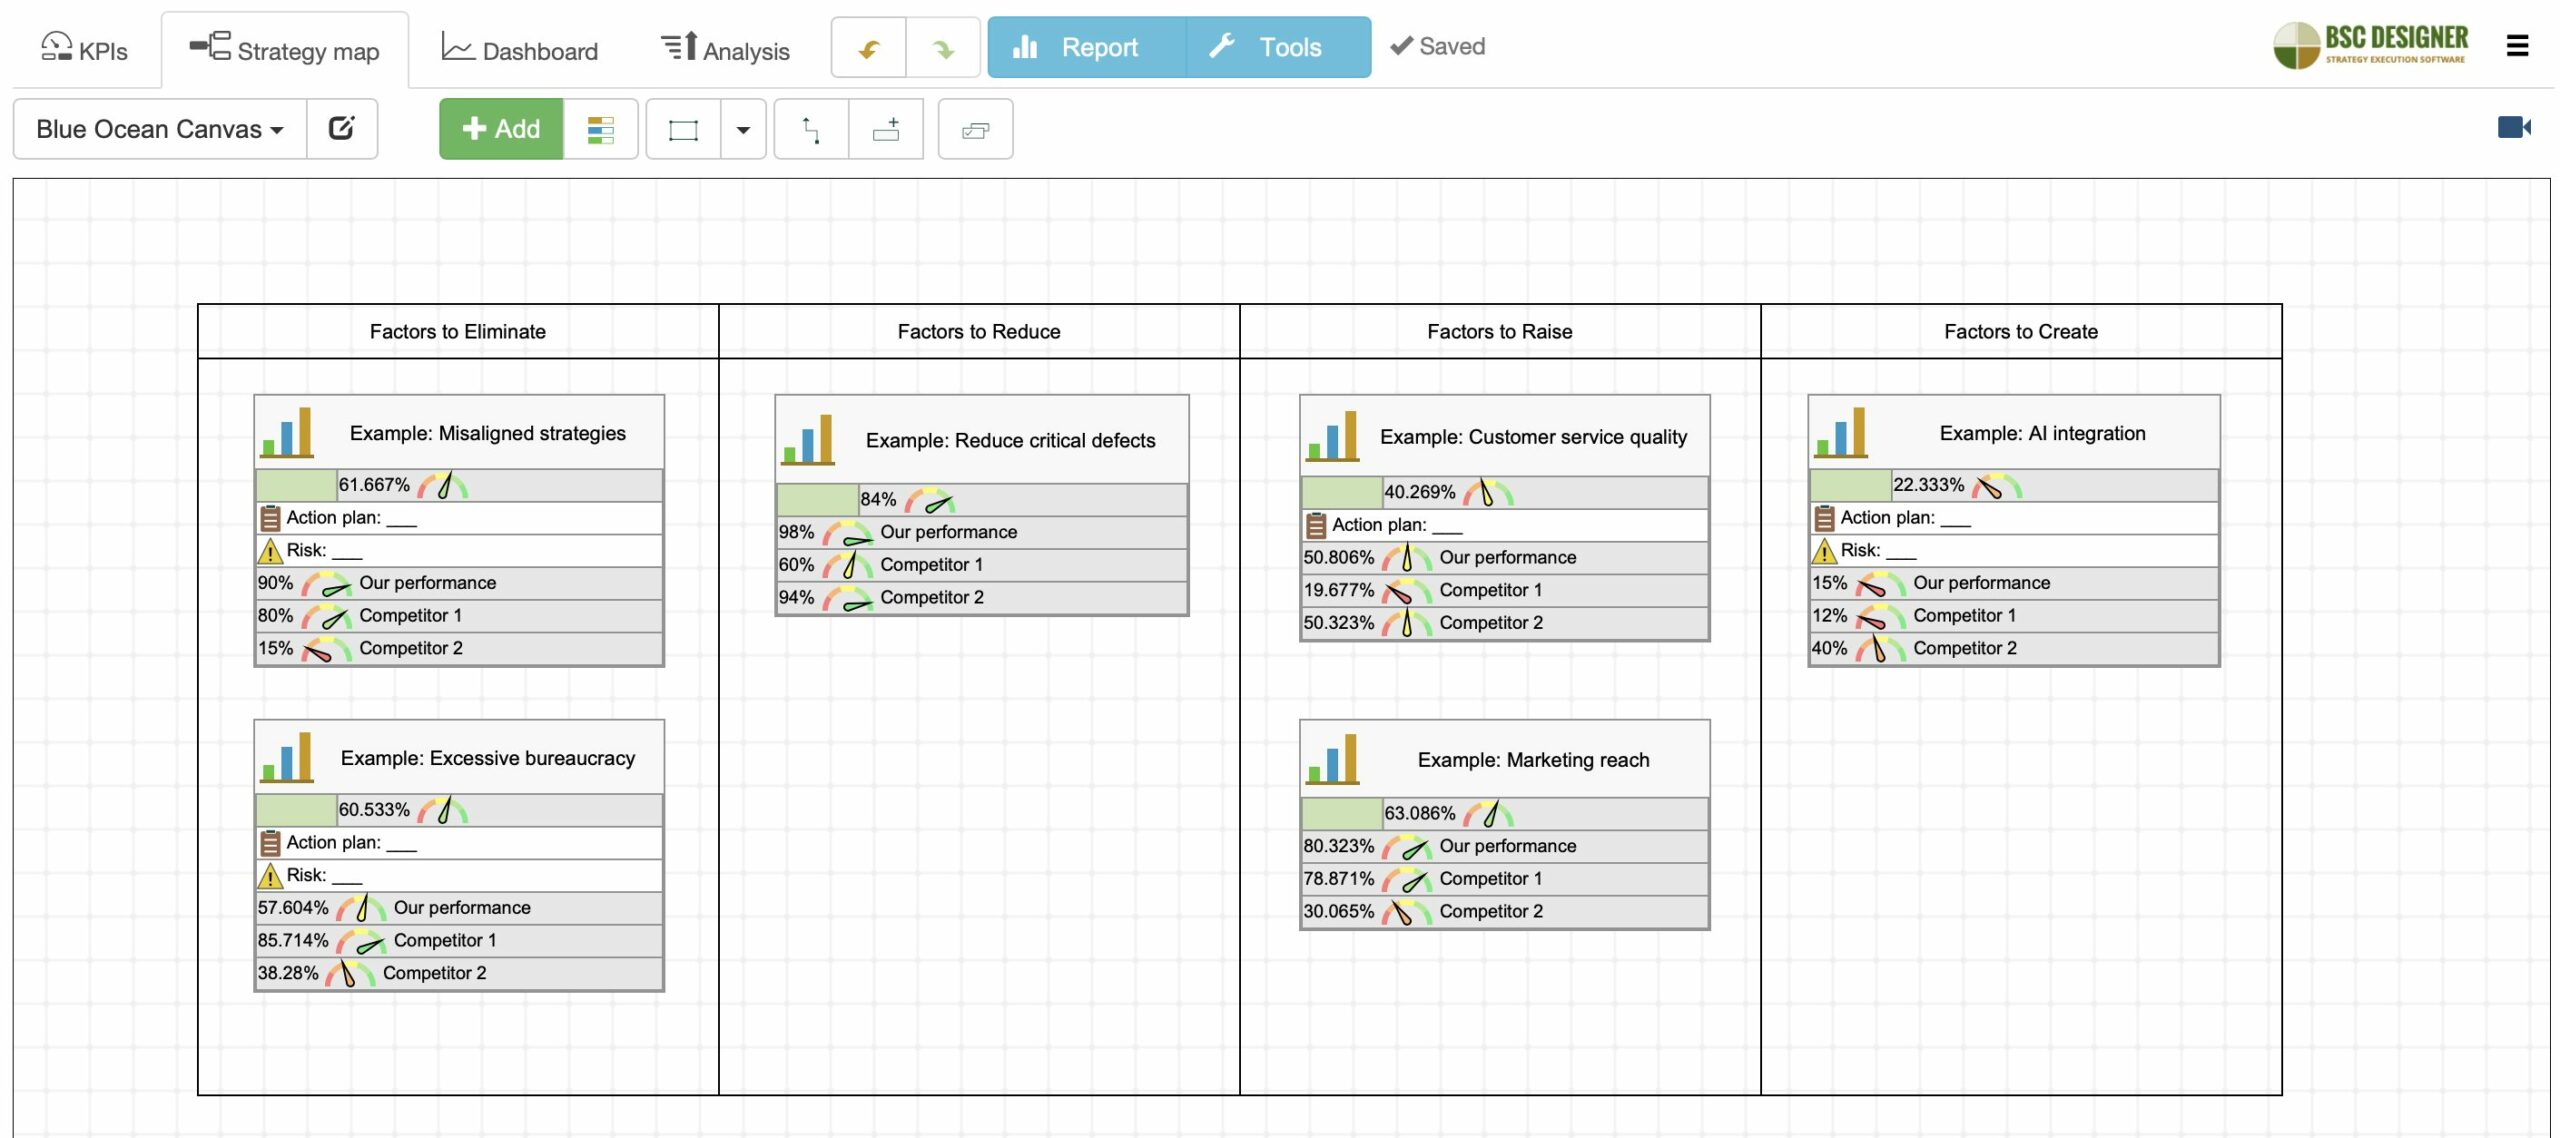
Factors on the Canvas
Present the factors using the Blue Ocean canvas on the Strategy Map tab. The canvas includes four segments where change goals are formulated.
For each change goal, the software visualizes:
- Our performance,
- Competitors’ performance,
- Action plans, and
- Risks.
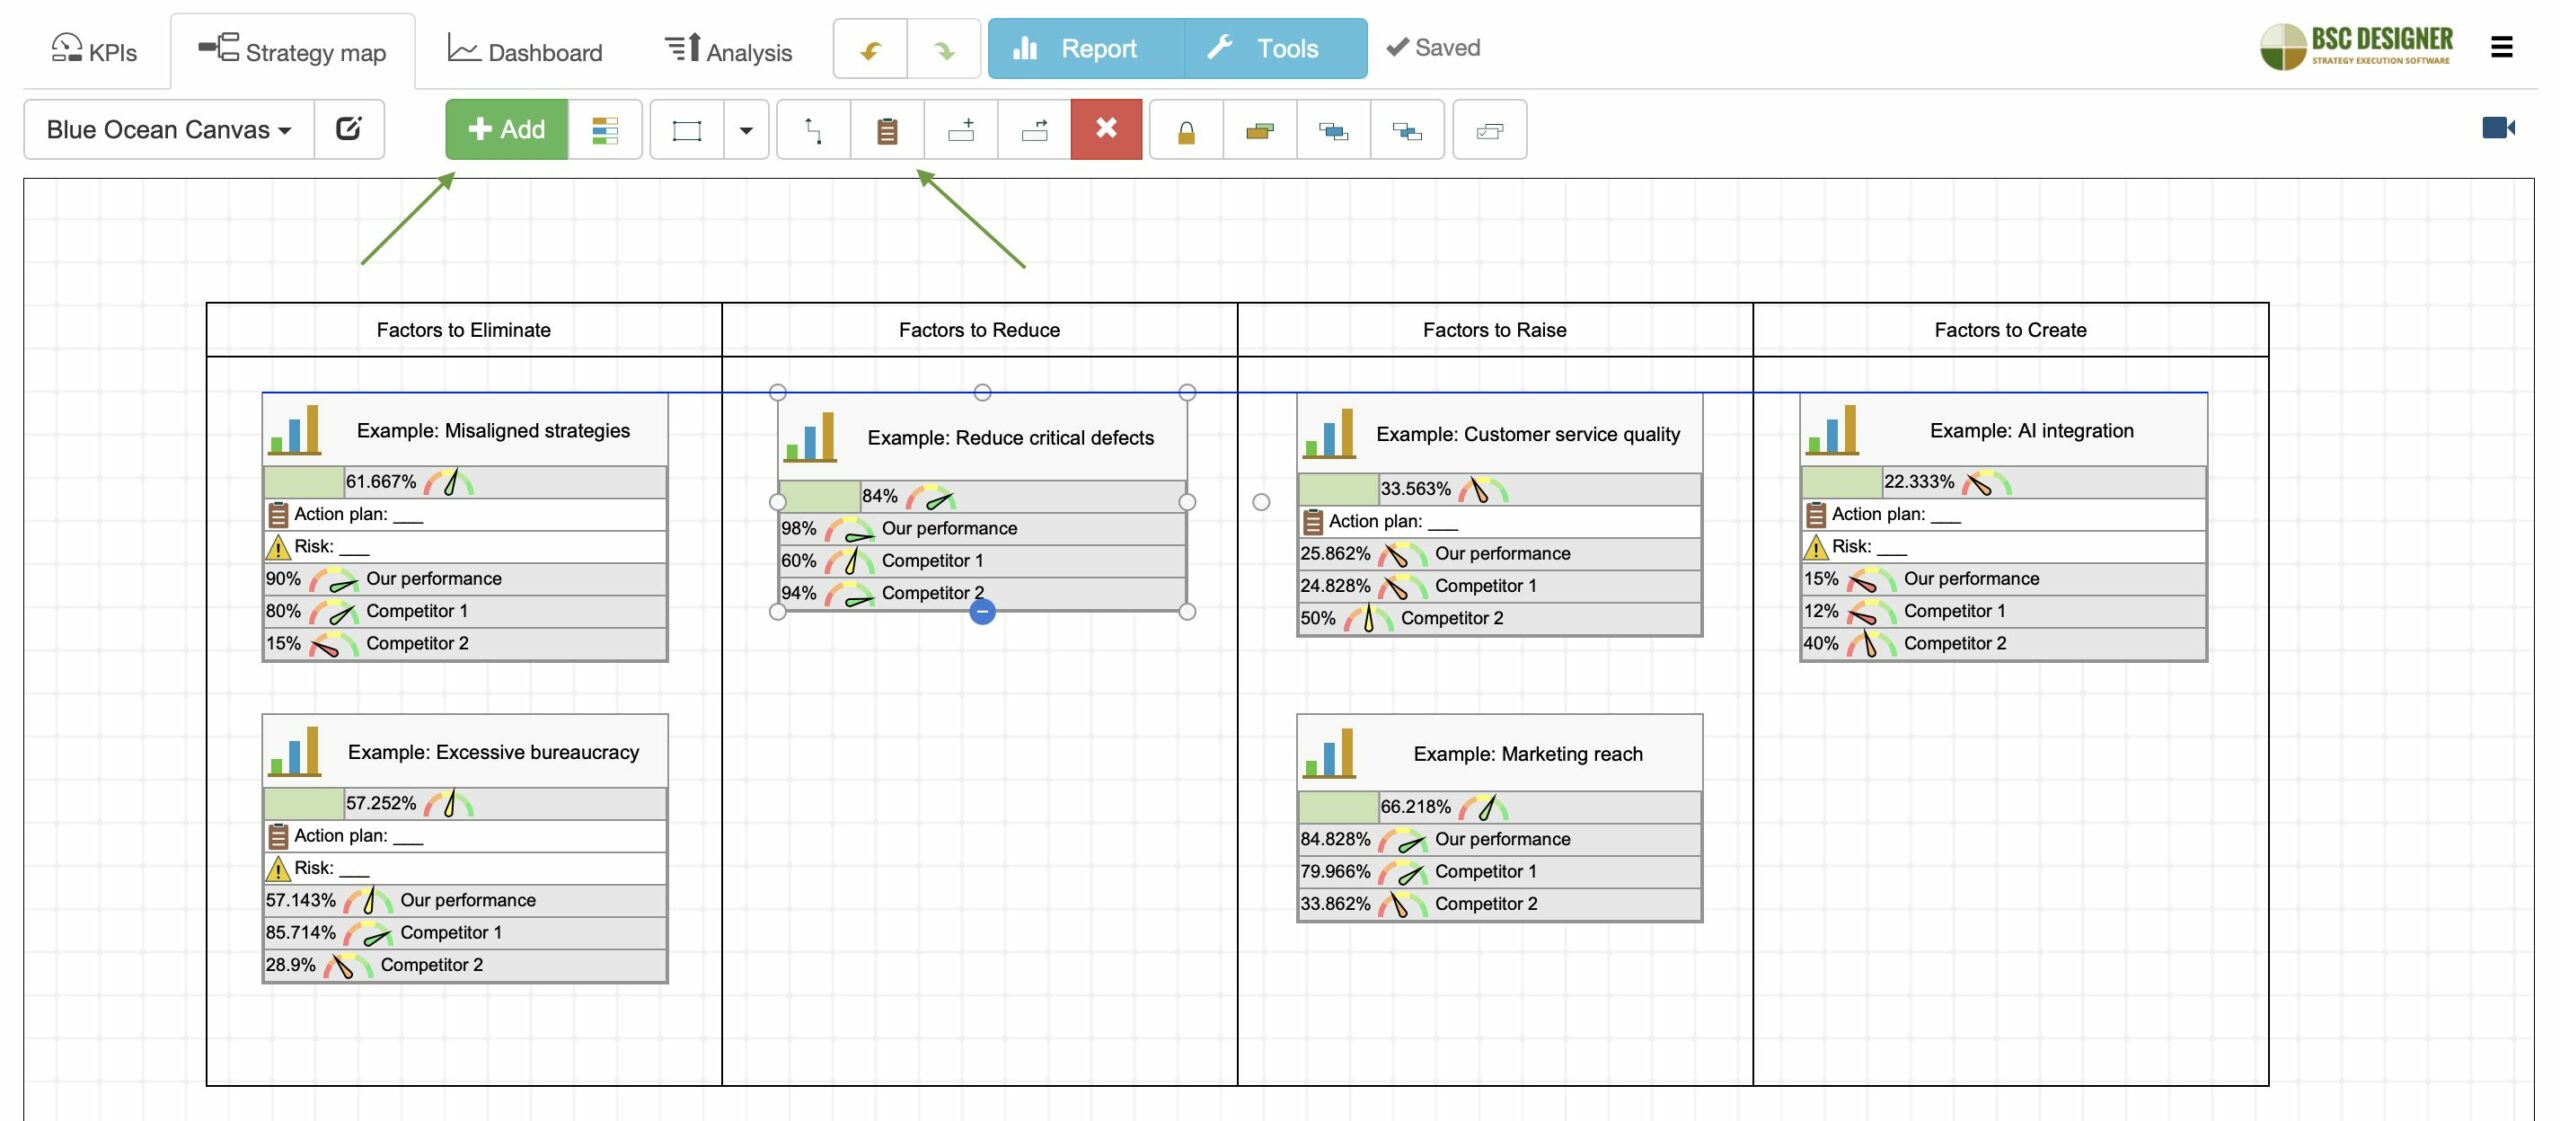
This canvas is interactive:
- We can add a new goal by selecting the segment and clicking on the Add button in the toolbar.
- We can add new initiatives or risks by selecting the goal and clicking the Initiatives button on the toolbar.
- The performance data for the goals updates automatically as long as we make updates on the KPIs tab.
Factors on the Dashboard
Another perspective for assessing the factors of the Blue Ocean strategy involves examining them over time. We aim to observe the progress of change goals within the context of specific factors.
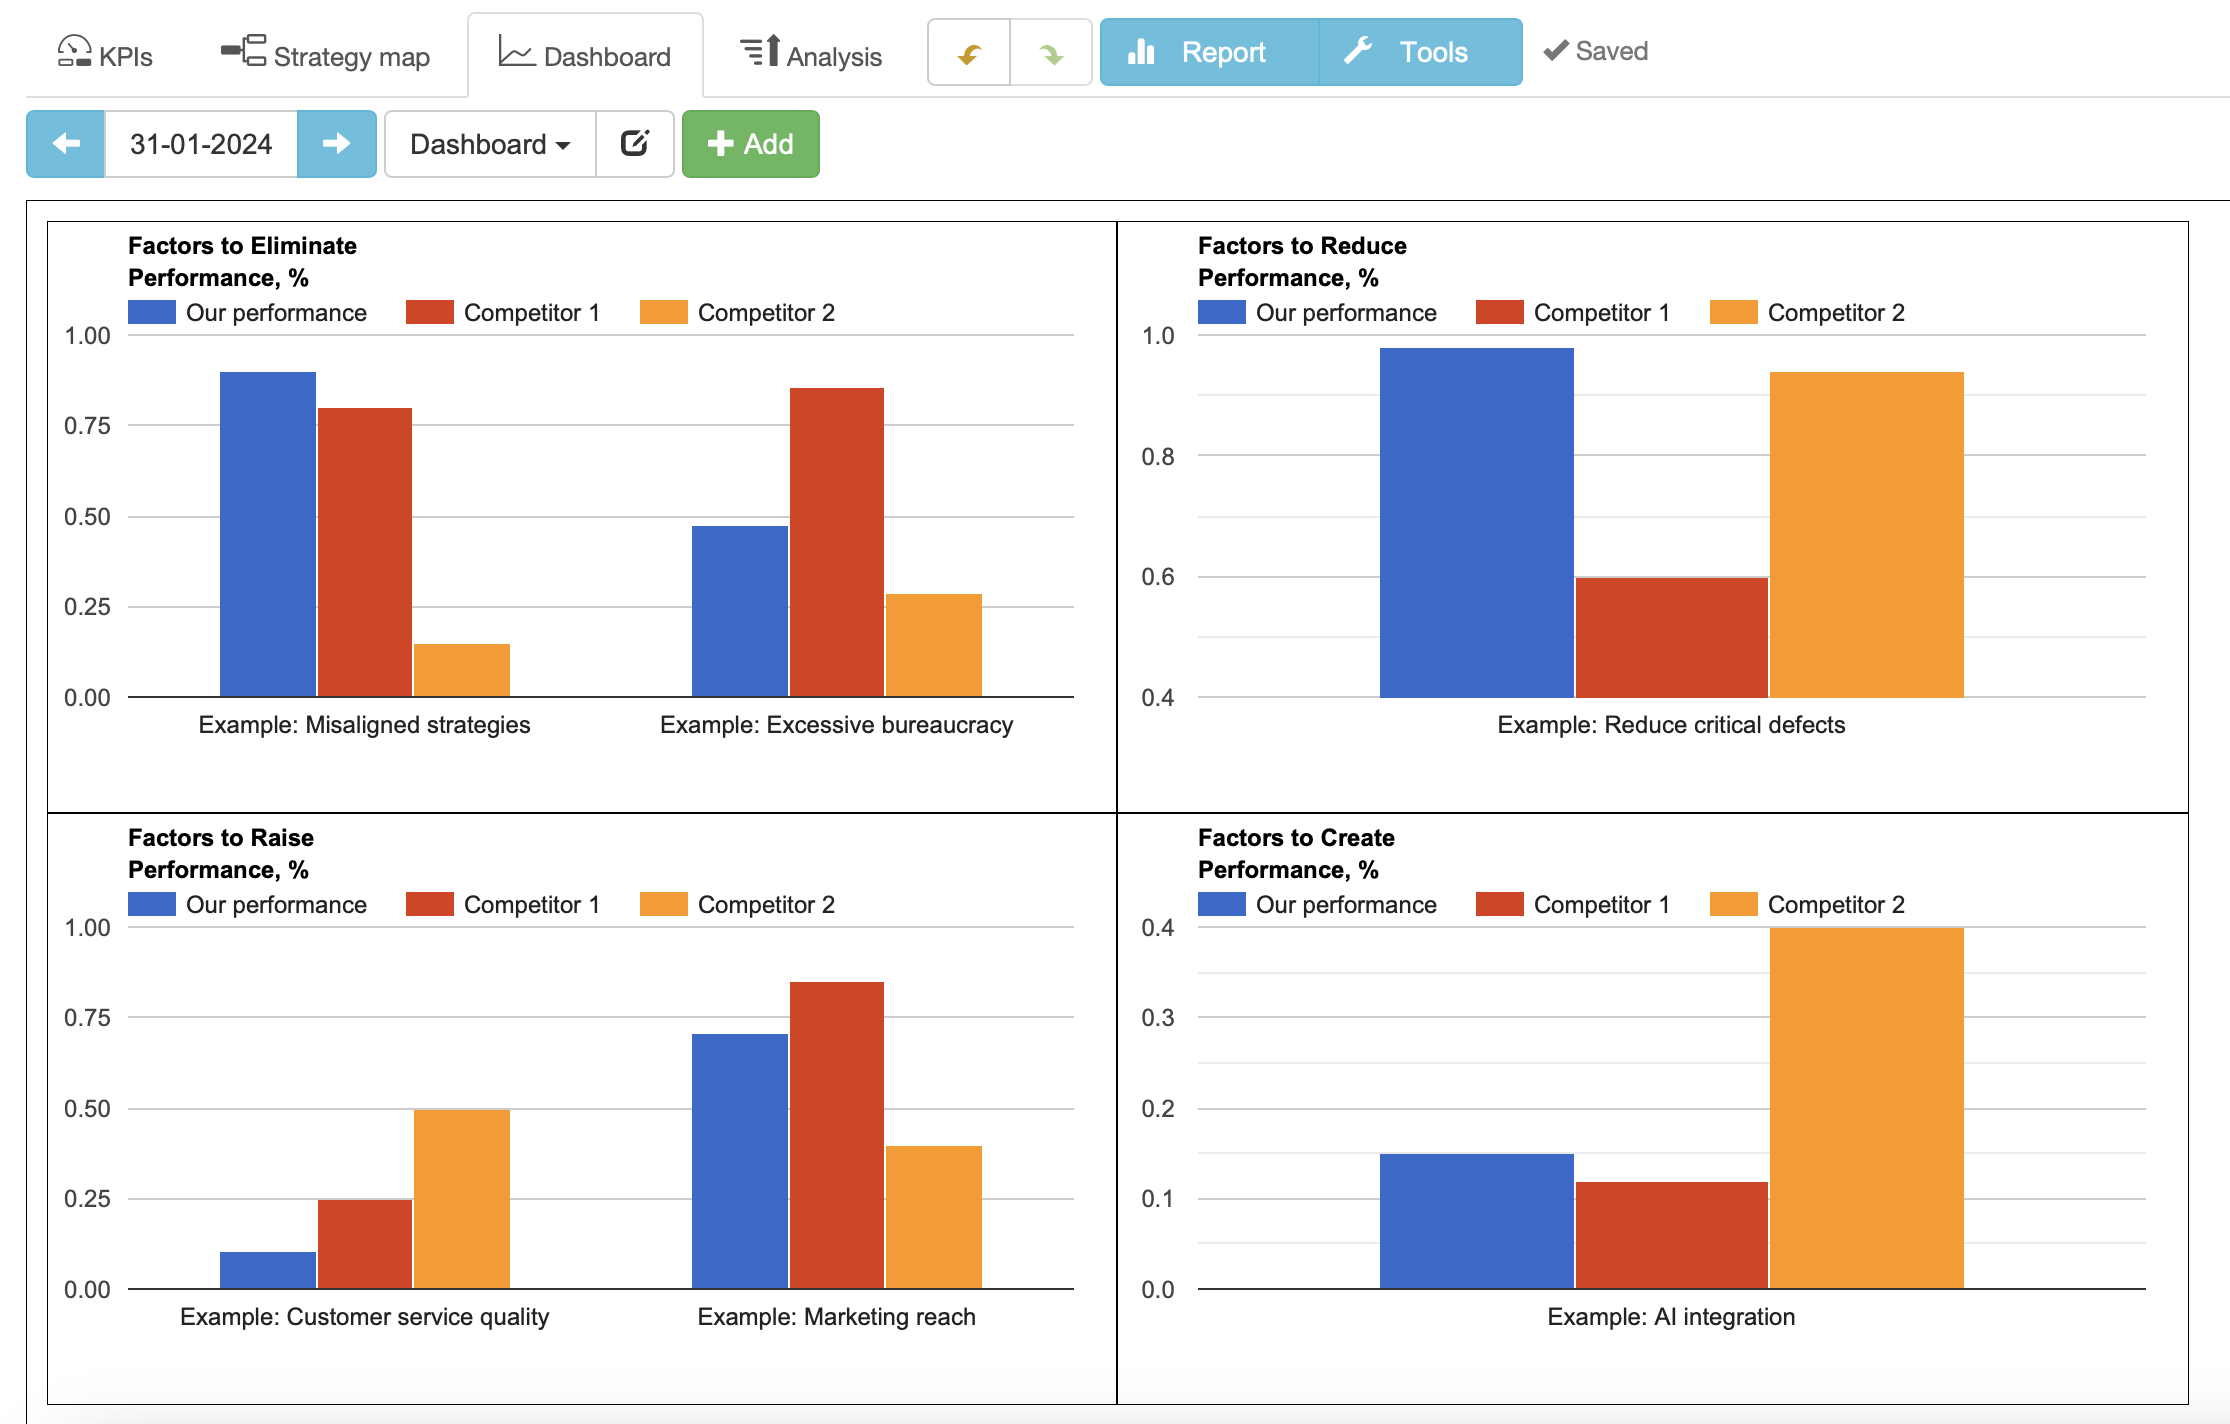
We added a Series diagram for each factor to the dashboard, showing how well the items within each factor perform.
This approach allows us to assess our performance compared to competitors at a particular point in time. By adjusting the dates, we can observe how it evolves over time.
Align Blue Ocean with Other Scorecards
The Blue Ocean scorecard concentrates on high-level goals. These goals should be broken down into more specific sub-goals and initiatives. This can be done on the Blue Ocean canvas, or if the initial complexity is high, it makes sense to create a dedicated strategy scorecard for this purpose.
It’s crucial to establish a connection between the dedicated scorecard and the original Blue Ocean analysis. To achieve this in the software, copy and paste the goal between the scorecards. When prompted by the software, choose the “Link by Context” option. Both items will have a “relates to” record created on the “Context” tab.
Using the same method, we can align the Blue Ocean scorecard with any other scorecard in our strategy workspace.
Conclusions
By breaking down the impact of factors, the Blue Ocean strategy helps see ways to improve in the current competitive landscape. This provides organizations with a starting point for formulating their growth strategies.
The success of applying the Blue Ocean canvas relies on its proper alignment with competitive analysis and a customer-centric strategy.
![]() CEO | Author | Speaker
CEO | Author | Speaker
BSC Designer is strategy execution software that enhances strategy formulation and execution through tangible KPIs. Our proprietary strategy implementation system reflects our practical experience in the strategy domain.