In questionnaires, a qualitative Likert scale is used to measure the level of agreement of respondents with a statement, using several answer options. In the context of strategic planning, we incorporate Likert scale ratings into assessment scorecards.
When using such rating scales, we are interested in:
- Calculating the total score according to the Likert scale.
- Tracking score changes over time.
- Aligning the Likert score with other qualitative and quantitative metrics.
In this article, we’ll discuss automating the Likert scale with BSC Designer.
Matching ‘Indicators’ with Statements of Questionnaire
In the 3-component paradigm (goals, indicators, initiatives) used in BSC Designer:
- The “indicators” will correspond to the questions or statements of the survey,
- The “value” of indicators will correspond to the answers,
- The “measurement units” of the indicator will correspond to the options of the Likert scale.
Define the Measurement Units for Likert Scale
Let’s begin by adding a new measurement unit.
- Create a new scorecard.
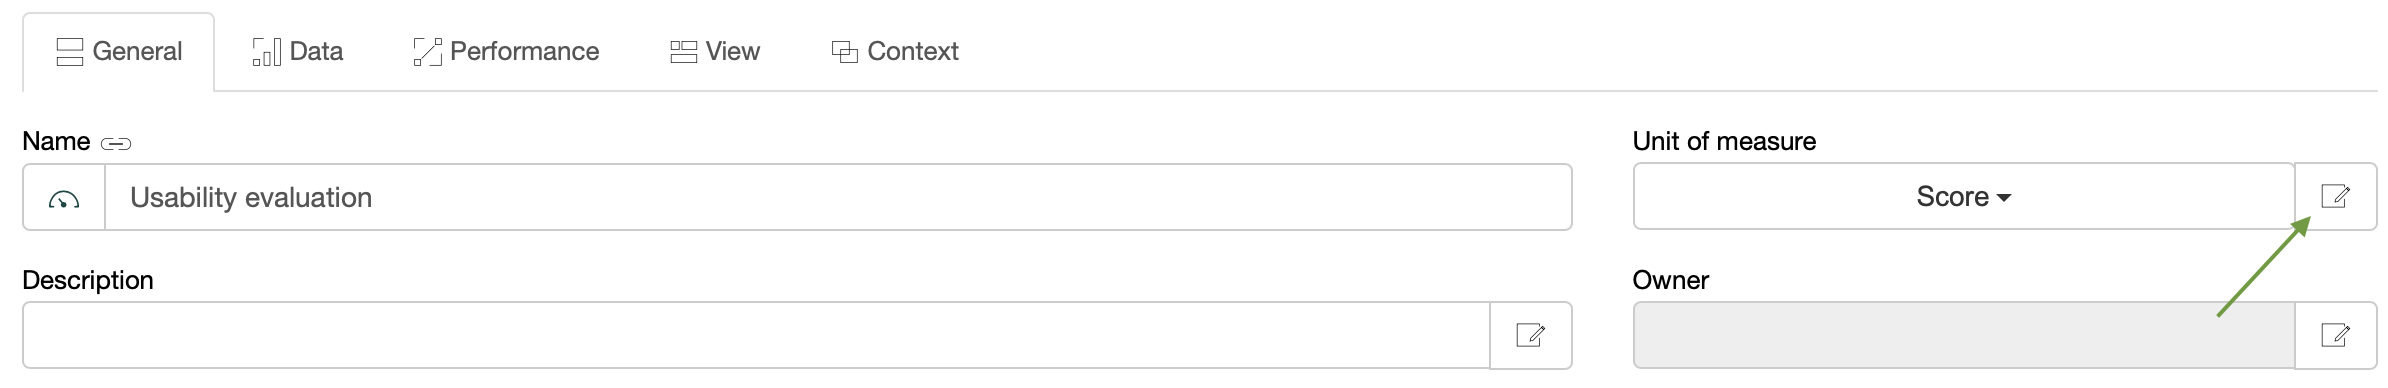
- Add a new item ‘Usability evaluation’
- Switch to the General tab below.
- Click on the Properties button next to the Unit of Measure property.
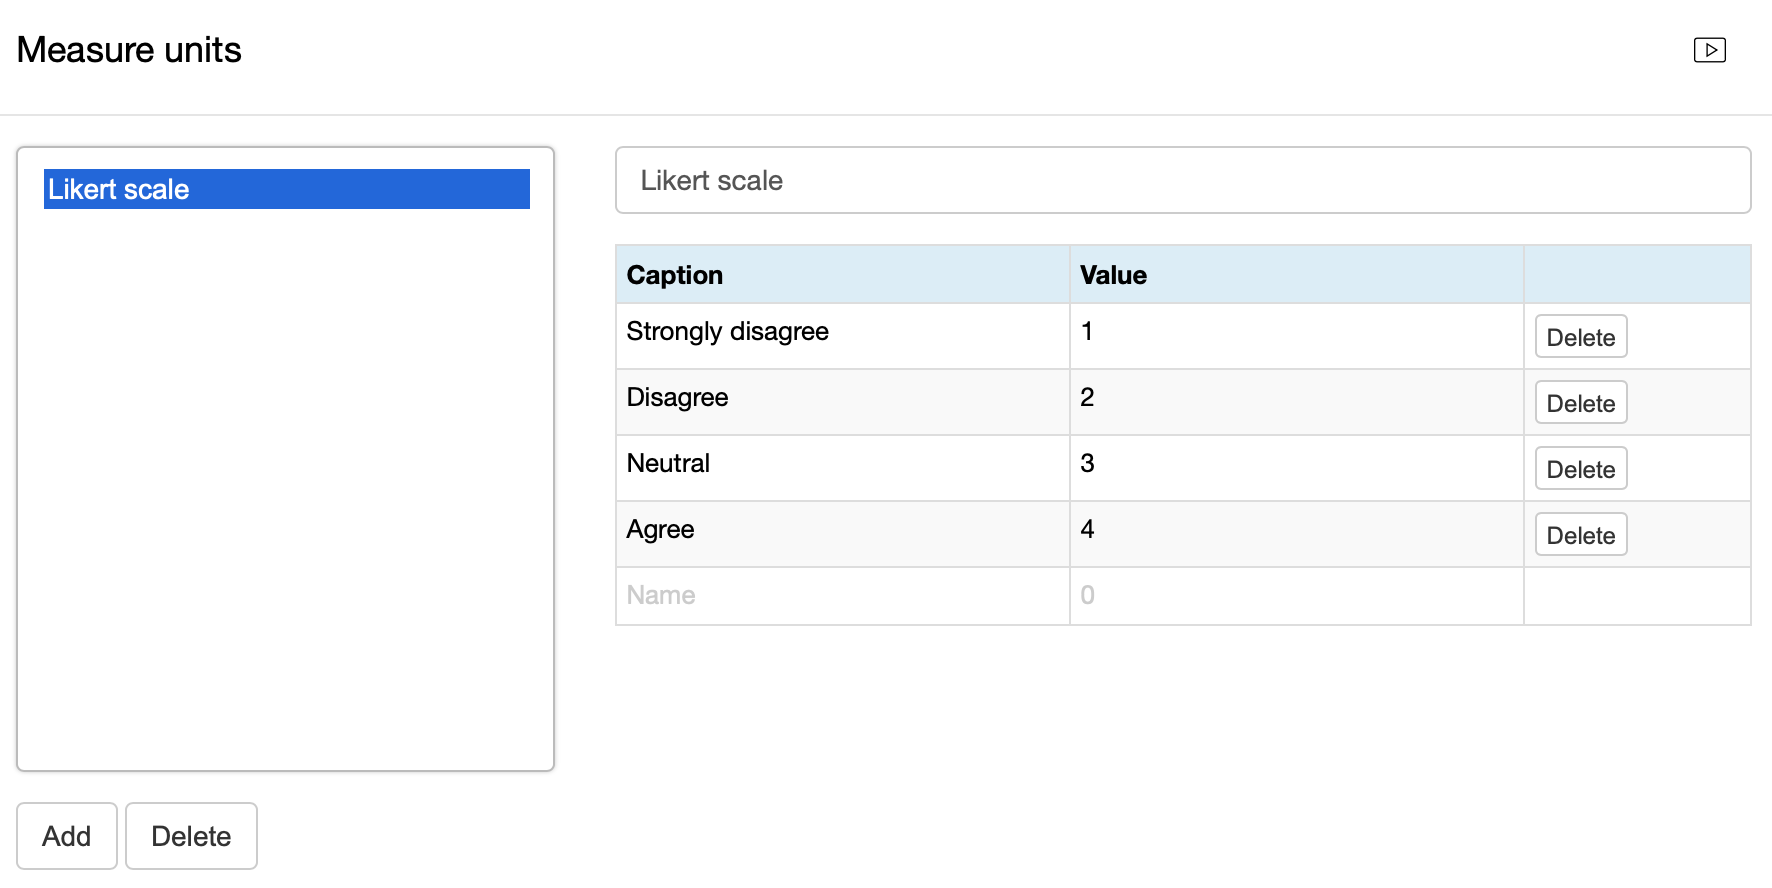
To add a new measurement unit:
- Click Add.
- Set a name for the measurement unit, for example, Likert scale.
- Fill in the Caption column with answer options, and the Value column with corresponding scores.
The classical Likert scale uses positive values for the scores:
- Strongly disagree: 1
- Disagree: 2
- Neutral: 3
- Agree: 4
- Strongly agree: 5
Another option is to make the scale symmetric:
- Strongly disagree: -5
- Disagree: -2
- Neutral: 0
- Agree: 2
- Strongly agree: 5
Create Questionnaire
In the previous step, we created measurement units that can now be used for any indicator on your scorecard. To create a questionnaire, we follow a logic explained in the evaluation scorecard article:
- Create groups
- Inside groups, create statements (or evaluation criteria)
- Assign measurement units to the statements
Now, let’s set up a new statement for the questionnaire:
- Select the Usability evaluation item.
- Click the Add button to add a new statement.
- Change its name, for example, to ‘The product has a user-friendly interface’.
- Change its unit of measurement to Likert scale.
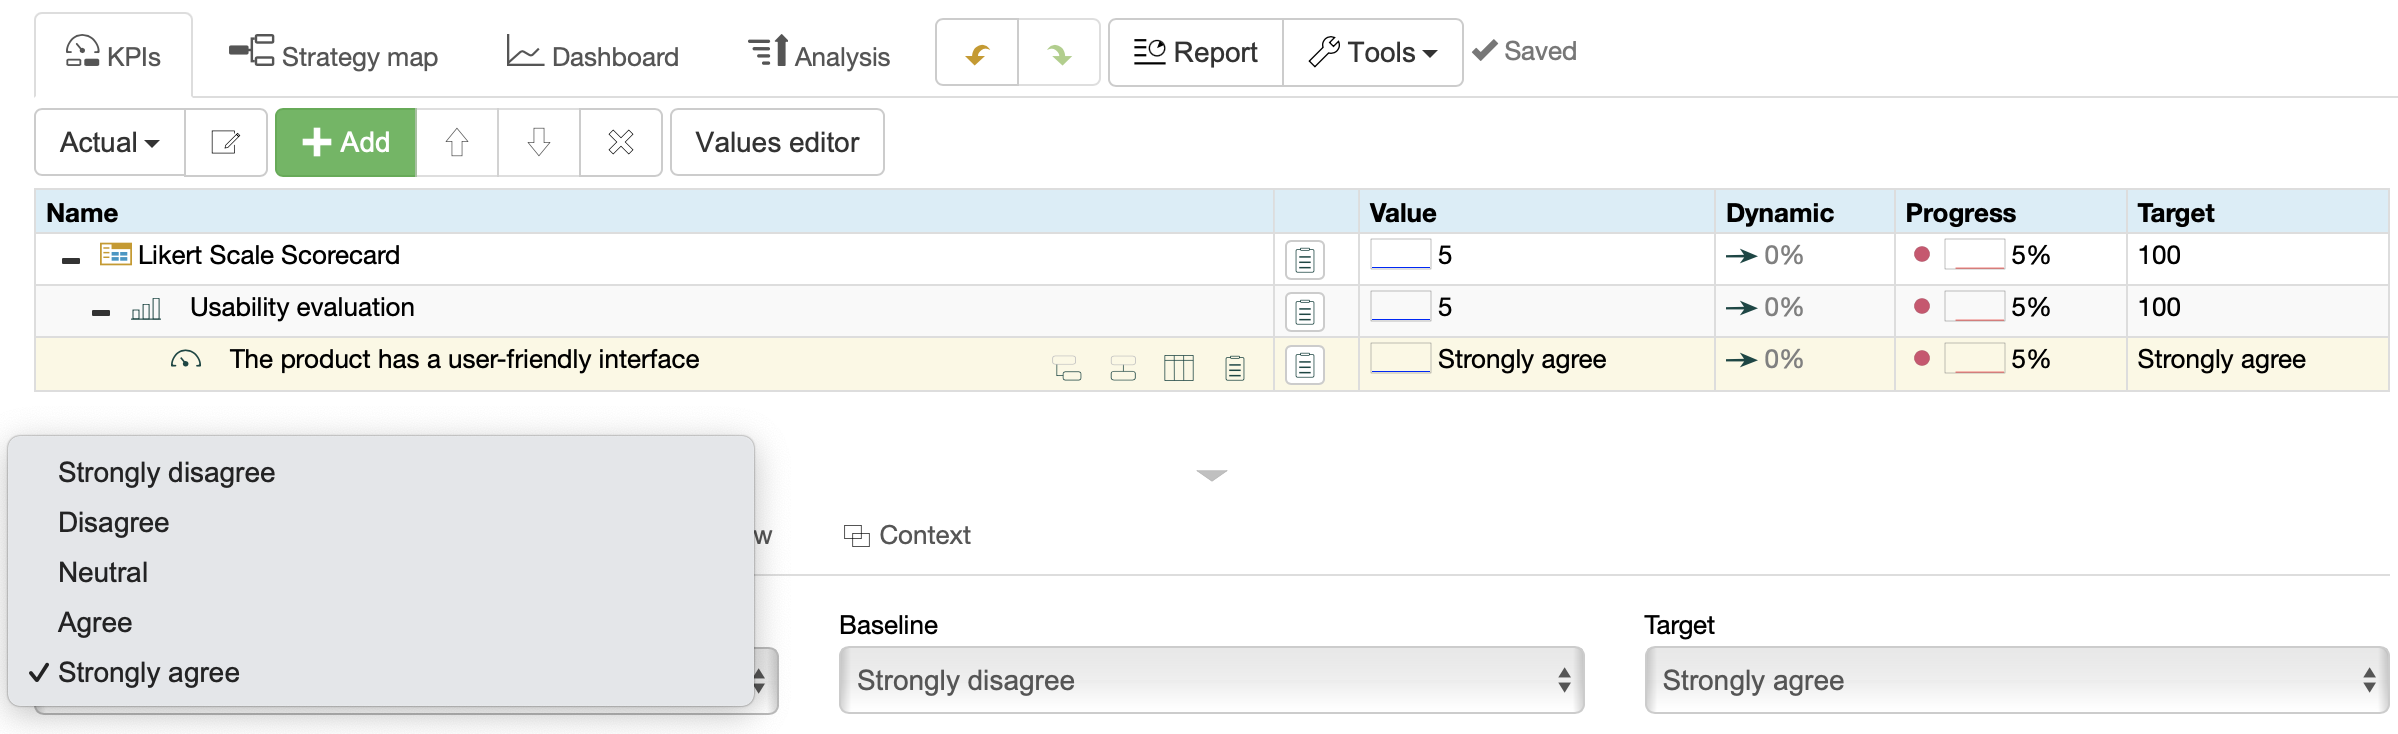
Switch to the Data tab.
I can see that the input control for the value was changed from numeric input to the natural-choice input that corresponds to the Likert scale defined in the previous step.
- I can change the current estimation to “Strongly agree”.
- Via the Values Editor, I can see what numerical value was assigned to the indicator.
Let’s follow the same steps and create a new statement, for example, ’The product interface is easy to customize’. In this case, let’s use the ‘Neutral’ option as an answer.
Let’s complete the setup of a group of statements:
- Select Usability evaluation created in the previous steps
- Change its ‘unit of measure’ to Likert scale.
- Switch to the Data tab and change the way the value is calculated to average or weighted average if you plan to additionally weight each statement later.
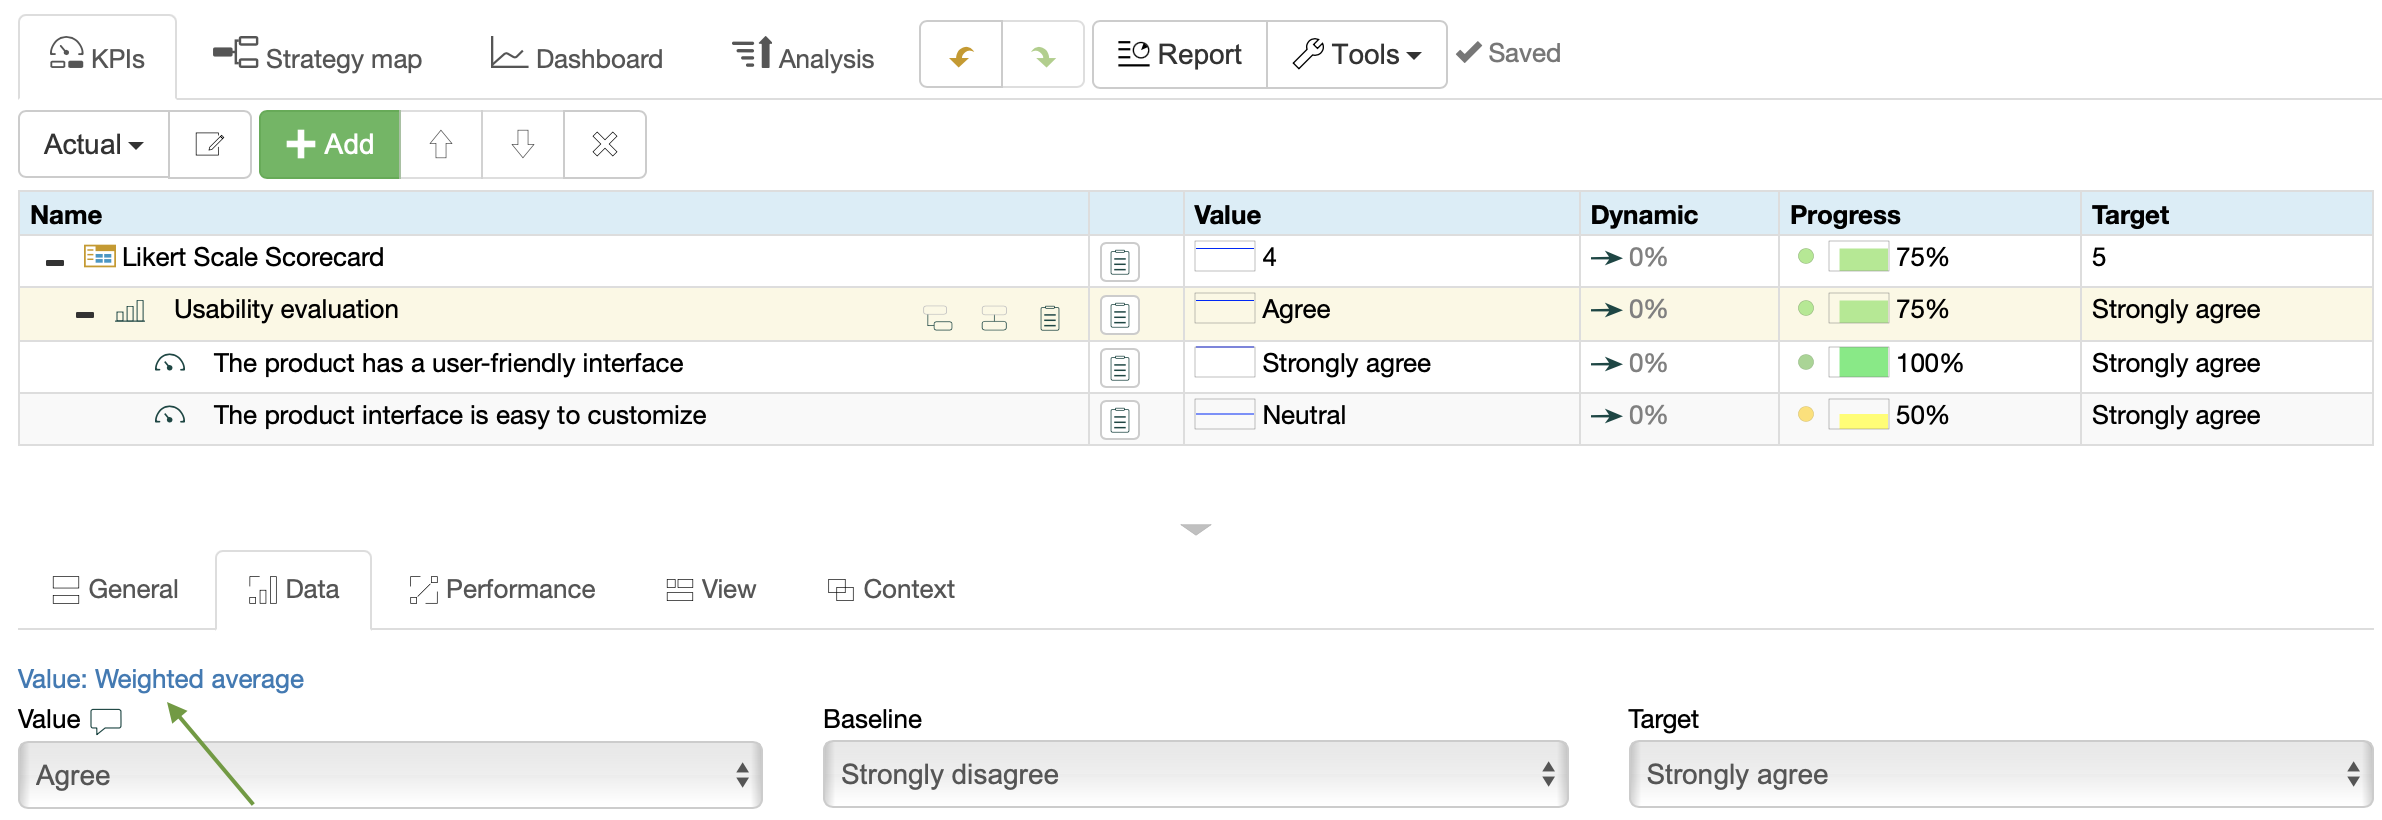
I can see that the average for the ‘Usability evaluation’ is now ‘Agree’ that on our scale corresponds to the score “2”.
Input Template in Excel
Let’s say you want to use these statements for a vendor risk evaluation.
- You can accomplish evaluation by yourself in the software, or
- Provide vendors with data input access to the scorecard, or
- Ask vendors to conduct self-evaluation.
For self-evaluation, you can export the current group as a data input template in Excel:
- Select the group ‘Usability evaluation’
- Navigate to Tools > Export data
- Select Export current item only and click Next
- Choose the Export as template option and click Next
- Follow the steps to finalize and generate an input template in Excel
Send it to vendors, and once you have the results, import it back into the scorecard via Tools > Import data.
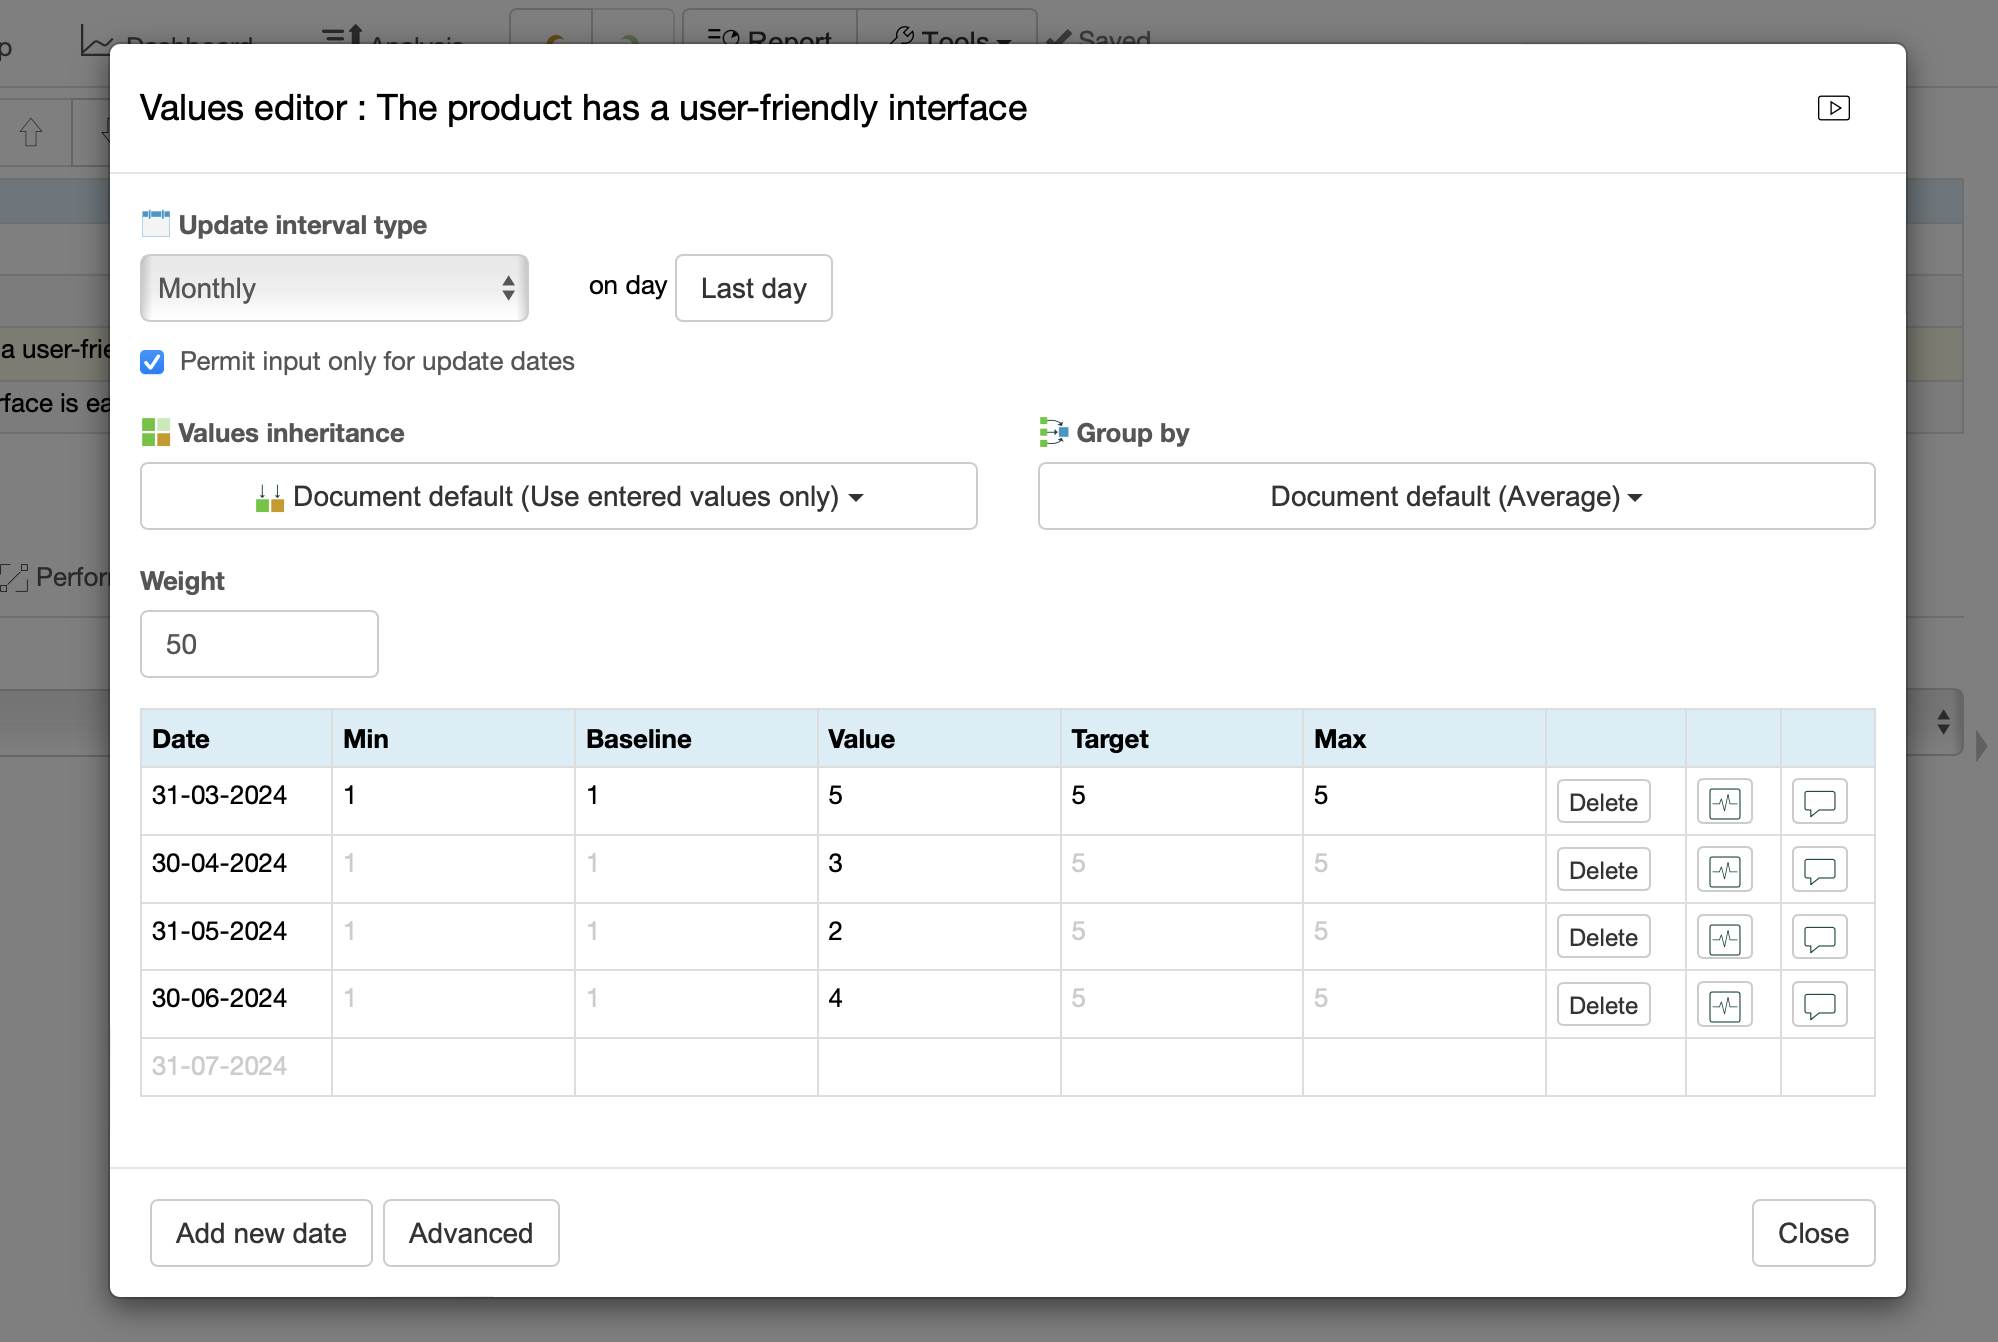
Tracking Score Over Time
The software can track the change in the score over time and keep your data organized.
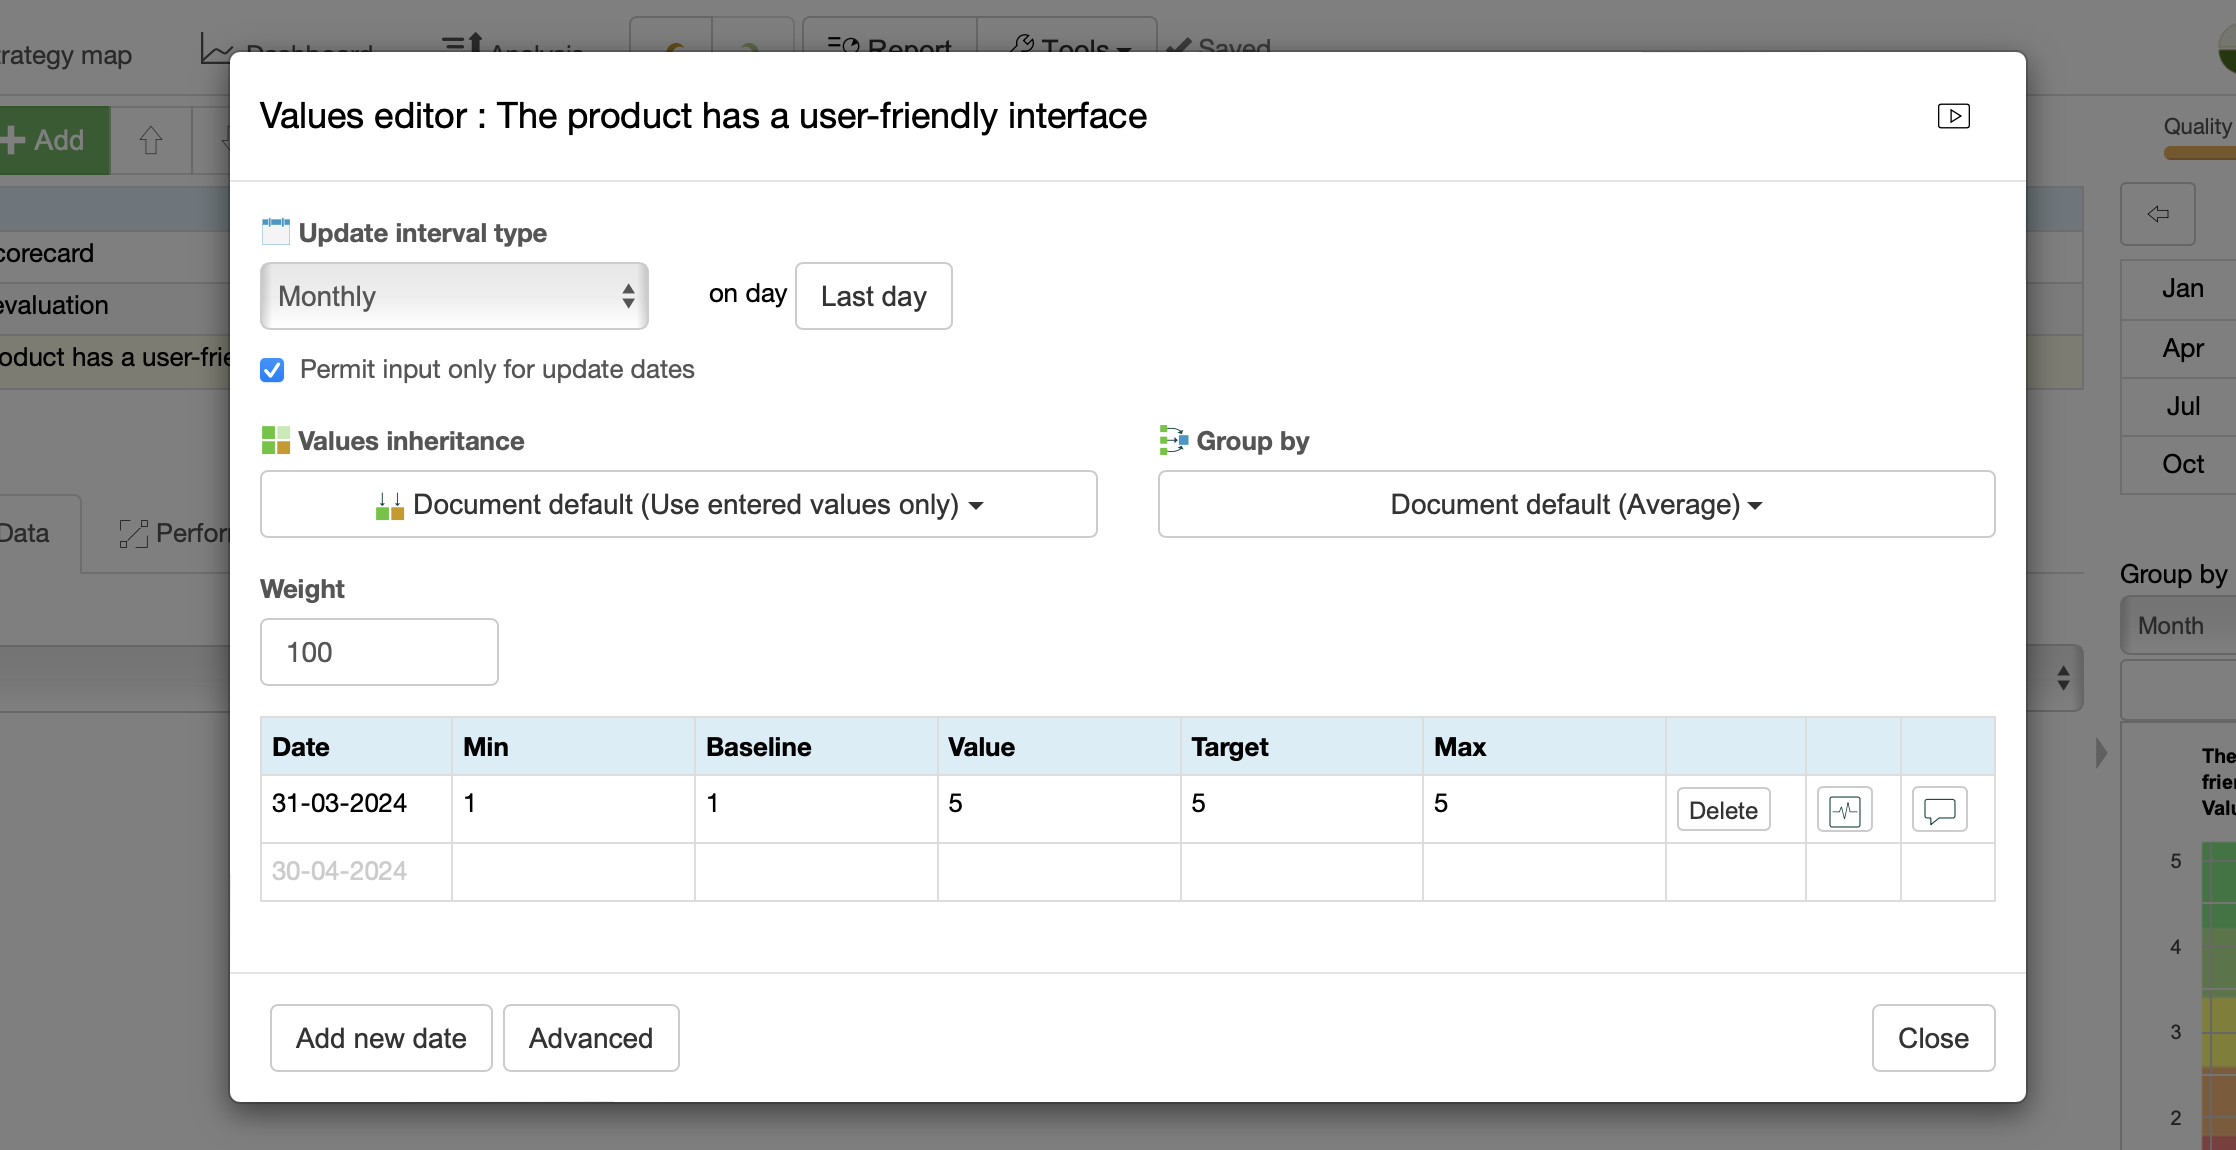
- Select a statement item.
- Click on the Values Editor button.
- Adjust the Update Interval.
The software will use it to keep your updates consistent.
If you prefer updating data with numerical scores, you can do it directly in the Values Editor. For a more user-friendly option:
- Close the Values Editor.
- Select a new date in the internal calendar.
- Enter the new data into the Value field.
I’ve added some random data for the next reporting periods. I can verify via the Values Editor that the data was successfully entered into the corresponding dates.
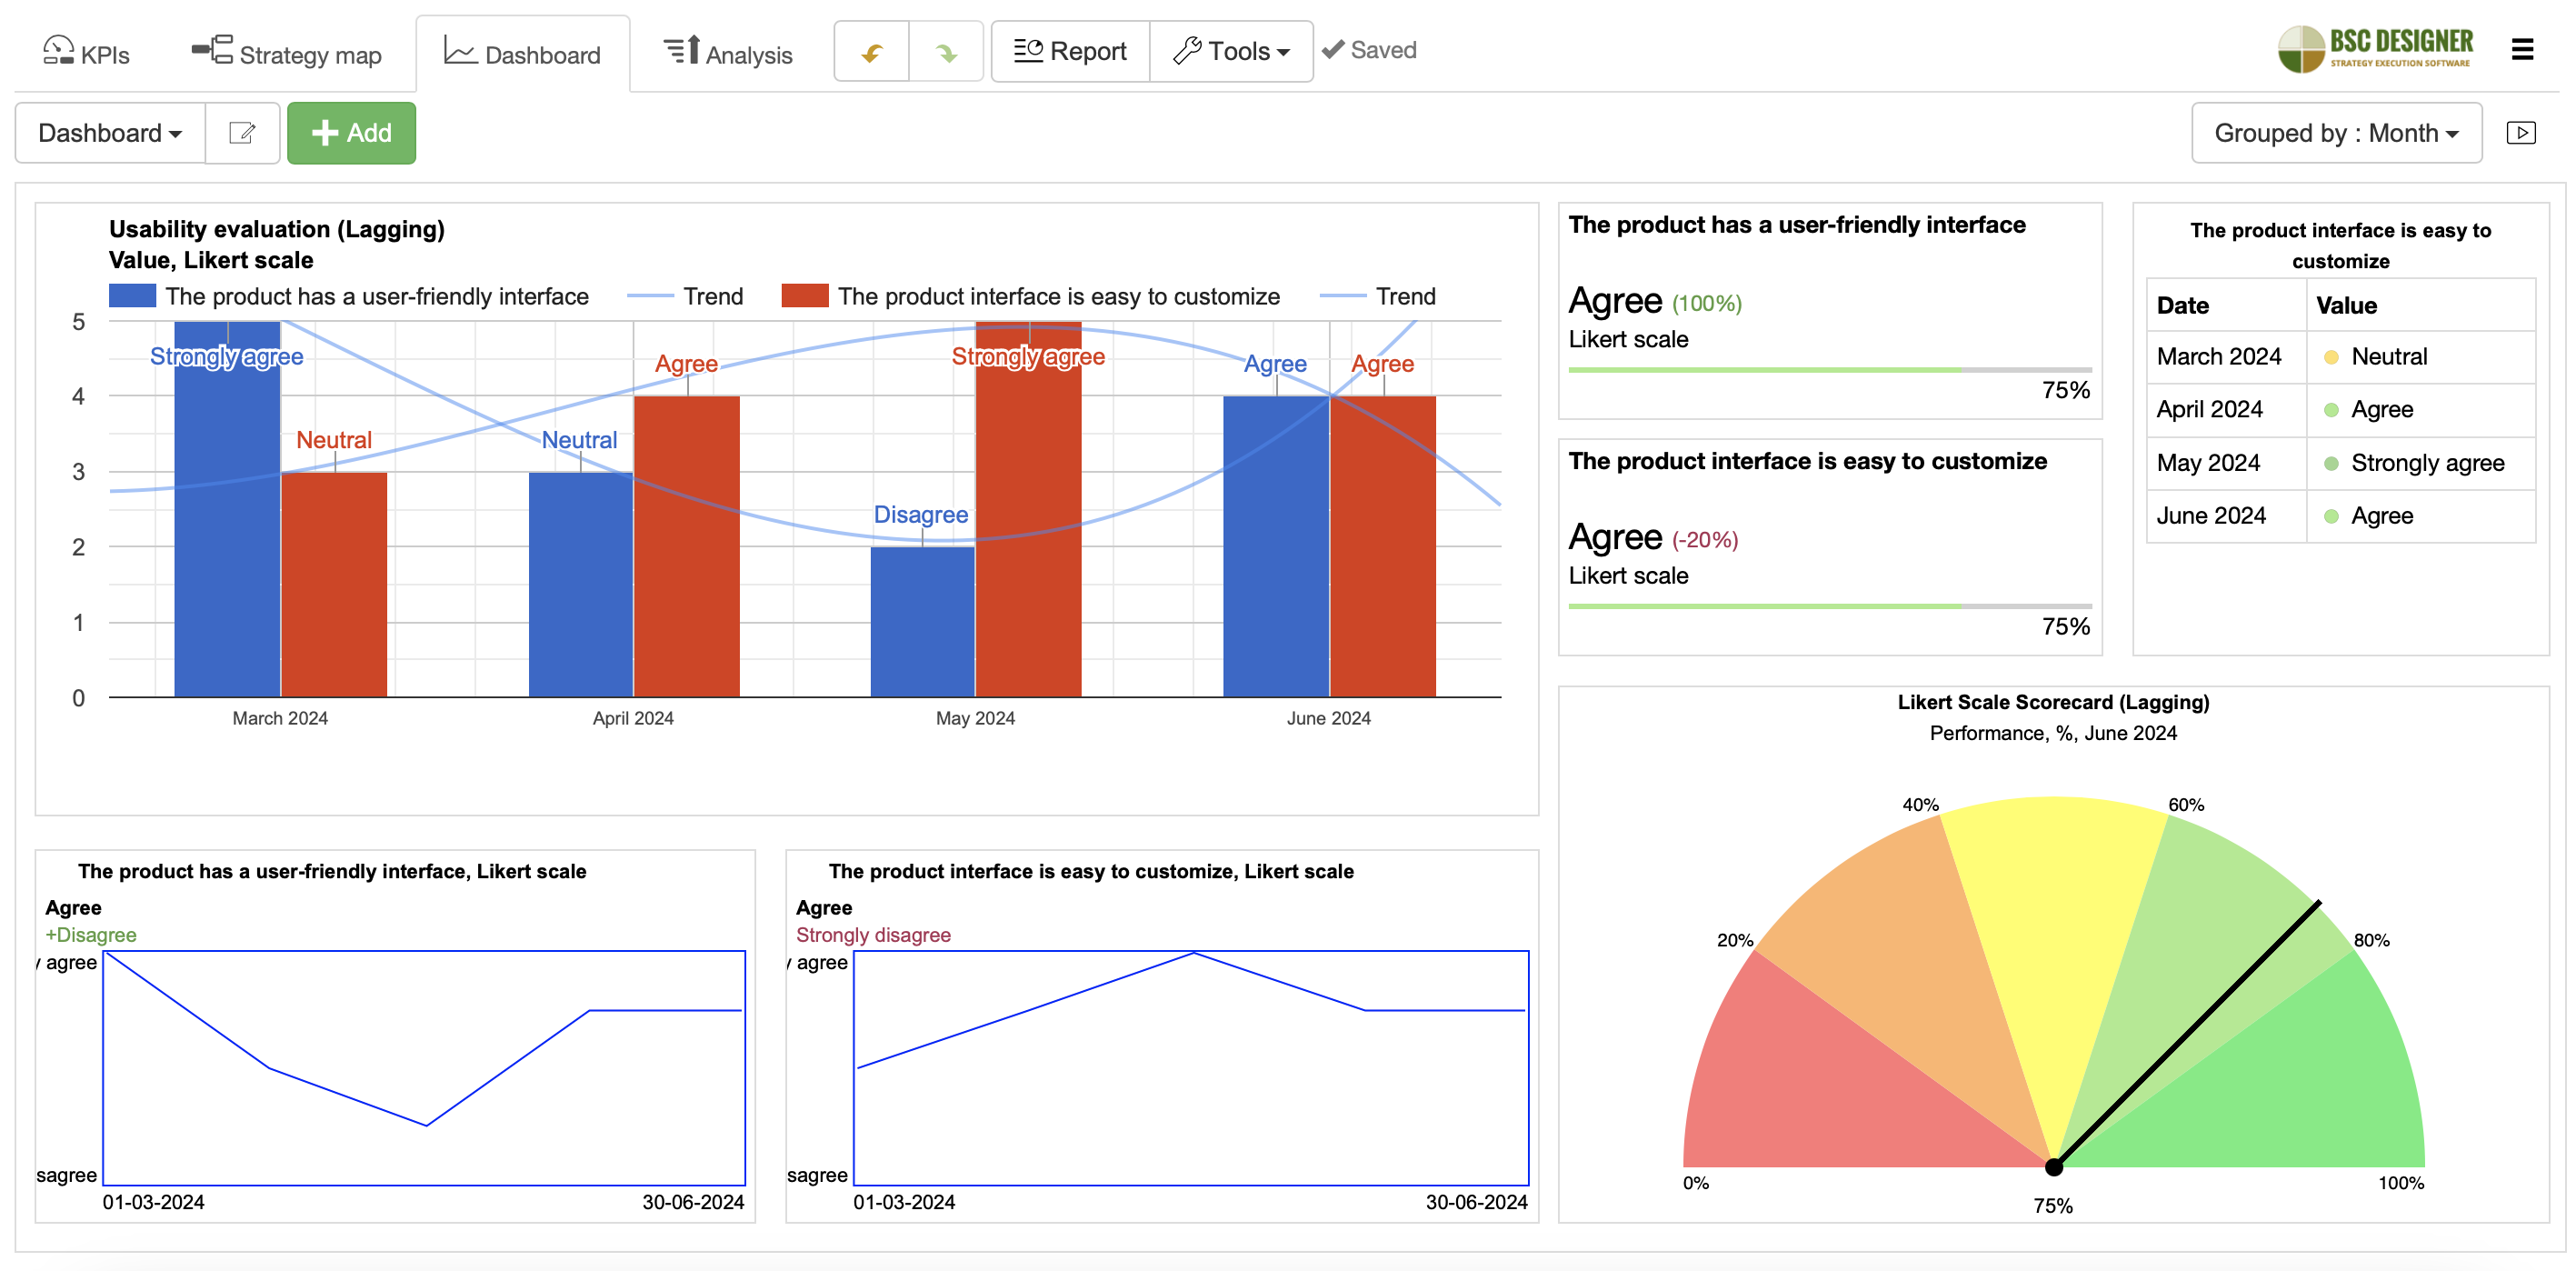
Visualizing Data on the Dashboard
When the value of a certain answer changes over time, you can visually track it on the Dashboard tab. Use the “Bar” chart for this purpose.
To create a bar chart:
- Switch to the Dashboard and click Add.
- Select a group of questions, e.g., ‘Usability evaluation’ in our case.
- Choose ‘Bar’ chart from the list of diagrams.
- Ensure that ‘Show subitems’ is activated.
Calculation of Progress
In the current approach, the software records individual scores and also calculates an overall score that is the average of individual scores.
The challenge is that the resulting score will be on the same Likert scale from 1 to 5, and we cannot use it together with other indicators on our strategy or functional scorecards measured on the 0 to 100 scale.
The solution is to normalize the indicator. To do this, the tool uses:
- Current value
- Baseline and Target
- Optimization function (maximize or minimize)
The normalized performance of the indicator is calculated in the Progress column.
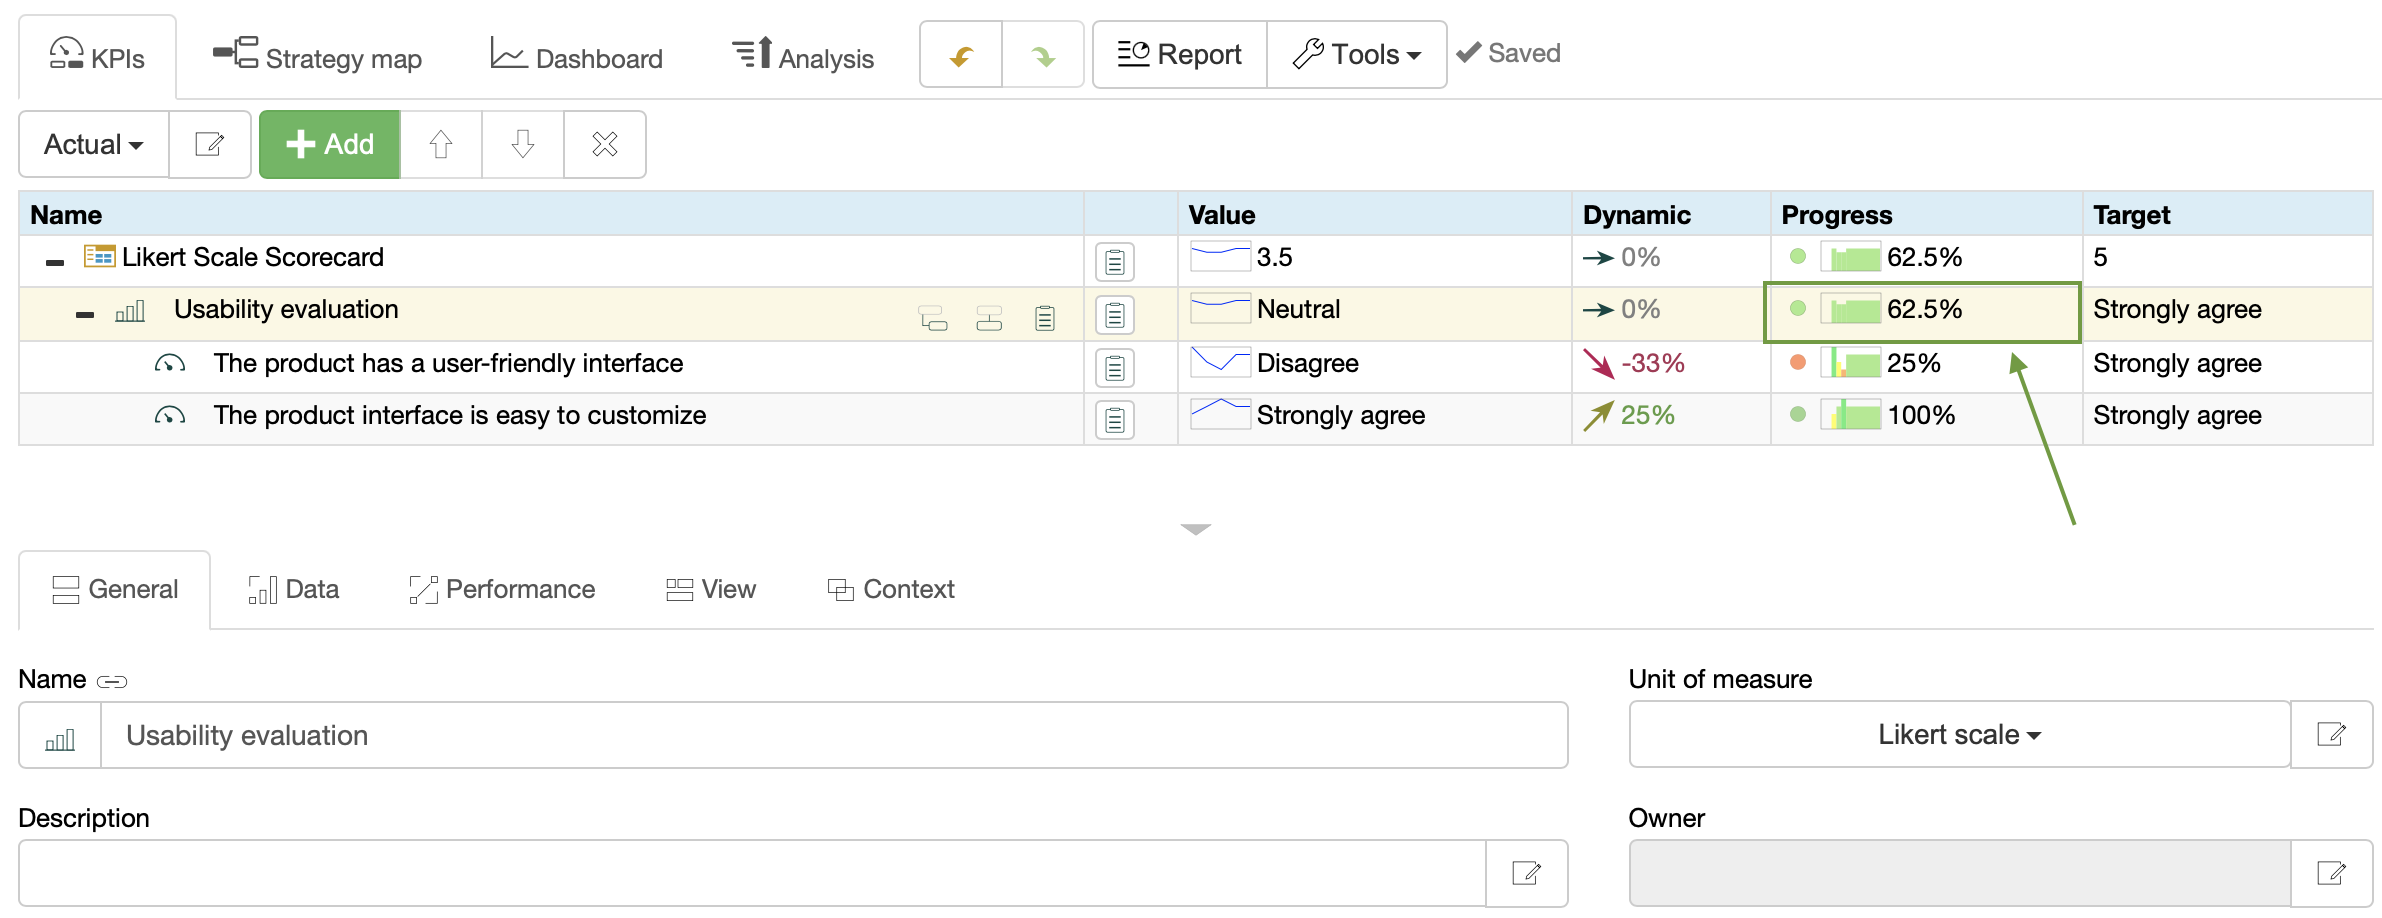
Once the indicator is normalized, we can use it on other scorecards.
Roadmap for Using Likert Scale
Here is a summary roadmap for the automation of Likert scale in BSC Designer:
- Create new measurement units.
- Create a questionnaire with statements quantified on the Likert scale.
- Introduce evaluations manually or utilize the Excel template.
- Track evaluations over time.
- Visualize and use the output on other scorecards.
![]() CEO | Author | Speaker
CEO | Author | Speaker
BSC Designer is strategy execution software that enhances strategy formulation and execution through tangible KPIs. Our proprietary strategy implementation system reflects our practical experience in the strategy domain.