Use gap analysis for the regular review of your strategy execution process: compare reality vs. expectations and plan corrective actions.
- Introduction: concept origin, visual picture
- Gap analysis template
- Gap analysis best practices
- Example of the gap analysis
Prerequisites: Have Your Strategy Map Ready
In this article, we’ll talk about the application of gap analysis to strategy execution. This will be relevant for organisations that:
- Have properly designed and cascaded strategy maps where
- The goals are quantified with KPIs.
The Origin of the “Gap Analysis” Concept
The concept of “gap analysis” is not contributed to any specific author or organization. Even a Wikipedia article gives just a general overview without mentioning specific sources or established techniques. Still, there are some shared ideas:
- Gap analysis is normally formulated as analysis of the difference (the gap) between the current state and desired state.
- The analysis typically consists in understanding the reasons for the gap and formulating a response plan.
What can be analyzed? Basically, anything where the company holds a stake.
Visual Picture of the Gap
If you want to visualise the gap, then look at the typical gauge chart:
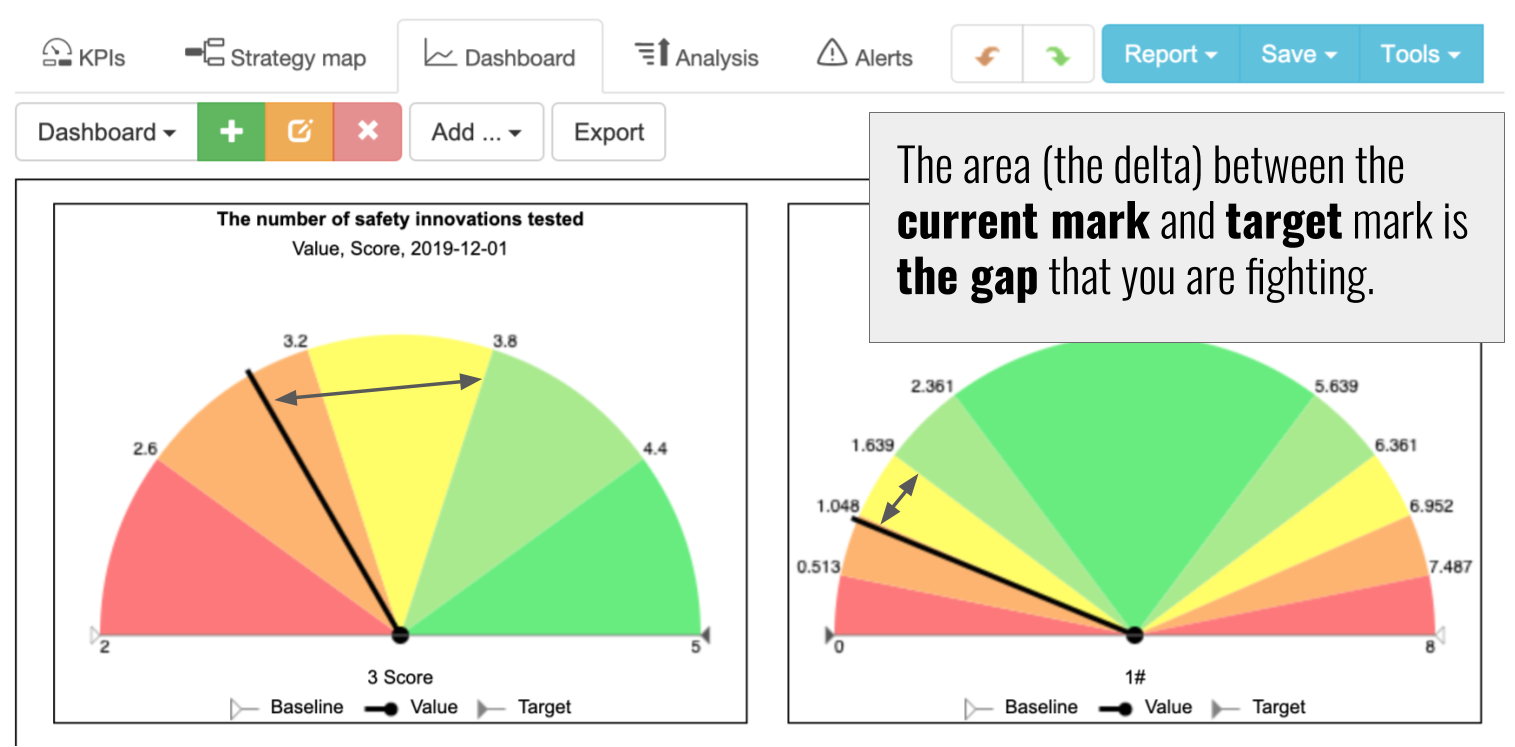
The area (the delta) between the current mark and target mark is the gap that you are fighting.
Gap Analysis Template
If we had to do a gap analysis for some process or technology then we would start with:
- Describing current situation,
- Finding analysis points, and
- Quantifying them
On the level of strategy, we can skip these steps:
- The analysis points are perfectly defined – they are our business goals.
- Most likely, they are quantified with leading and lagging metrics
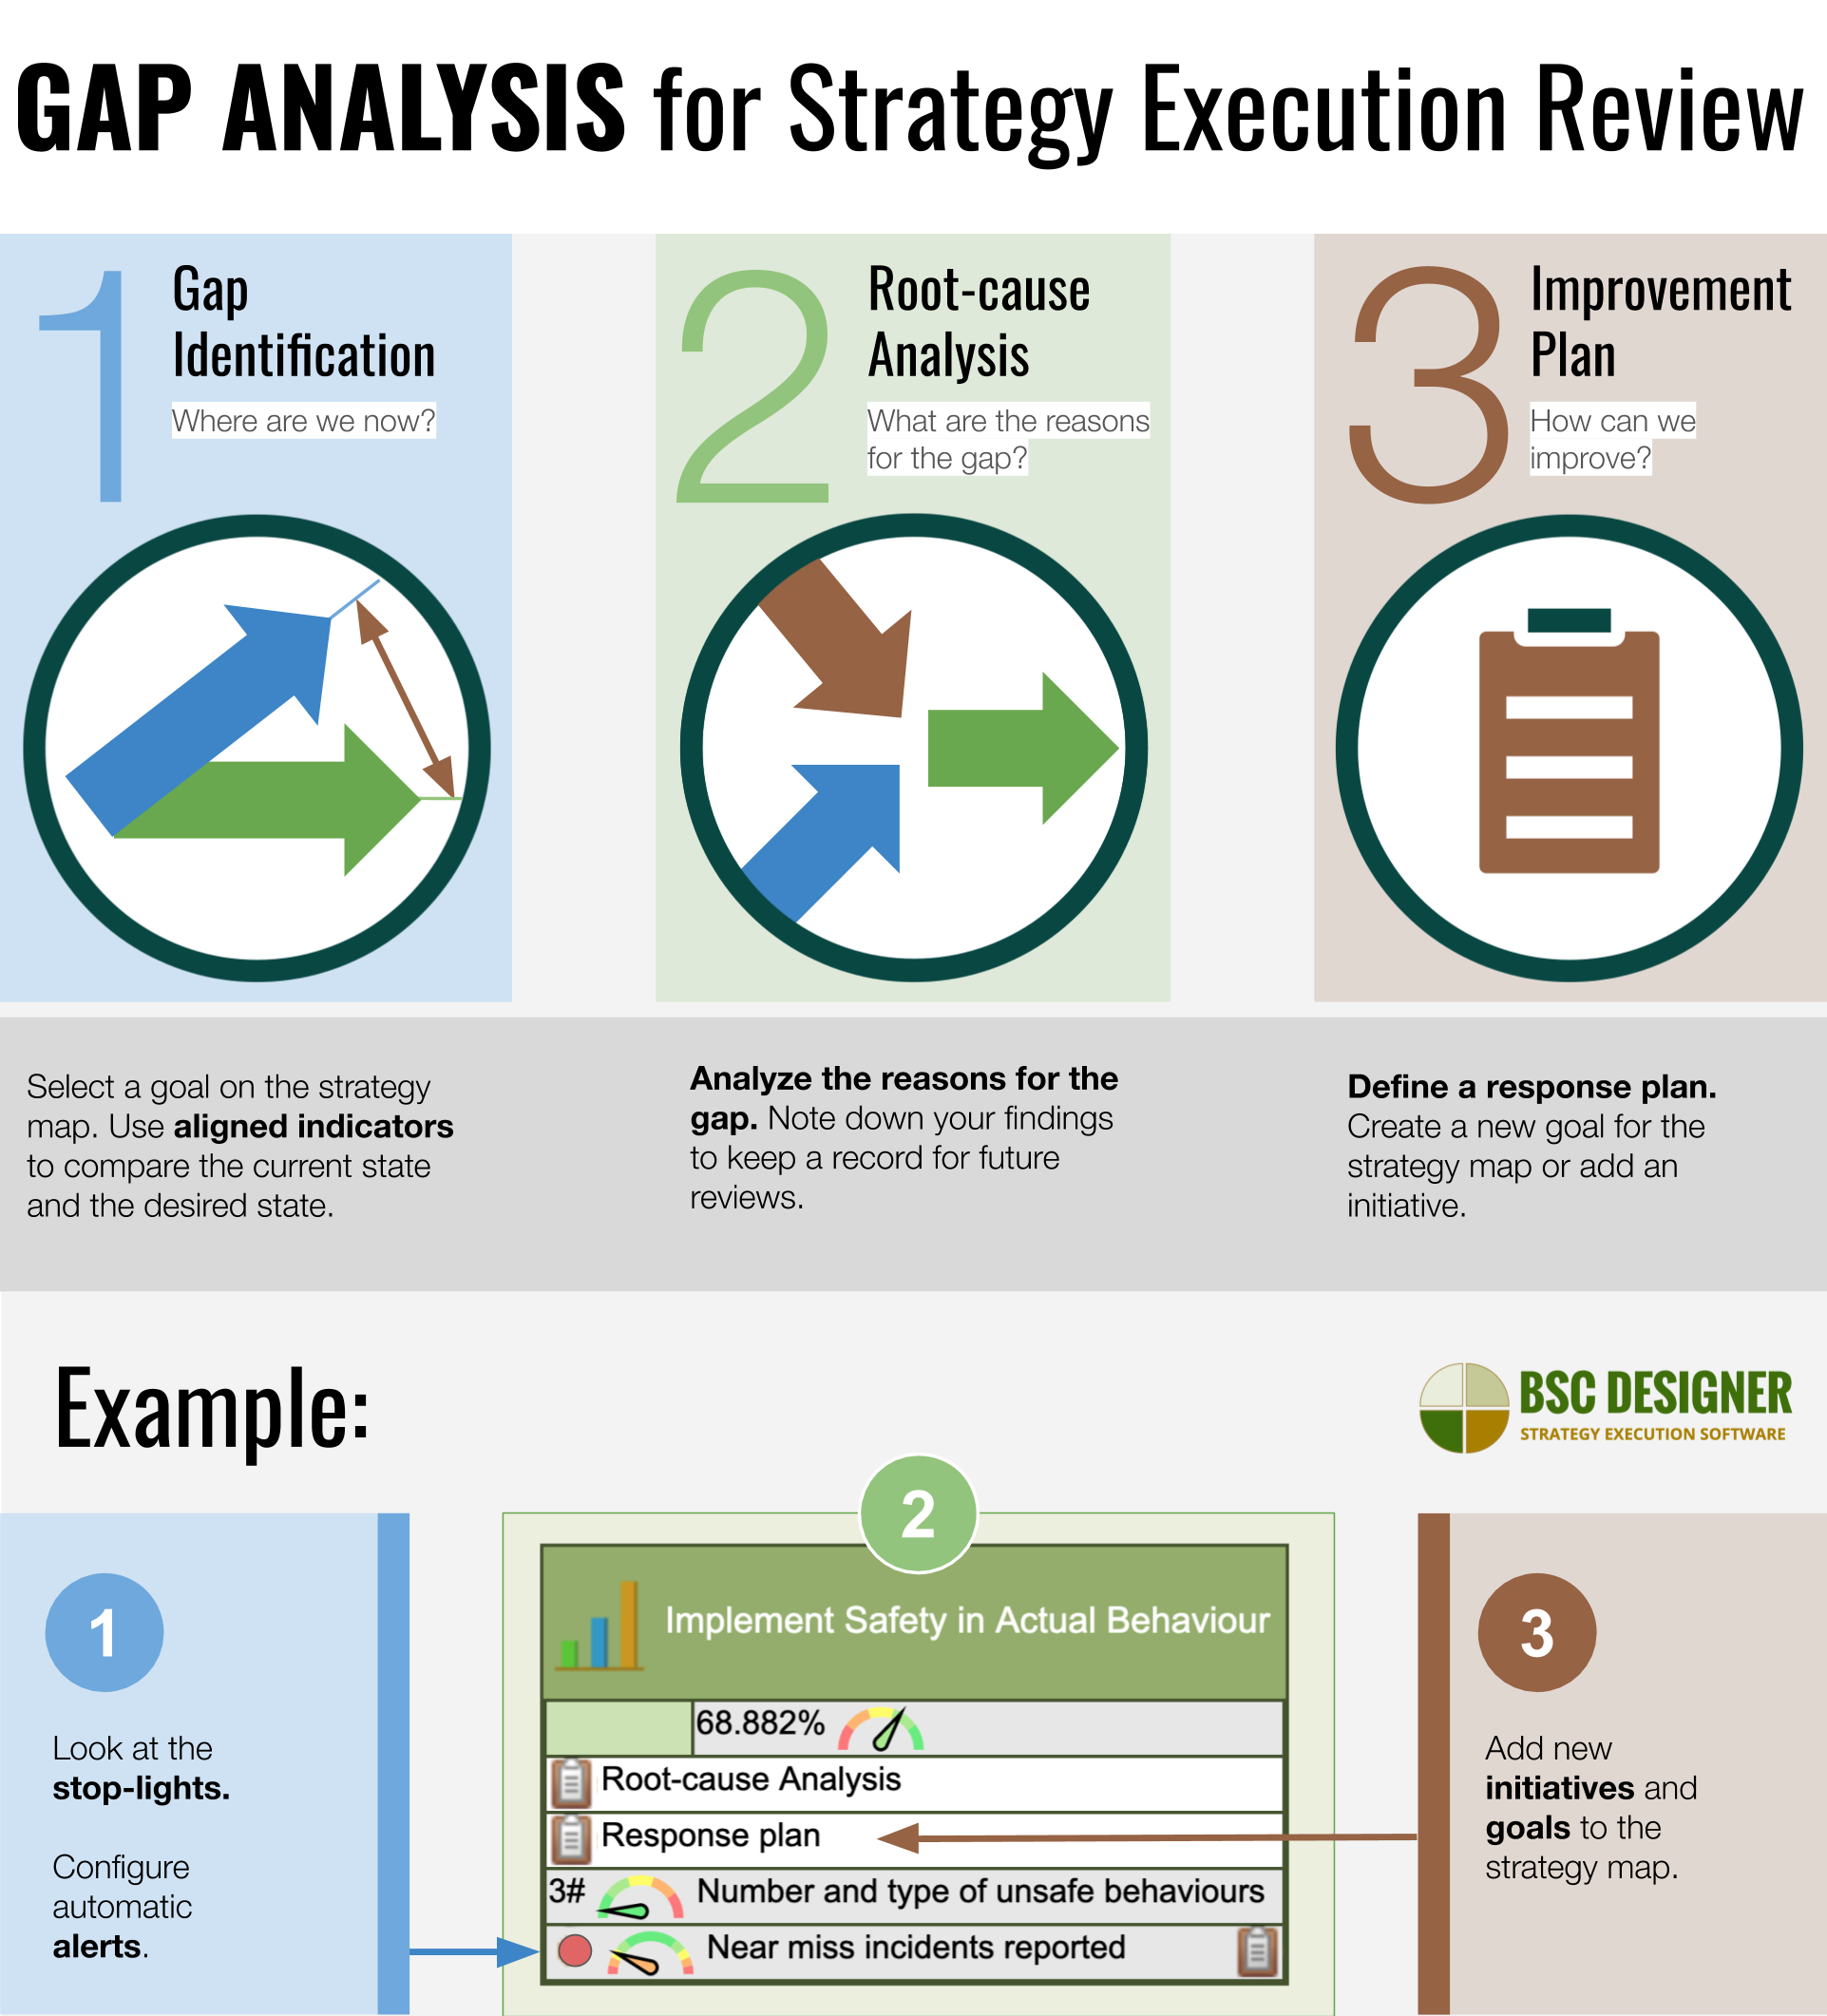
Here are the steps of the gap analysis when applied to the strategy execution process.
| Analysis Step | Step Description | Software automation |
| 1. Gap Identification. Goals and their state.
Question to ask: Where are we now? |
Select a goal on the strategy map. Use aligned indicators to compare the current state (the indicator’s actual value) and the desired state (the indicator’s target value). | Stop-lights. Automatic alerts in BSC Designer. |
| 2. Root-cause Analysis. Gap analysis.
Question to ask: What are the reasons for the gap? |
Analyze the reasons for the gap (dig deep enough to find real reasons). Note down your findings to keep a record for future reviews. | Map your findings on a fishbone diagram. In BSC Designer, use a separate map. |
| 3. Improvement plan. Corrective actions.
Question to ask: How can we improve? |
Define a response plan. Create a new goal for the strategy map or add an initiative. | Add new goals to the strategy map. Use an OKR framework. |
Focus Gap Analysis on the Less Expected Gaps
In a changing business environment, there are always too many gaps. Focus on less expected ones.
For example:
- The number of Brazilian speaking leads is 7% more than expected – not a surprise, as the product was completely localized to Portuguese, and we also have a local team there.
- The number of Japanese speaking leads is 7% more than expected – that was completely unexpected for us, so we should focus here and analyze the reasons.
Bad News Bias
Due to our human nature, we tend to attribute positive changes to our actions and negative changes to the random fluctuations.
For example:
- Product sales increased 10% more than expected! Great job done! (Yes, but we forgot about 15% general market growth.).
- It looks like visitors are returning to our website 5% less often. It’s just seasonal fluctuations. (Probably it is not, but we need to have data to say this for sure).
There is no universal solution to the bad news bias – just train your team to dig deep enough to get to the real story.
Planning Corrective Actions
The corrective actions might vary in their execution scope:
- Some improvement ideas might become new goals on your strategy map,
- Some might be more of an operational nature – the new initiatives for the goals on the map.
When planning corrective actions, note down the findings of gap analysis, e.g. the reasoning behind past performance and your aspirations about the new approach.
Like any planning, it works much better if:
- There is a deadline for execution
- Revision is planned
- A person responsible is assigned
A good framework for addressing the findings of the gap analysis is the OKR framework.
Identifying the Gap. The Role of Frameworks.
In the beginning, we agreed that we will discuss gap analysis applied to the properly described and cascaded strategy. What if the strategy is not yet formulated completely?
In this case, gap analysis, together with other frameworks like SWOT, MBO, 7-S, Fishbone, PESTEL, Burke-Litwin Model, Three Horizons, Nadler-Tushman will help to shape the thoughts about strategy. This is what we talked about in Strategic Planning article (see step 2).
What Gap Should be a Priority? Gap Normalization.
The performance gaps are different… let’s say we are looking at the “training hours” indicator and “Near miss incidents reported” indicators:
- Training hours. Actual value: 5 hours; target value 8 hours; 3 hours gap.
- Near miss incidents reported. Actual value: 2 near miss reported. Target values: green zone between 3 and 6 reports; red zone if less than 3 reports or more than 6 reports. 1 near miss report gap.
How can we compare these two gaps? What is more important? The 3 hours difference or 1 near miss incident report? We cannot compare those two right away. We need to normalize them first.
During normalisation, we can use difference performance functions:
- For the training hours indicator, the performance function might be linear (more training is better).
- For the near miss incidents, we might use the sine performance function – too few reports means that people are not taking near miss reporting seriously, too many reports means that there are some chronic problems with safety
After the normalization, we know how to interpret the data correctly. If you are using automation software for your KPIs, then it will do all the calculations for you, showing just the progress figures, stop-lights or the relevant gauge diagram. There’s no need to do the normalization manually.
![]()
Example of the Gap Analysis
Let’s illustrate the ideas of this article with some real examples. I’ll be using a safety strategy scorecard for this purpose. You can find this scorecard template among other templates when you sign-up with a free plan with BSC Designer.
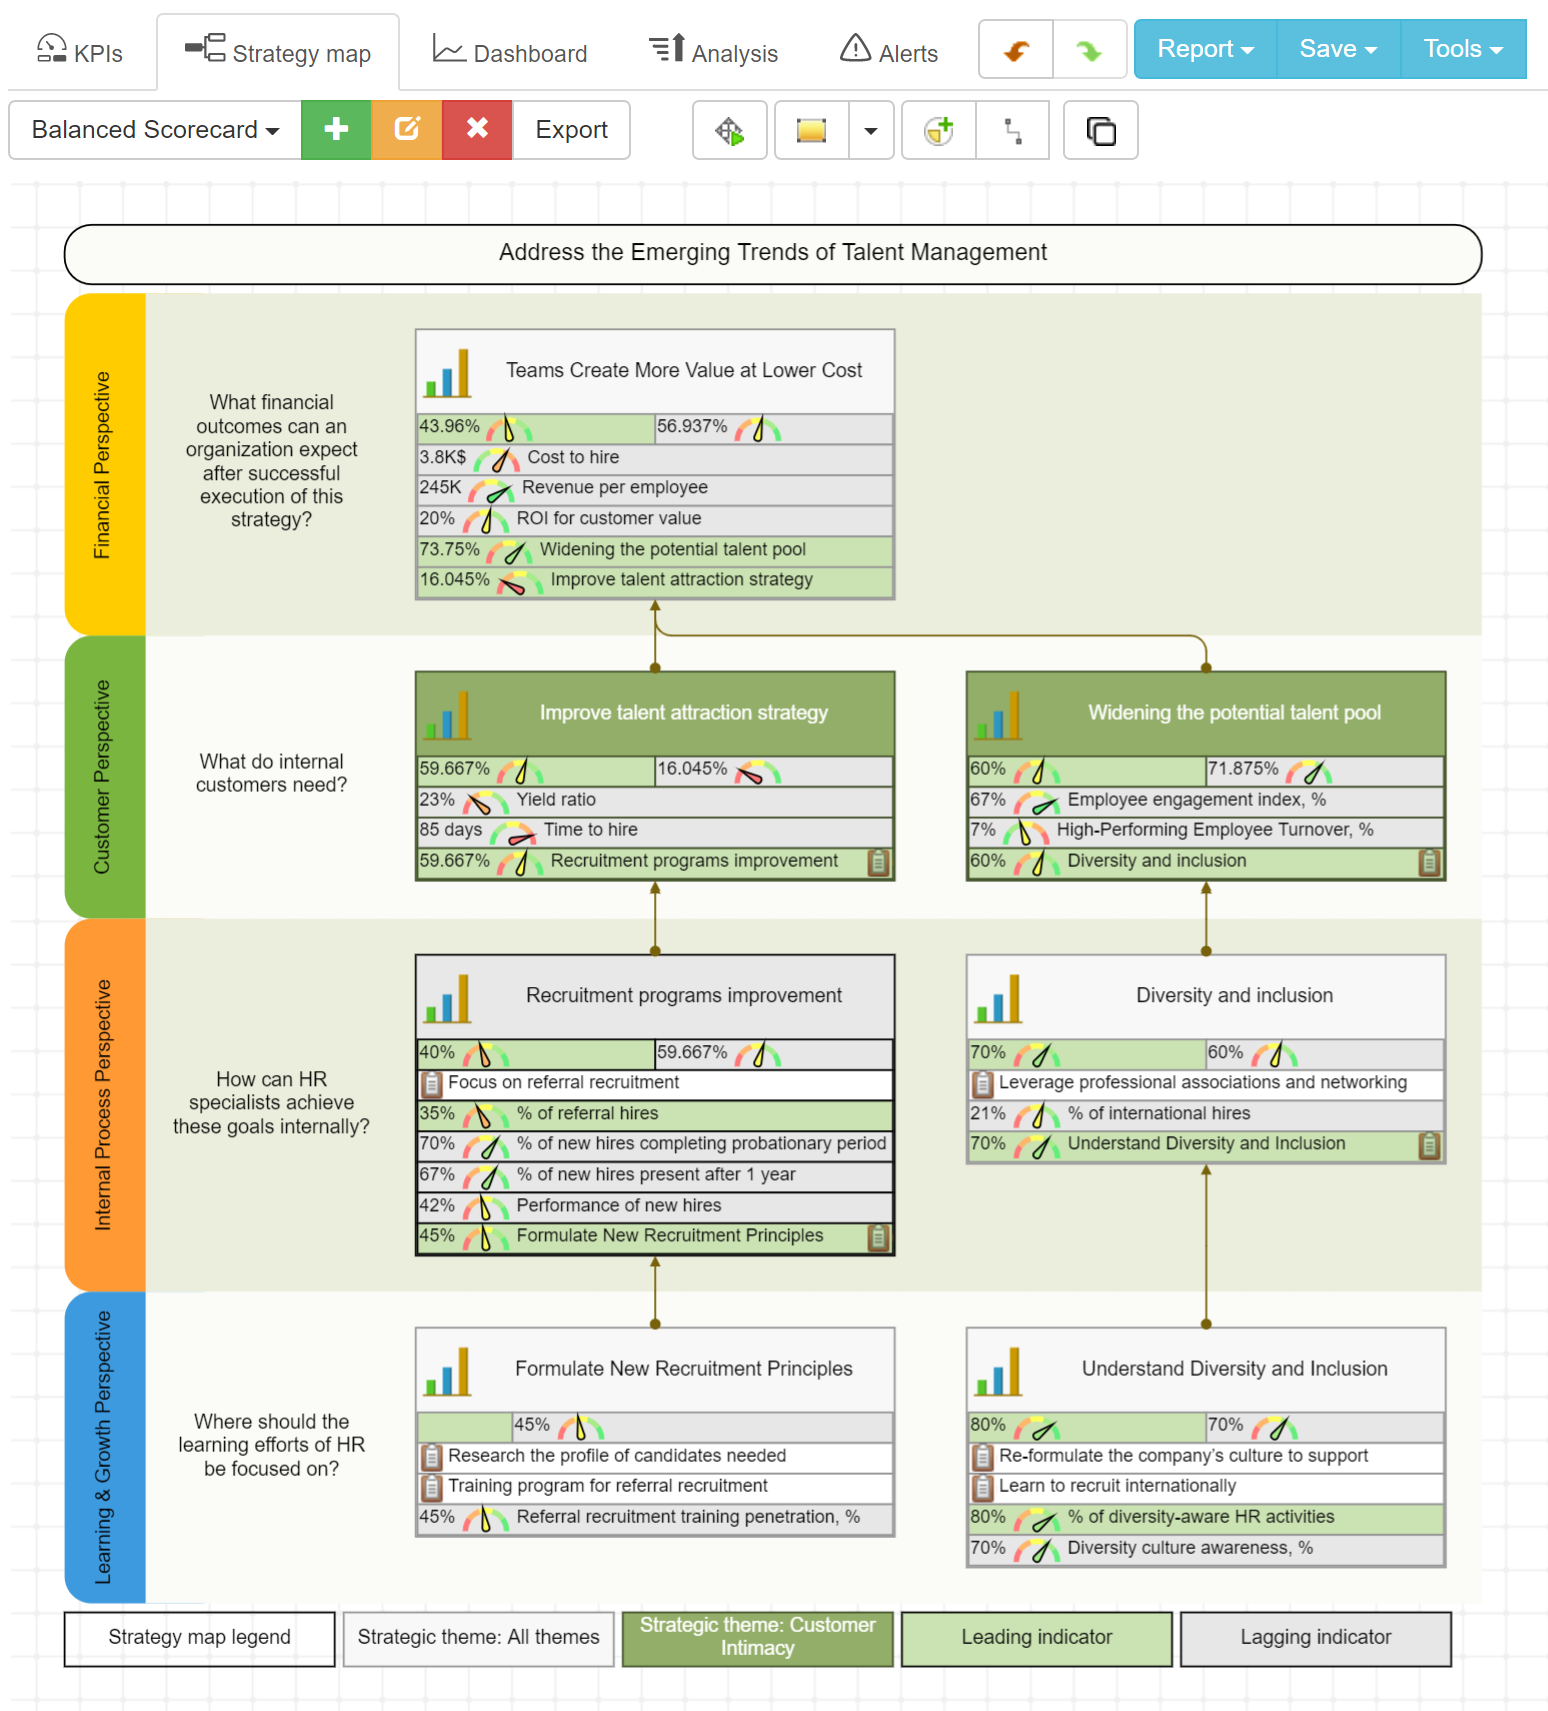
Step 1. Gap Identification
Let’s look at the map. It includes all the necessary information to identify the gaps visually. We can simply look at the stop-lights next to the indicators or the performance gauge charts to find the gaps.
Another way to identify gaps:
Use Stops Lights for the Indicators
Look at the individual indicators on the KPIs tab. The columns of the table can be customised. For example, the column with the performance figures and stop lights will help us to find the poor performing indicators.
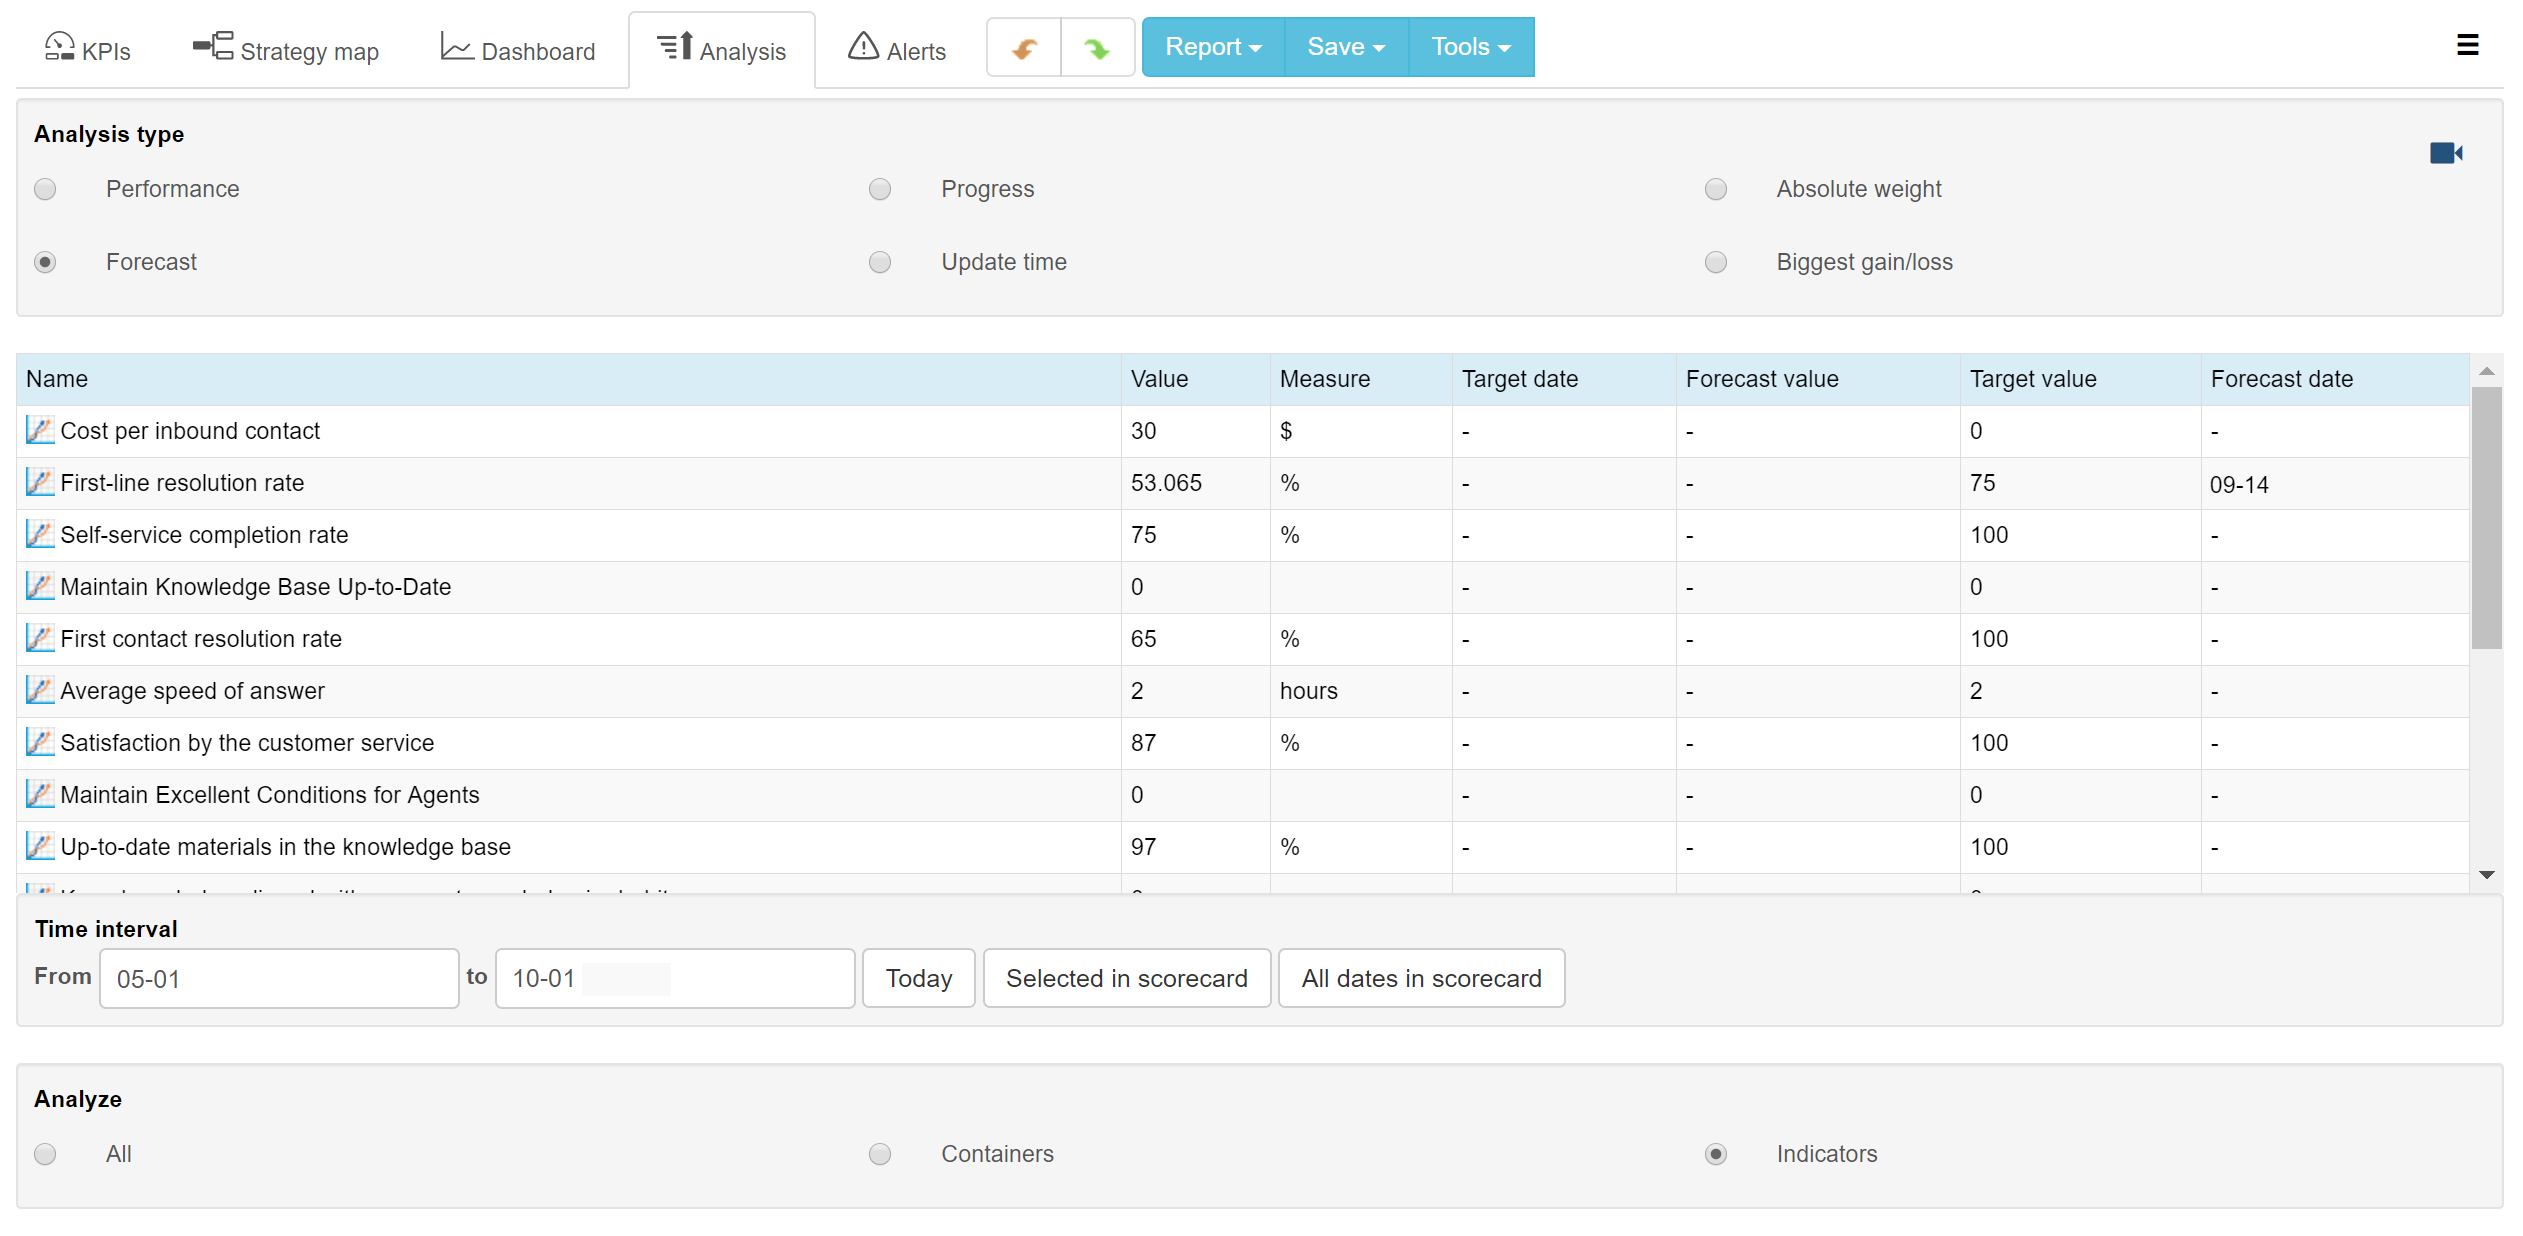
Use the Analysis Function
A more robust way to find the performance gaps is to switch to the Analysis tab and use the “progress” or “biggest gain/loss” analysis to spot the biggest differences between the current values and expected target value.
Use Alerts Function
You can use the Alerts functions to set up automatic notifications about the KPIs in the red zone. In this way, you will learn about the most important gaps automatically.
For this example, let’s focus on the “Implement Safety in Actual Behaviour” goal. We might have noticed that its lagging performance is in the red zone.
Step 2. Root-Cause Analysis
Looking at two lagging indicators that contribute to the goal’s lagging performance, we can see that the reason for the gap is that we have fewer near miss incidents reported than we expected. We’ve noticed that this year, we had 30% less near miss reports, while the number of safety accidents remained the same.
We need to analyse the reasons for less frequent reporting. In this case, we can simply talk to the stakeholders involved and find out what went wrong and why near misses were not reported:
- Do people know what they need to do?
- Do they know what is a near miss?
- Do they know how to report?
- Do they know how their report will be used (and will not be used)?
The analysis shows that the problem was with general awareness about near miss reporting.
Step 3. Improvement Plan
The root-cause-analysis showed that the team is not well-informed about how and when to report near misses.
- We already have the “safety awareness” goal on the map, so there is no need to create a new goal. Instead, we can add a new initiative to that goal.
The initiative will include the details of our analysis, the response action (safety awareness training) as well as the budget needed.
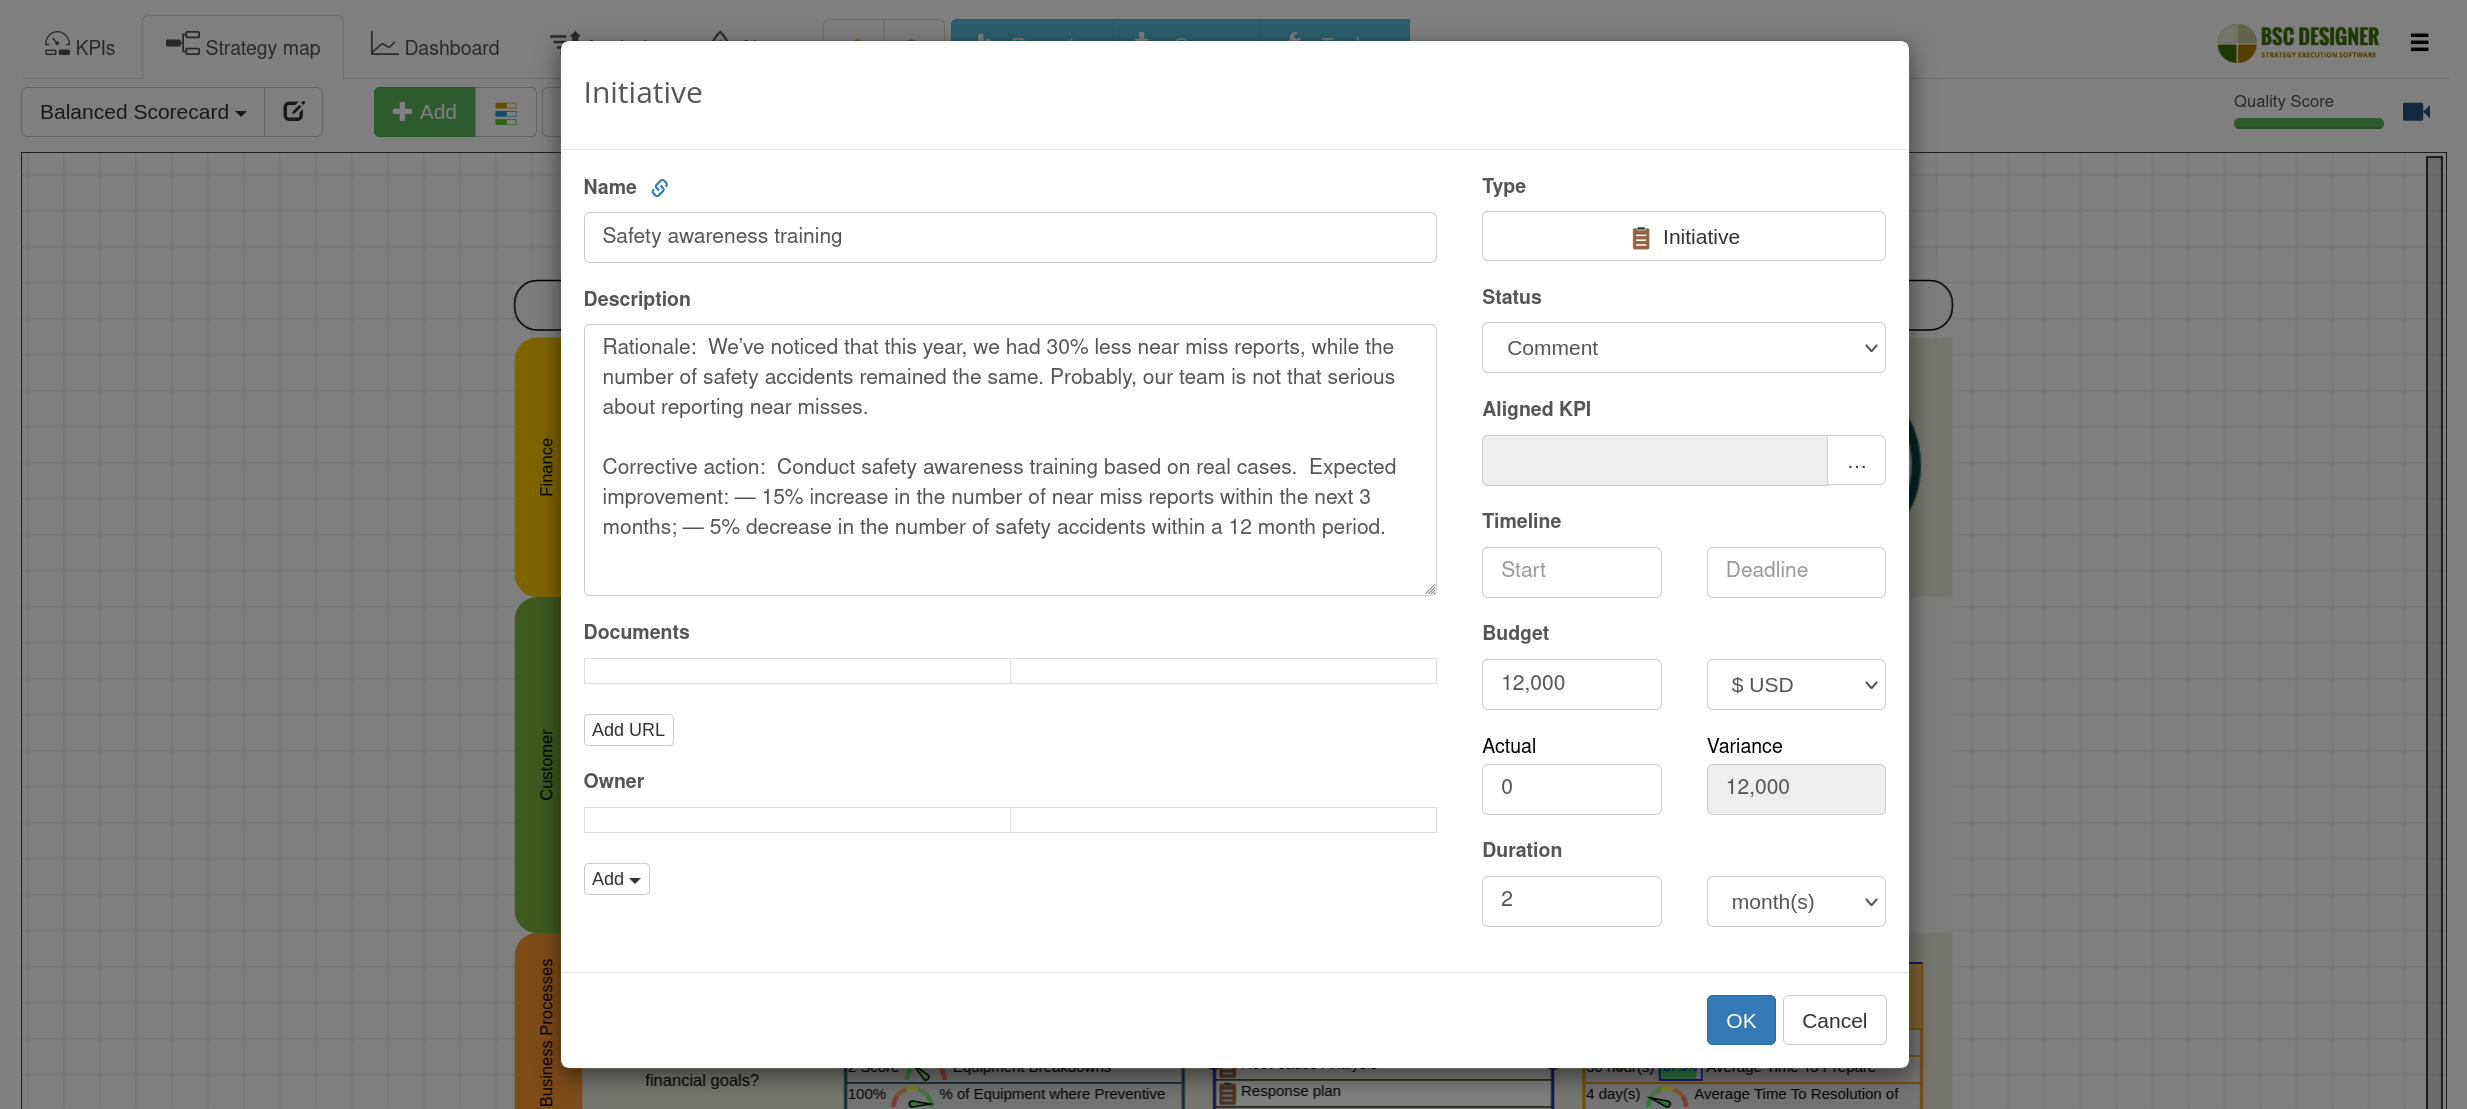
Name: Safety awareness training
Rationale: We’ve noticed that this year, we had 30% less near miss reports, while the number of safety accidents remained the same. Probably, our team is not that serious about reporting near misses.
Corrective action: Conduct safety awareness training based on real cases.
Expected improvement:
— 15% increase in the number of near miss reports within the next 3 months;
— 5% decrease in the number of safety accidents within a 12 month period.
Budget: $12000
Timeframe: 2 months
Additionally, we can switch to the KPIs tab and use the values editor to update the targets for the indicator for the next review period.
To make the impact of safety awareness training more visual, we can create a dashboard and place the “near miss indigents reported” indicator there.
Summary
In this article, we discussed how to apply a gap analysis to the strategy execution review. Here are some key ideas:
- Have your strategy map ready – quantify goals with leading and lagging metrics
- Find the gaps – look at the indicators with significant differences between the current value and target (e.g. indicators in the red zone)
- Analyze the reasons for the gaps, note down those reasons and get back to them during the next review
- Prepare a response plan
- Last but not least – use strategy execution software like BSC Designer to automate the steps of gap analysis
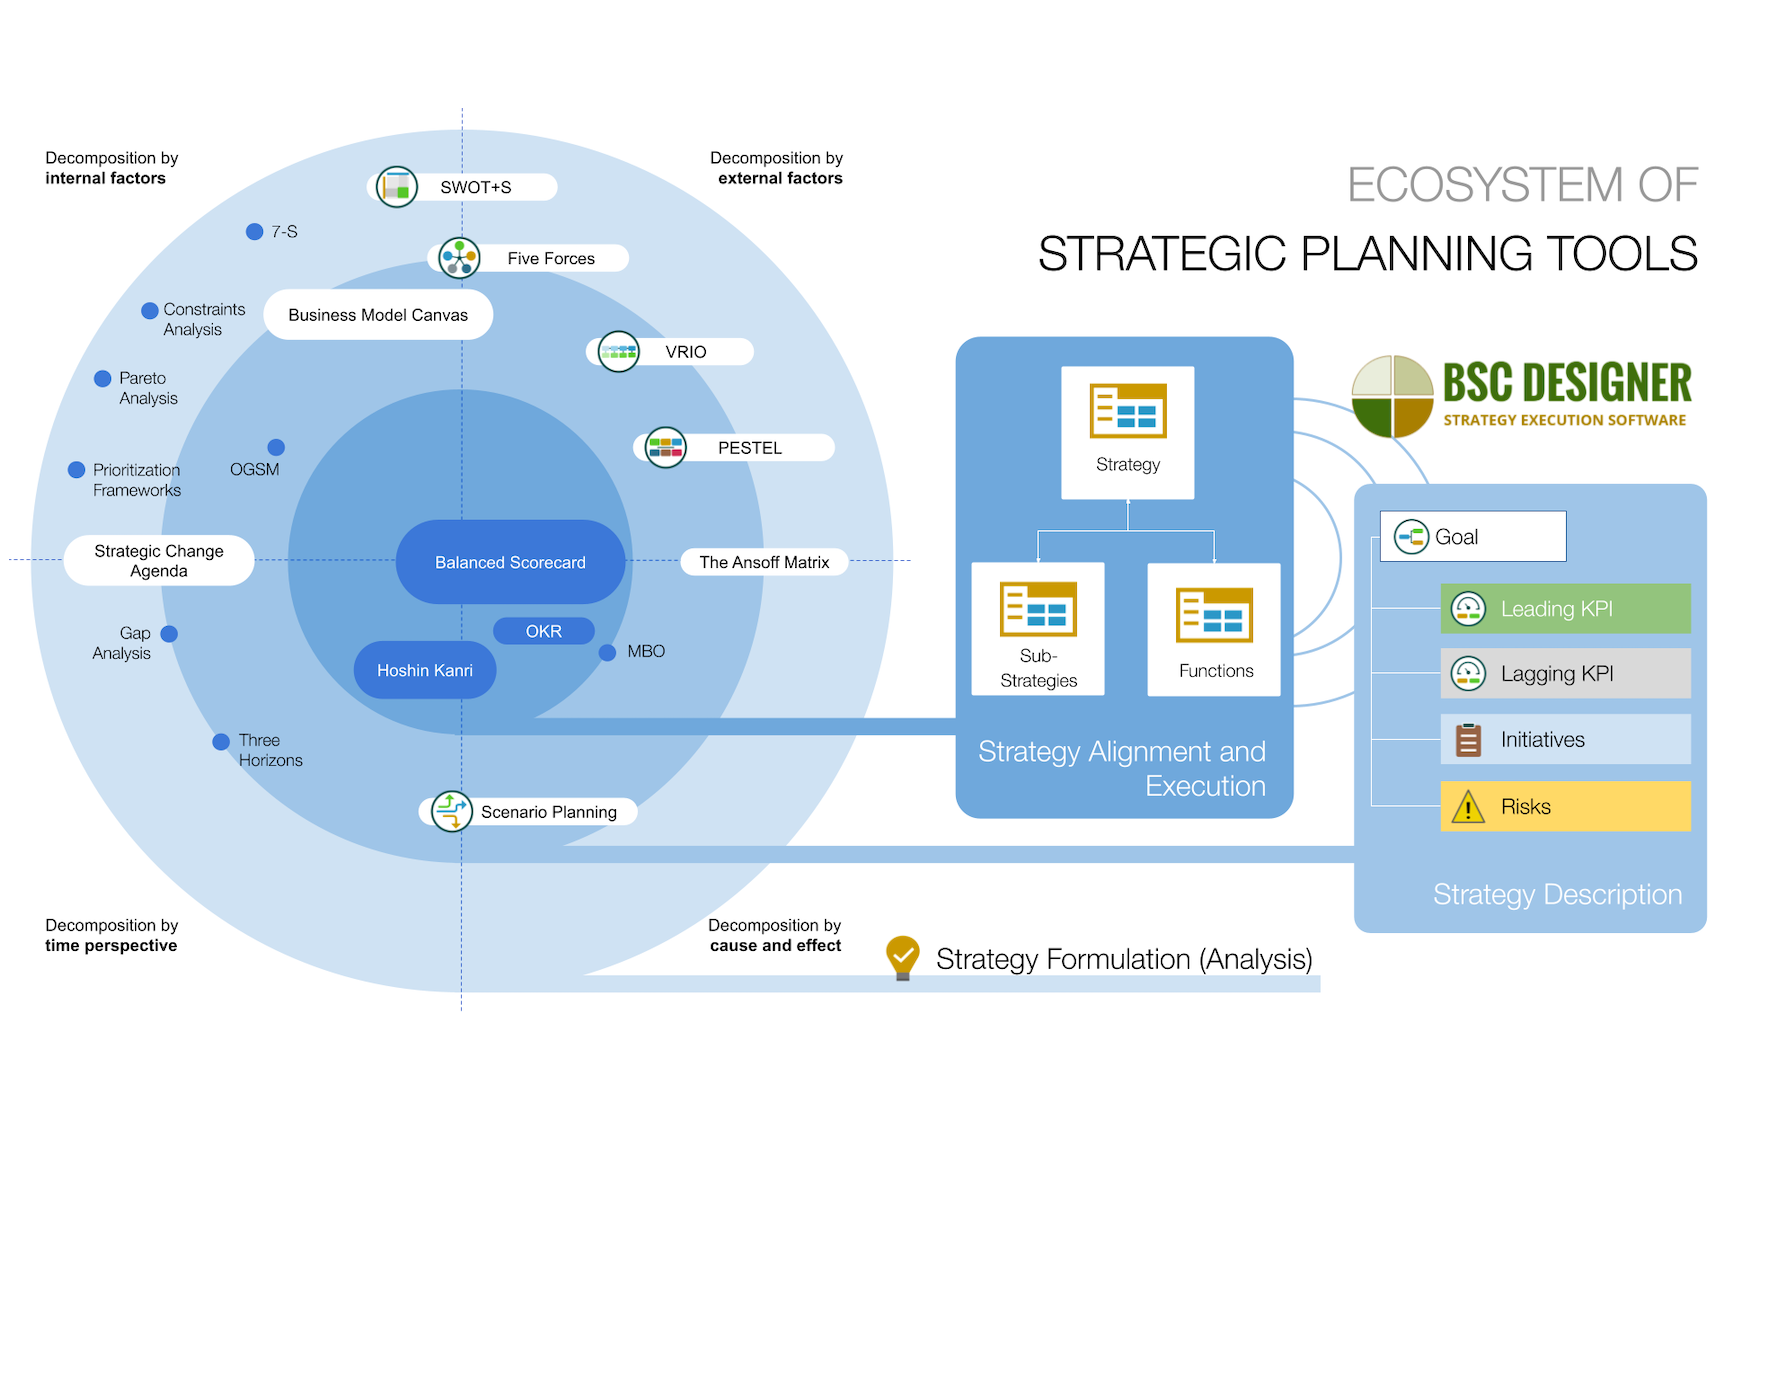
Comparative Table of Strategic Planning Frameworks
- Strategy execution frameworks. Such as the Balanced Scorecard for the overall strategy and the more lightweight OKR framework for specific challenges.
- Strategy formulation frameworks. SWOT, Three Horizons, Constraints Analysis, PESTEL, Gap Analysis, etc. that help organizations to generate new ideas.
![]() CEO | Author | Speaker
CEO | Author | Speaker
BSC Designer is strategy execution software that enhances strategy formulation and execution through tangible KPIs. Our proprietary strategy implementation system reflects our practical experience in the strategy domain.