BSC Designer: Onboarding for Strategic Planning Software
Learn the key mechanics of BSC Designer for managing goals, KPIs, initiatives, strategy maps, and dashboards.
Migrate existing strategy scorecards (various levels of the goals, KPIs, their data, targets and initiatives) from spreadsheet software to BSC Designer:
Strategy Implementation System
Learn how to articulate the strategic ambitions of stakeholders into a comprehensive strategy supported by aligned strategic and functional scorecards, following the Strategy Implementation System.
Account Setup in BSC Designer
Setup an account in BSC Designer, change logo, add currencies for the initiatives, backup and restore data.
Free Plan
Before buying any subscription we do recommend for all users to start with a free plan. For the free plan we don't ask for a credit card details.
Switching to the Paid Account
Once the product was carefully evaluated a user can get a quote and buy a required subscription plan using the online price calculator. The calculator will ask for the required number of power users and preferred billing cycle.
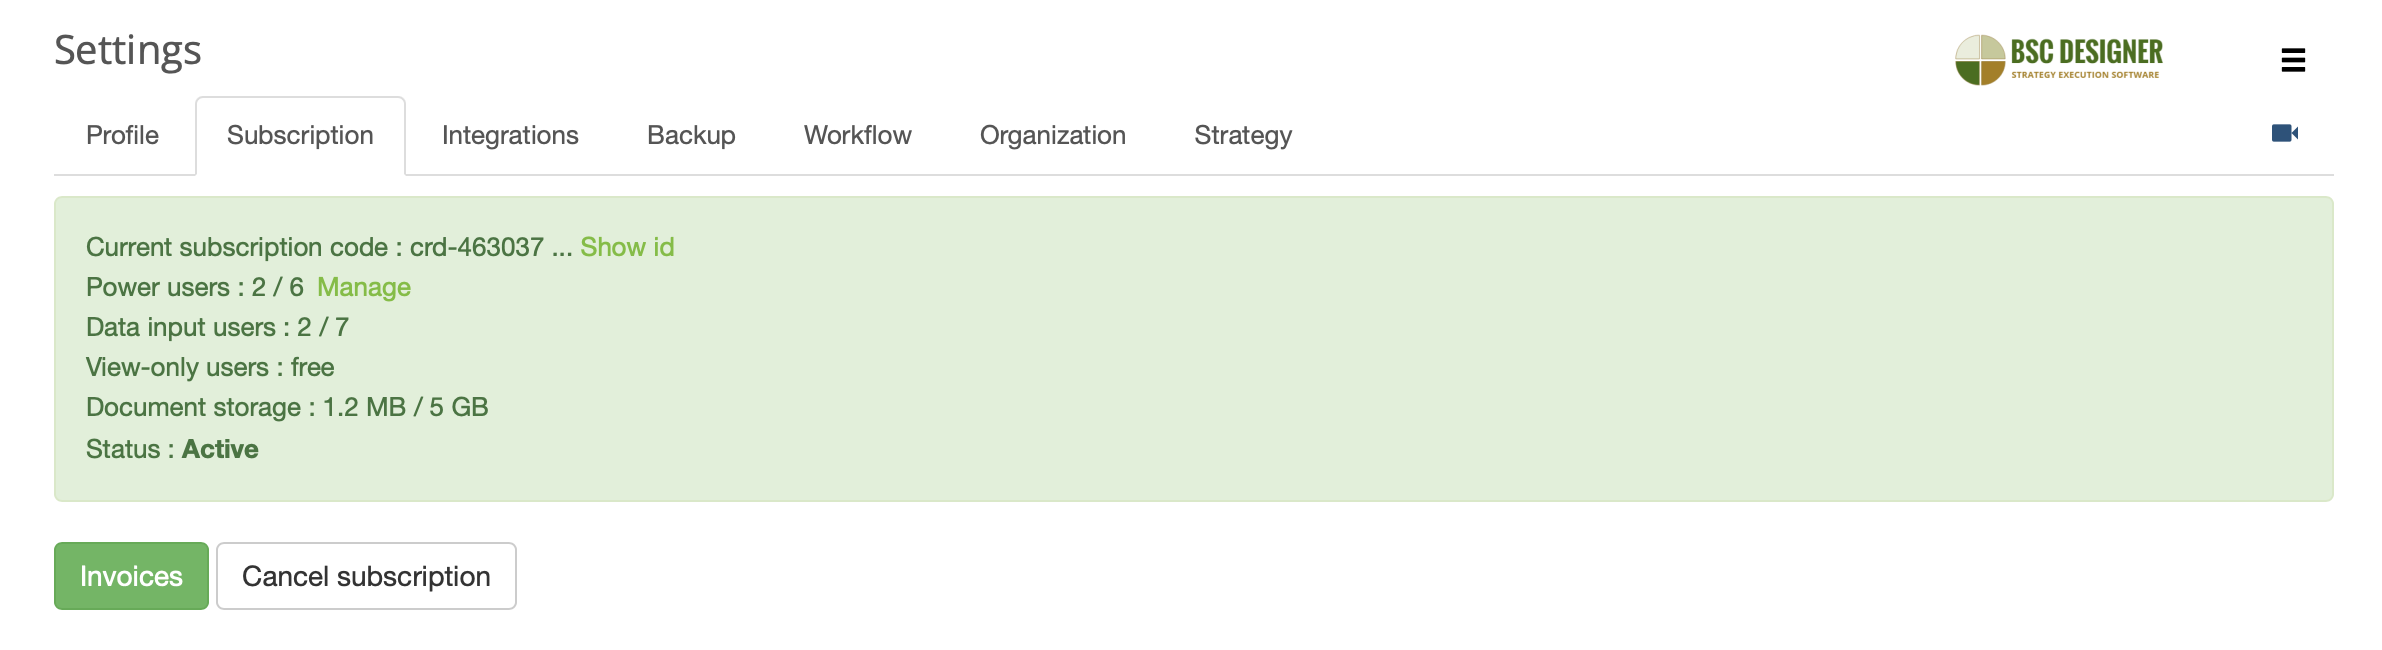
Once the order is finalized you will have an activation code. Follow these steps to enter it into BSC Designer:
- Login into your account
- Click
 > Settings > Subscription tab
- Copy into the text box the Credit ID that you have (it starts with "crd-" and ends with "-kpionline")
- Click Activate button
Account Backup
A security copy of the BSC Designer database is created regularly. You might be required by the security regulations of your company to do additional backup copies of your data. Follow these steps to do a backup of your account:
- Login into BSC Designer
- Go to > Settings > Backup tab
- Select there Backup scorecards and groups to backup the data from your account, or Restore scorecards and groups to restore from a previously saved backup.
Please note: these additional backups need to be stored locally and are not saved on BSC Designer server. Additionally, you might want to turn on the log of user activity in your account.
Workflow
- Use the Scorecard templates section to manage custom templates for new scorecards.
- Use the Custom KPI fields to define custom fields for KPIs that will be available on the
 KPIs tab> General Tab > Description dialog.
- Use the Initiative statuses group to define statuses for the initiatives.
- Use the Notifications for owners to configure global notifications for owners.
- Use the Historical data to define a period opened for data input for the users with limited rights.
Organization
On this tab, manage the settings specific for your organization:
- Specify the name of the organization
- Define how the YTD (Year-to-Date) should be calculated
- Define the start date of a fiscal year
- Change the logo used in the program interface and for the reports
- Setup currencies that can be used for the budgets in the initiative and for the measurement unit of KPIs
- Enable Two-Factor Authentication for more secure access
- Customize Date and Number formats
- Manage documents uploaded for goals, indicators, and initiatives
The currency marked as a default will be used as a base currency for the calculations of the totals in the cost of strategy report.
Strategy
Define here the company's strategy statements and strategic themes that will be later used for the strategy maps.
Manage the list of stakeholders to later assign them to goals, indicators, or initiatives via the Owner field.
Keyboard Shortcuts
General shortcuts:
| N |
New item |
| Control + Z |
Undo |
| Control + Y |
Redo |
| Esc |
Close dialog without saving |
| Enter |
Close dialog and apply changes |
| Shift + D |
Delete item |
Shortcuts for the KPIs tab:
| Shift + N |
New item on the same level |
| I |
Initiatives dialog |
| C |
Comments dialog |
| V |
Values editor dialog |
| Control + C |
Copy item |
| Control + V |
Paste item |
Shortcuts for the My Scorecards section:
| P |
Scorecard properties dialog |
| S |
Scorecard share dialog |
Getting Started with an Account
Here are some recommended steps to get started with an account:
Once you reviewed main features using example scorecards, try all the functionality on your own:
Get Started Using Free Balanced Scorecard Templates
Use free Balanced Scorecard templates available in BSC Designer as a starting point for a new scorecard with KPIs and strategy maps.
How to Use a Balanced Scorecard Template
Here are the steps to use a Balanced Scorecard template.
- Log into your account. If you don't have one, create a free account
- Click the New Scorecard button
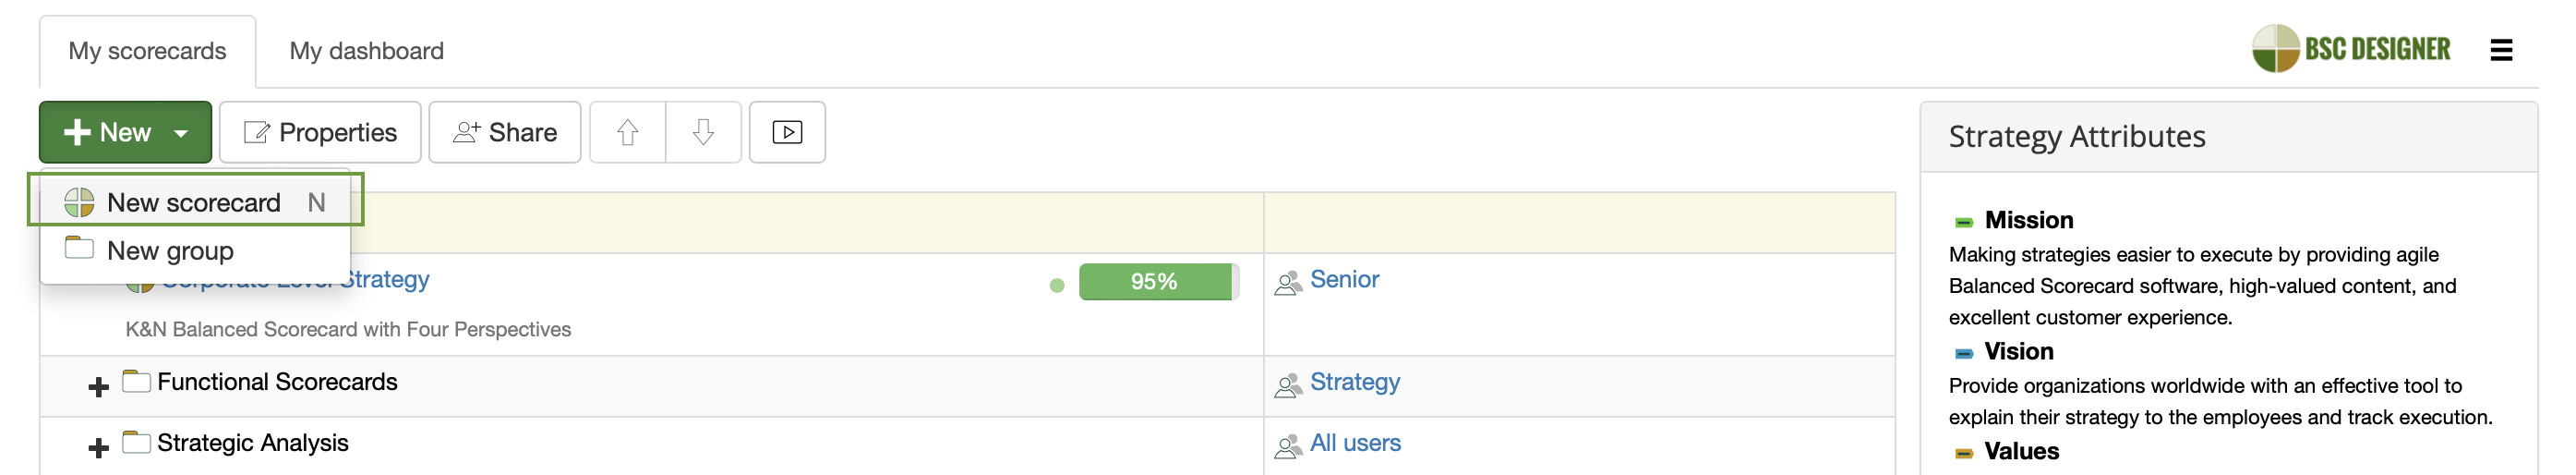
- Select a template from the More templates... list
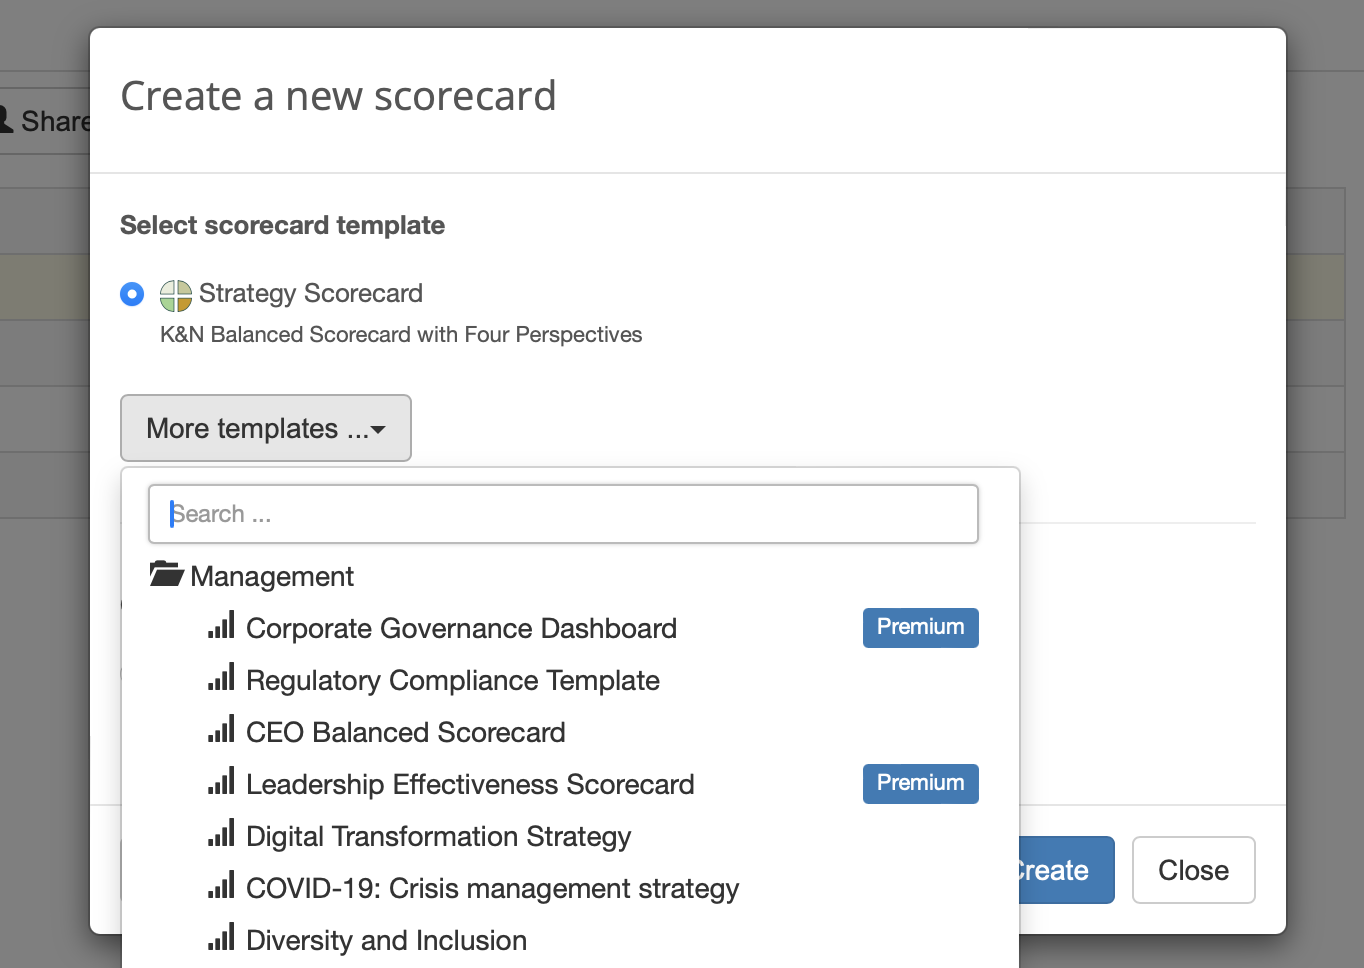
Review and Customize a Template
The template is now in your account. Now it's time to review what you have and customize it according to your needs.
- Go to > Strategy Workspace > My Scorecards section and click on the scorecard to open it, wait until BSC Designer loads all the data
- You will see the interface of BSC Designer and its main toolbar:
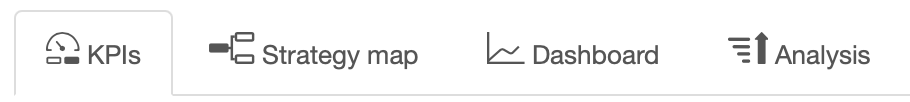
- Click on the KPIs tab to review the KPIs that exist in the scorecard; with this tab you can:
- Modify existing KPIs or create new ones
- Enter performance data into the KPIs
- Align initiatives with KPIs
- Create a link to the KPIs in other scorecards
- Learn more about working with KPIs.
- Finally, switch to the
 Strategy map tab, here:
- You can see a "big picture" of your business strategy
- Business goals, KPIs, initiatives, and the cause-and-effect logic is represented visually
- Learn more about working with Strategy Maps.
The scorecard is ready, feel free to add more KPIs, business goals, or build your own dashboard.
Check out "Get Started" in the user manual for more information.
Create Custom Templates for Your Account
Users can add their own templates to the software and also replace a template for a new scorecard.
Organize Scorecards and Dashboards in a Workspace for the Strategy Team
Create strategy scorecards and share them with your colleagues. Show the vision, mission and values of your organization in the widget section.
My Scorecards
My Scorecards section is a workspace for your strategy team. Here you can:
- Create and manage
 scorecards
- Organize scorecards into
 groups
- Assign access rights on the group, scorecard, or KPI level
- See the high-level performance data for the root KPIs of the scorecards
Widgets
The Widgets section shows:
- The organization's mission, vision, values
- Recent activity of the team members
Strategy Sandbox
Create a strategy sandbox where new members of your team could practice their strategy skills in a safe environment:
- Create a group called Sandbox
- Use the Share button to give a group All users the right to create and modify scorecards in the sandbox
- Encourage users to create new scorecards, try adding new goals, indicators and initiatives in the sandbox group
Introduce new members of the team to existing strategies by giving view rights to the real strategy scorecards.
Customizing the Scorecard Templates
To save a scorecard as a template, follow these steps:
- Open a scorecard.
- Select the Save as template command from the Tools menu.
The new template will be available in the 'New > New Scorecard > More templates' section.
To manage custom templates and select a default template for new scorecards, follow these steps:
- Select > Settings > Workflow.
- Use the controls in the Scorecard templates group.
My Dashboard
My Dashboard is a global dashboard created using data from all scorecards within your strategy workspace:
- Toggle between predefined dashboards or customize the dashboard layout.
- The diagrams display items where the current user is specified as the owner.
- Focus diagrams on what's important by applying filters.
- Double-click on the cell in the Value column to enter data into a KPI.
- Double-click on an item's name to drill down into the underlying data.
Create a Simple KPI Scorecard using BSC Designer
Create a simple scorecard step by step. Add goals, set up indicators, and create initiatives.
Here is the summary of the steps explained in the video.
Create an empty scorecard
Login to your account or sign-up with a free plan.
- Select > Strategy Workspace > My Scorecards
- Click New > New scorecard
- Create a blank scorecard or use one of the templates
Add a new goal
Goals are containers for indicators.
- Select Customer perspective
- Click Add button on the toolbar
- Specify the name of the goal in the Name field (example: "Improve quality of the product")
Add lagging indicator
Make the goals more specific by quantifying them with indicators.
- Select the goal created on the previous step
- Click Add button on the toolbar
- Specify the name of the indicator in the Name field (example: "The number of problems reported")
Set up indicator
Select an indicator and use the tabs below to adjust its settings.
 General tab:
- Specify description, owner, measurement units
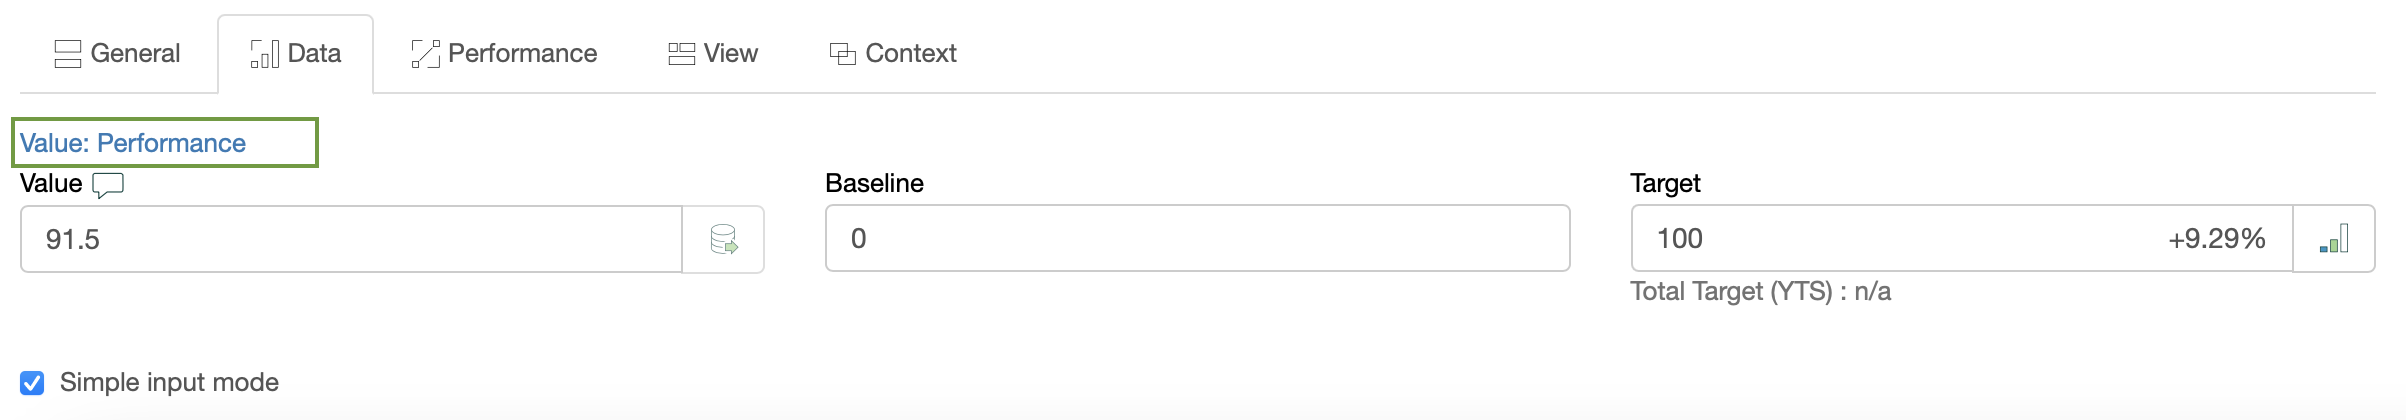
 Data tab:
- Enter baseline, target, current value (used to calculate indicator's progress)
- Click the Values editor button for advanced settings - update interval, inheritance, grouping of the indicator
- Use the Data source button to automate data input via Excel, databases, RestFULL API
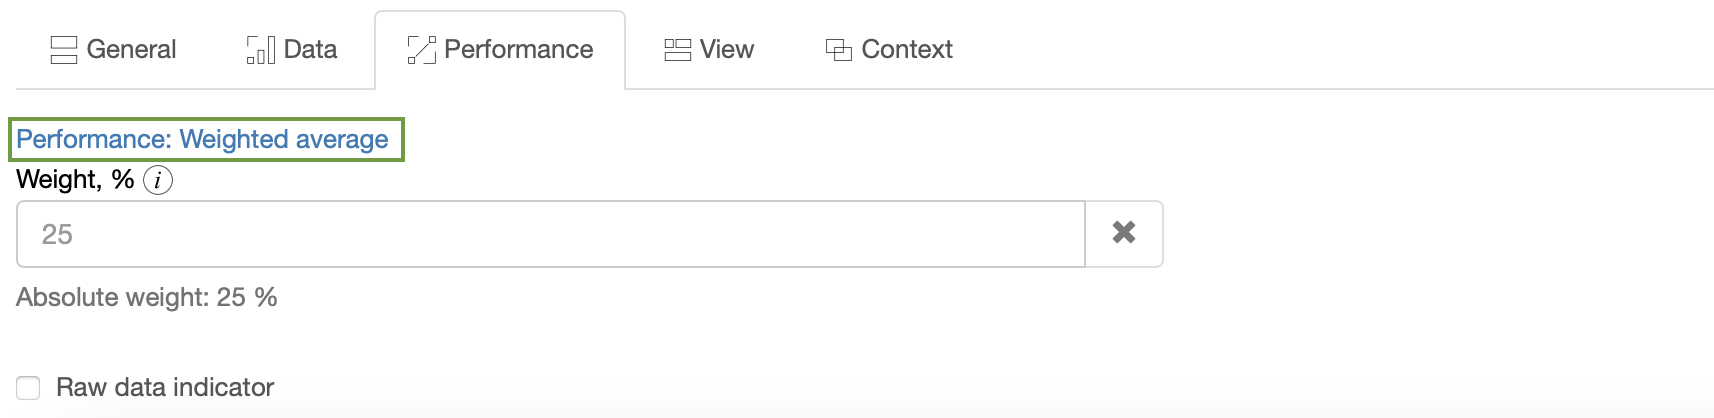
 Performance tab:
- Adjust the performance function (typically maximization or minimization)
- Specify the relevant weight of the indicator compared to other indicators in the same branch
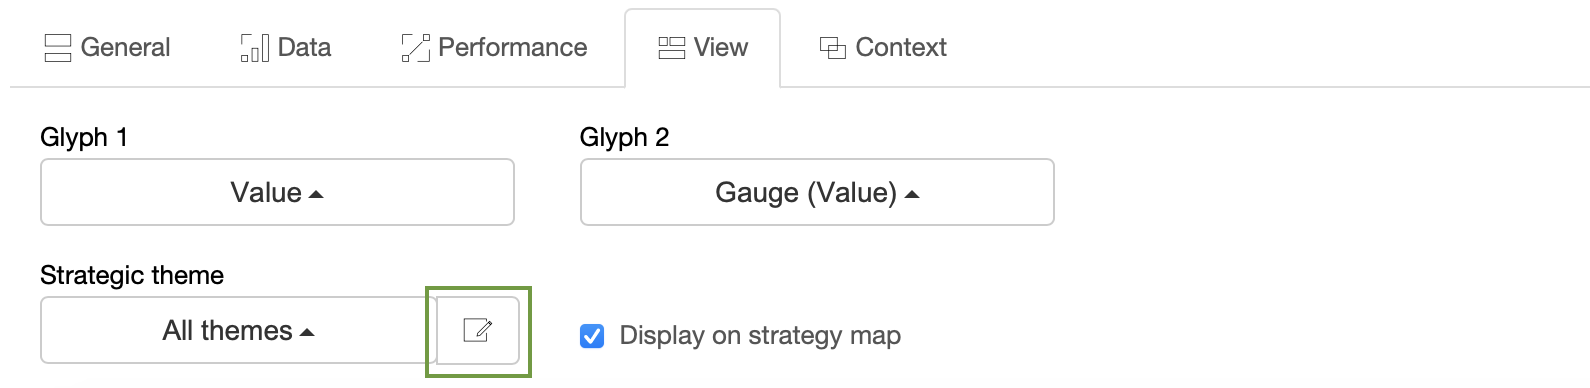
 View tab:
- Change the glyphs used on the strategy map for the indicator
- Change the strategic theme
 Context tab:
- Change the type of indicator (leading or lagging)
Create leading indicator
Leading indicators are aligned with success factors and quantify efforts.
- Click the Add button to create a new indicator
- Specify the name of the indicator in the Name field (example: "% of reviewed processes")
- Switch to the Context tab to change the type of indicator to leading
Create initiatives
Formulate action plans or initiatives for the goals.
- Click on the
 Initiative button next to the goal
- Create a new initiative - specify progress indicator, budget, timeline, additional detail
- Use other types of initiative record, such as hypothesis or rationale
Strategy map
A strategy map is created automatically using the data from the KPIs tab.
- Switch to the Strategy map tab
- Use the
 link button on the toolbar to connect two goals
- Use the AI-powered strategy quality score to improve the strategy map
Dashboard
Visualize performance data on the dashboards.
- Switch to the
 Dashboard tab
- Click the Add button to add a new diagram
- Select the source indicator and type of diagram
Cascading
To cascade scorecard, open two scorecards in separate tabs:
- Copy the source indicator (Control + C shortcut)
- Switch to the target scorecard and the paste indicator (Control + V shortcut)
- Select if you want a copy or a link
Onboard Your Strategy Team to BSC Designer
Involve members of your team in strategy planning and execution. Learn the difference between Power, Data Input, and View-only users.
Adding Users
To add additional users to an account:
- Go to the > Users section
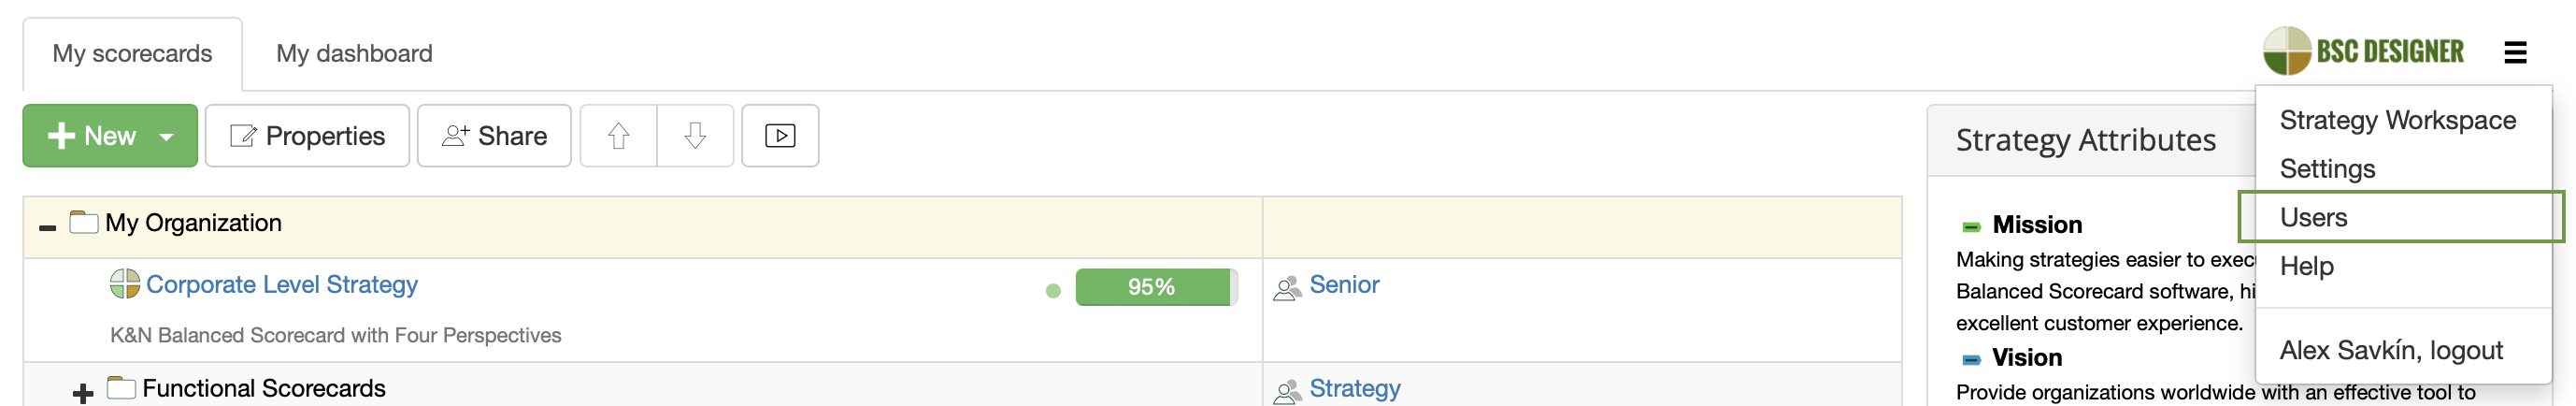
- Click the Add user button
- Enter required details:
- Press Save button
Alternatively, send out the Invite link to the users so that they can self-register under their company's account.
Types of Users
An account owner can add Administrator, Power, Data Input or View-Only users to the BSC Designer account:
- Administrator can access and modify all scorecards and account settings.
- Power users can access and modify scorecards, enter new data into KPIs.
- Data input users can only enter new data in the value field of existing KPIs.
- View-Only users can only view data already entered by other users and access dashboards and strategy maps that already exist in the scorecard.
The number of power and data input users depends on the subscription that was bought. Check out the number of users allowed in your account in the Subscription section.
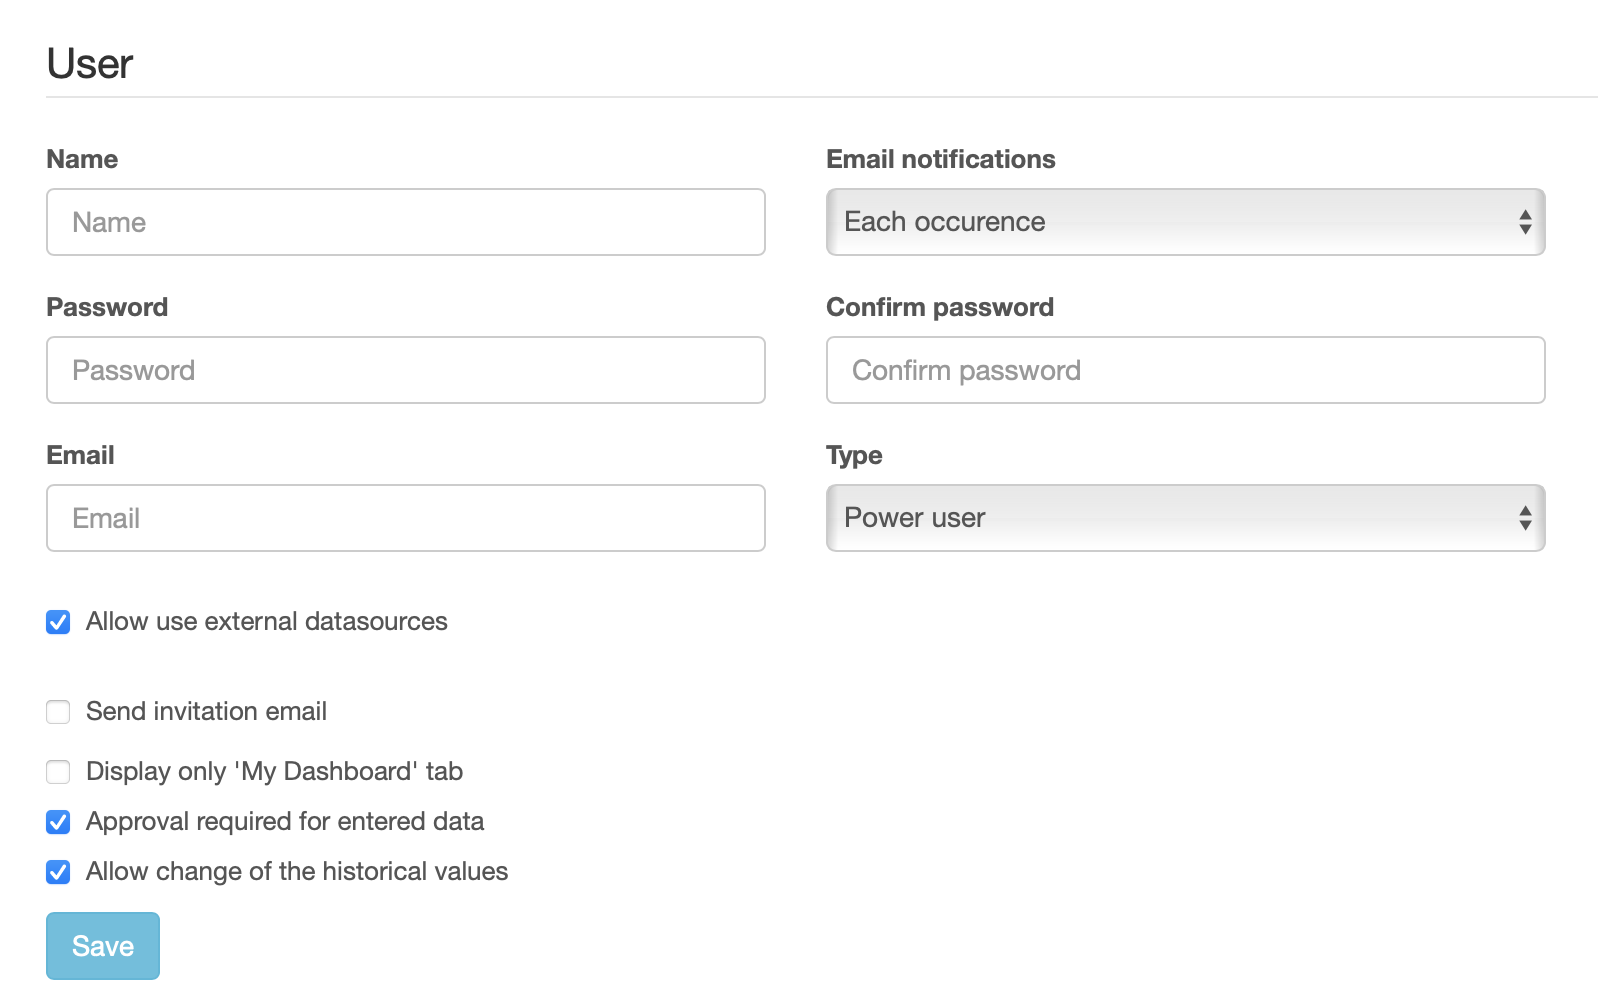
User Rights
An account administrator can adjust access rights of the users using additional options:
- Allow use external datasources (power users will be able to use existing datasources to create new SQL indicators)
- Restrict user rights to data input only (power user will be able to change the Value field of the indicator only)
- Approval required for entered data (new values entered by the user will need an approval by a power user)
- Allow change of the historical values (more settings available via > Settings > Workflow > Historical data)
Access rights can be further customized using Sharing function.
User Logs
Security regulations in some companies require the software to log the activity of all users. BSC Designer allows the administrator to turn logging function on:
- Go to the Users section
- Click the Audit trail button
- Click the Settings button
- Select events that you need to log and click Enable logs
- The logs will be displayed in the Logs section
Give Access Permissions to the Scorecards and KPIs
Share scorecards with your team. Give access to the selected groups, whole scorecards, or specific indicators.
Access Rights via Ownership
Users assigned as owners to goals, indicators, and initiatives are automatically granted access rights according to their user type.
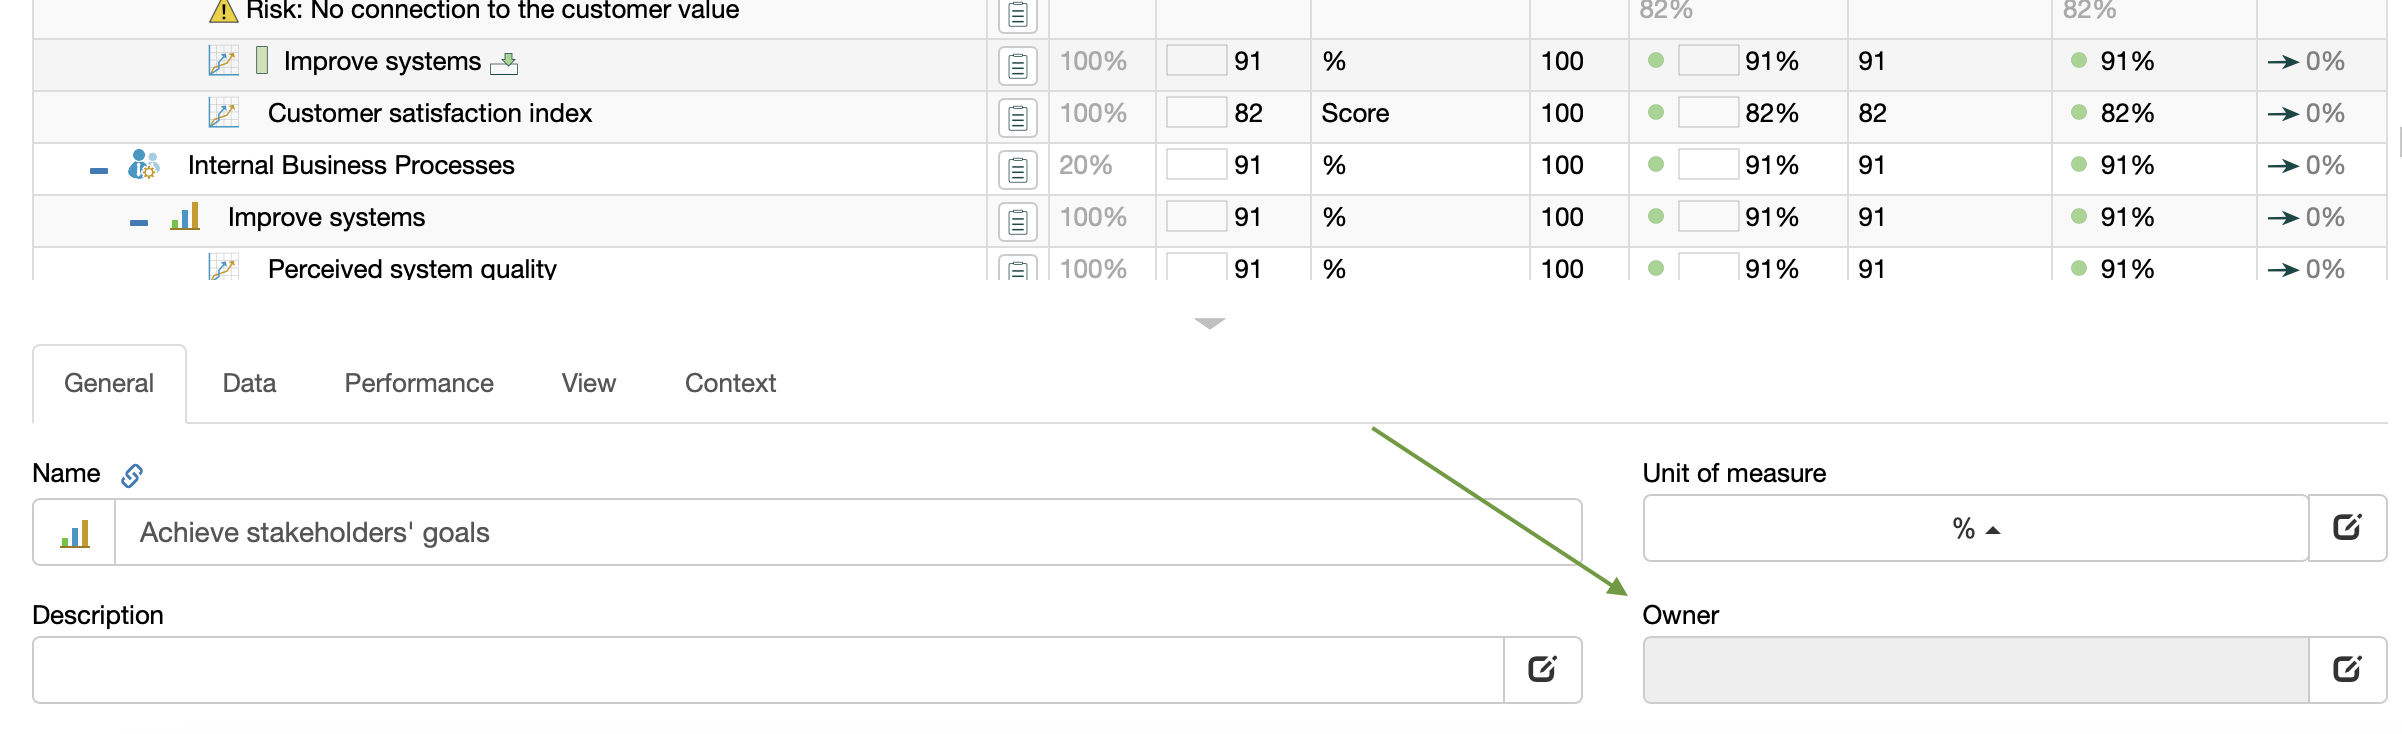
To assign an owner to a goal or indicator:
- Open any scorecard
- Select any goal or indicator, and switch to the General tab below
- Use the Owner control to assign an owner
To assign an owner to an initiative:
- Open any scorecard
- Open an existing initiative or create a new one
- Use the Owner control to assign an owner
Adding Access Rights
Follow these steps to give a user a new access rights.
- Go to the > Strategy Workspace > My Scorecards
- Select the group or the scorecard that you want to work with
- Click on the Share button on the toolbar:
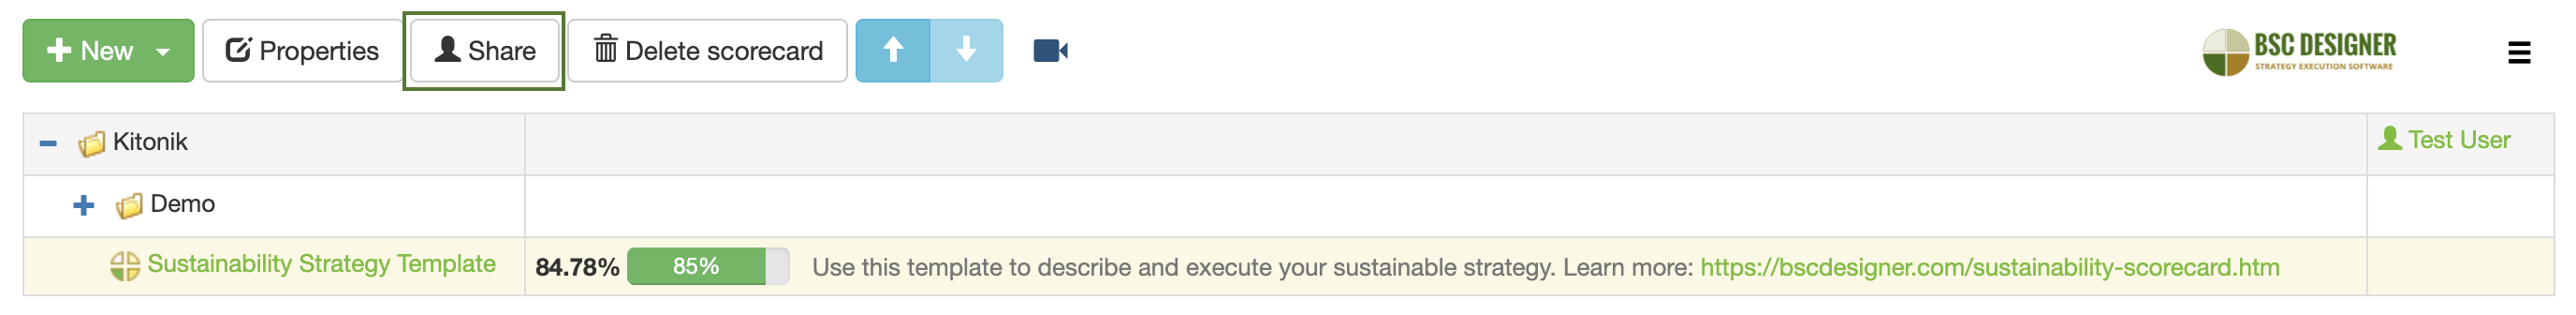
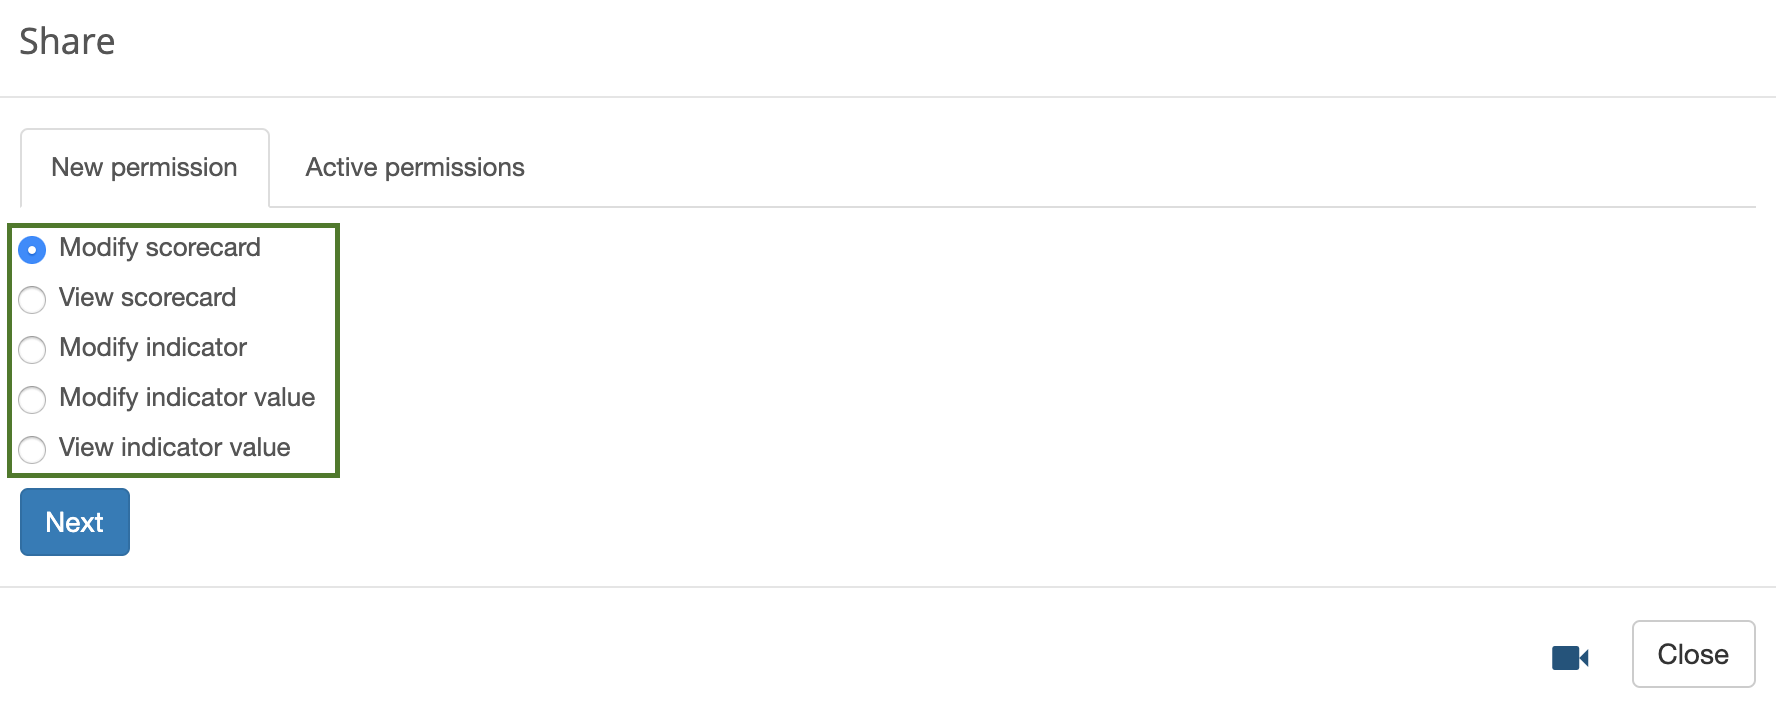
- On the Share page select the rights that you want to assign to the user and click on the Next button.
- Find the user that you want to work with. Next to the user's name find the type of access that you want to give to the user and click on the Grant button.
Users who have access to this scorecard will now see it in their account in an organizational structure.
Revoke Access Rights
To revoke access rights follow the steps 1-3 as described above.
- Go to the Active permissions tab
- Next to the user's name press the Revoke button
Public Access
With BSC Designer you can make a public scorecard. To give public access on the step 5 find Public user and give that user required rights.
Access by Email
In some cases you might want to give an access to the person who is registered with BSC Designer, but is not linked to your account. In this case on the step 5 use section Grant rights for email, and specify the email of the person.
Align Scorecards, Goals, Indicators or Initiatives in BSC Designer
Learn how to align or cascade strategies in practice. Connect goals and KPIs across various scorecards.
Learn more about the role of cascading in strategic planning.
To cascade a strategy in BSC Designer, use automatic and manual alignment.
Automatic Alignment by Perspectives
To align scorecards automatically:
- Go to the > Strategy Workspace > My Scorecards
- Drag and drop the Source scorecard to the Recipient scorecard
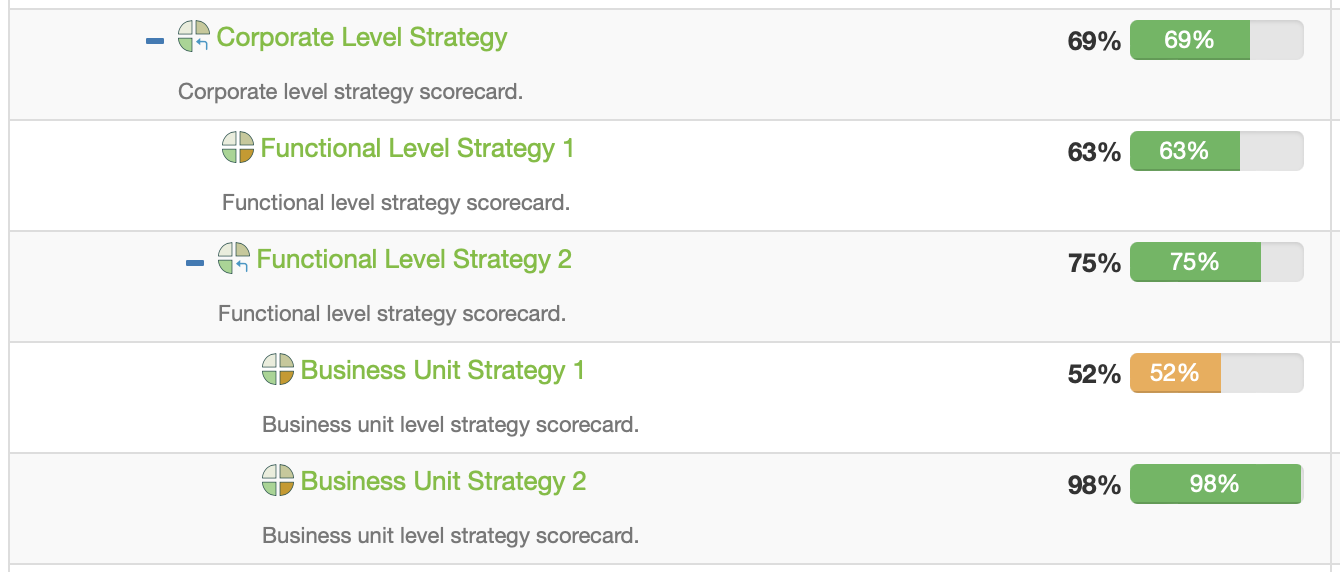
The software will match the perspectives in the scorecards by their names and align them automatically:
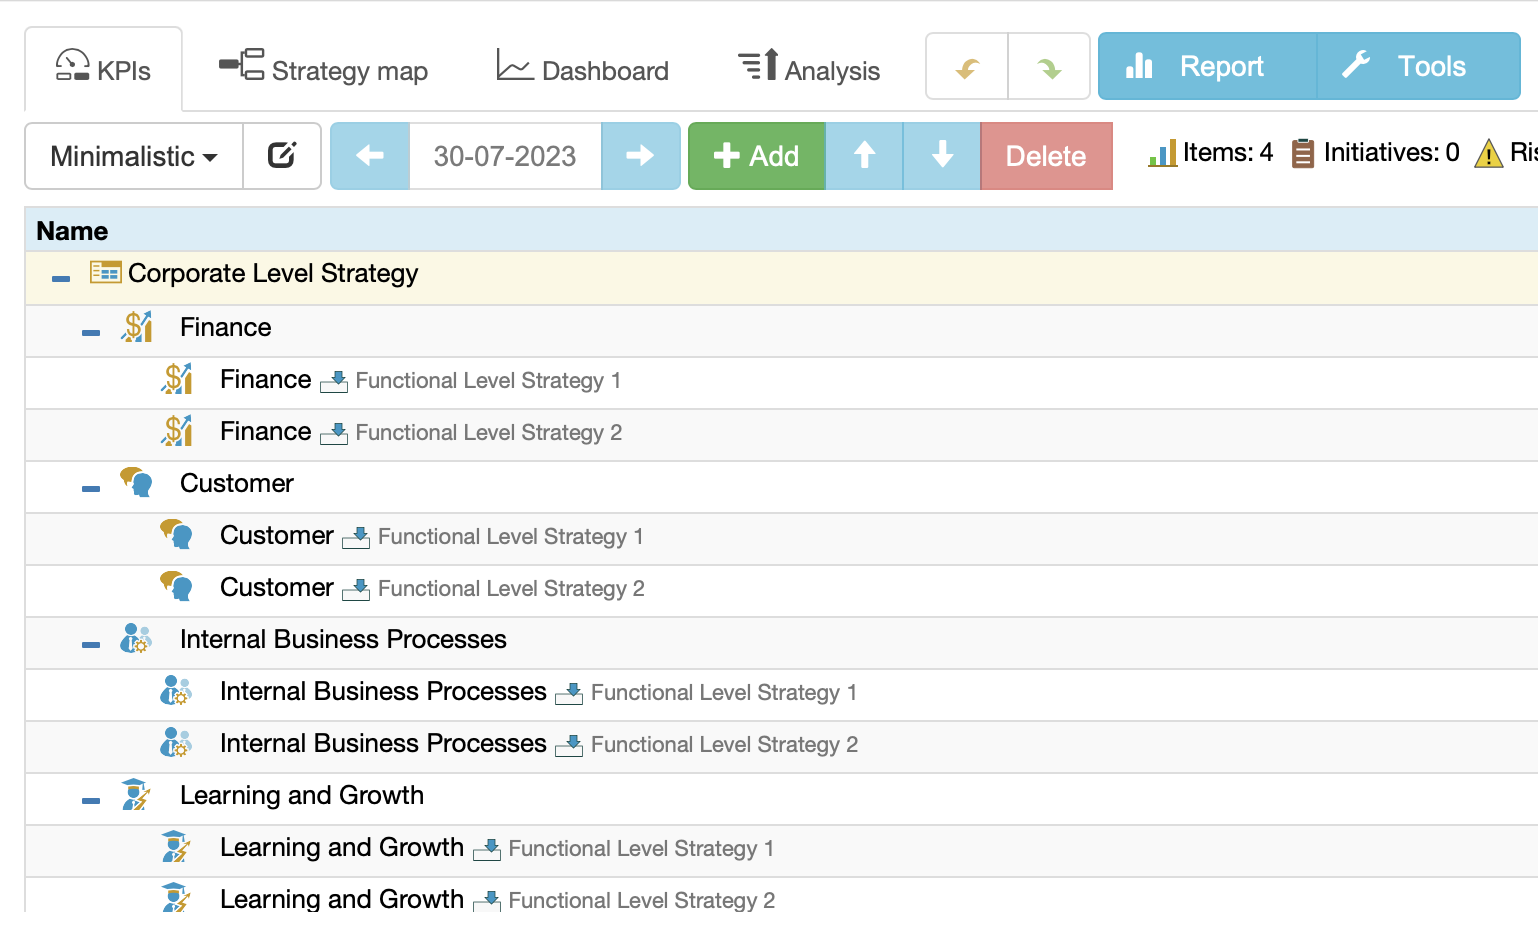
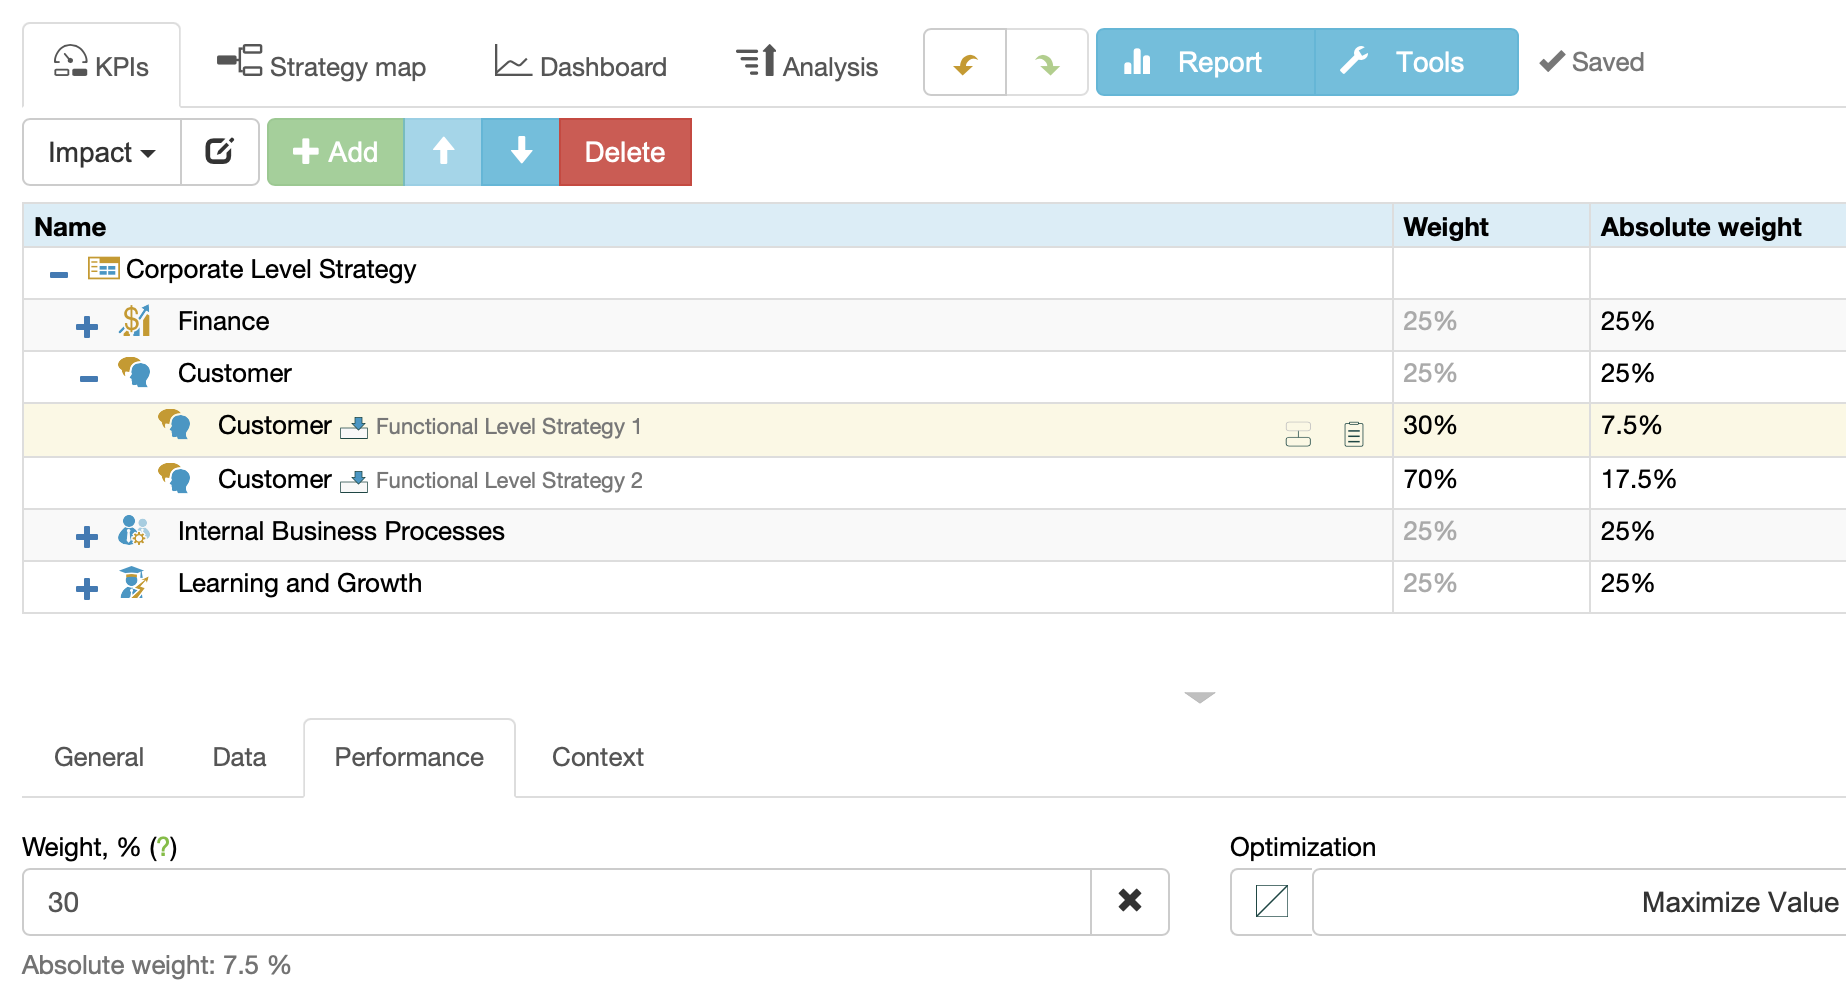
Use the Weight property on the Performance tab to show the different impact of the low-level scorecards on the high-level scorecard:
Manual Alignment by Goal / KPI
To align scorecards manually:
- Open the source scorecard, switch to the KPIs tab
- Select a source item and copy it (menu Tools > Copy Indicator)
- Open the recipient scorecard and select a recipient item
- Add connection (menu Tools > Paste Indicator)
- Click the Link by data or Link by context button
Another way to align the scorecards manually:
- Open the source scorecard, switch to the Strategy map tab
- Select a source item on the strategy map
- Click on the Export button on the toolbar:

- Select the recipient scorecard and item:
- Click the Link by data or Link by context button
The contextual connection will be displayed for both items on the Context tab.
Dependency Tree
To view the dependencies between cascaded scorecards:
- Select the previously imported indicator
- Switch to the Data tab
- Click on the Data source button next to the Value field:
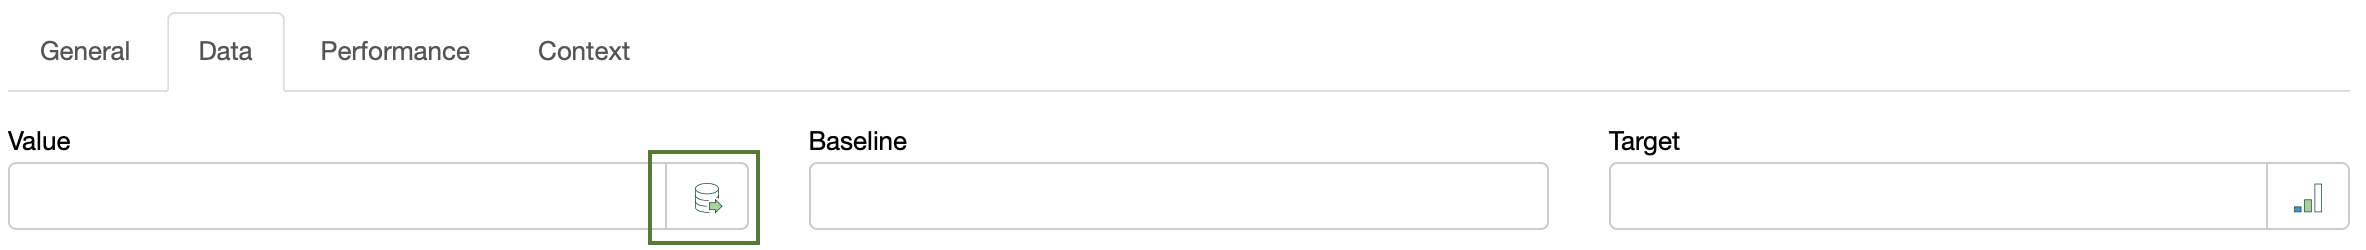
- The dependency tree will be displayed.
Managing Key Performance Indicators (KPIs) in BSC Designer
Create new KPIs, adjust their settings, input KPI data, specify measurement scale, and optimization function.
For more information about KPIs, check out this article.
Creating a New KPI
- Select an indicator that will be a container for a new KPI
- Use Add button
Manual Data Entry
To enter data manually follow these steps:
- Select or create any indicator
- If needed change an update interval
- Select appropriate date in the calendar
- Enter a new numeric value into the Value field
Alternatively, you can select any indicator and click onto the Values Editor button on the toolbar.
The Properties of an Indicator
Select any indicator in the list of KPIs. The software will display properties of the indicator below.
General Tab
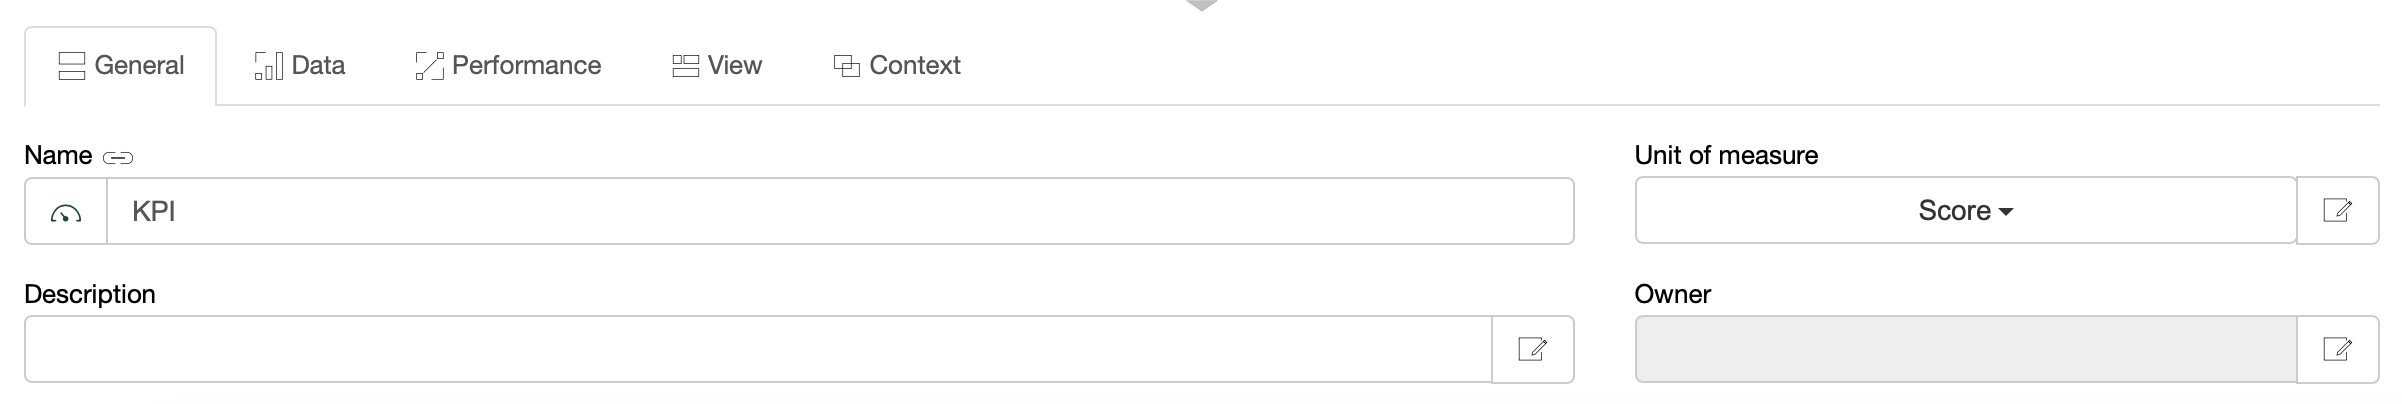
- Name. The name of the KPI. Try to keep it short and meaningful, don't overload it with details, and put the details into the description field.
- Icon. Next to the Name field there is KPI's icon. You can change it by clicking on the icon image.
- Description. The description field is for additional information about the KPI, such as information about the measurement method. Click on the Details button to provide more information using custom KPI files or by uploading relevant documents.
- Measure. Use this list to choose one of measurement units that is applicable to the KPI. If there is no measure that fits your needs click the button on the right from the Measure drop list to add a new measure.
- Owner. The users responsible for this business goal or indicator.
Data Tab
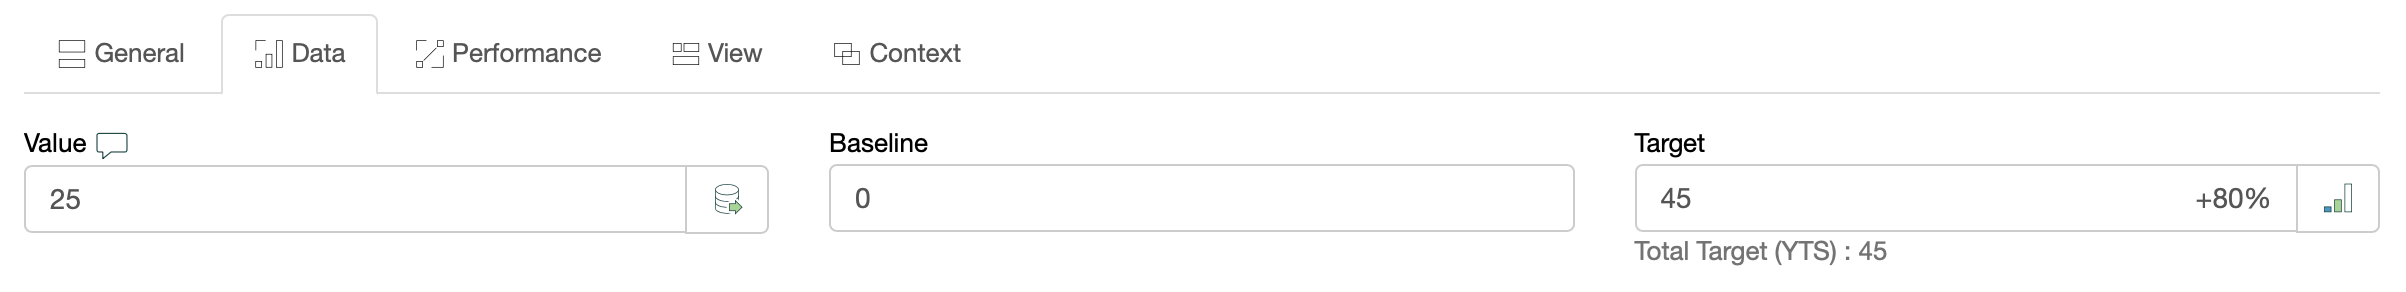
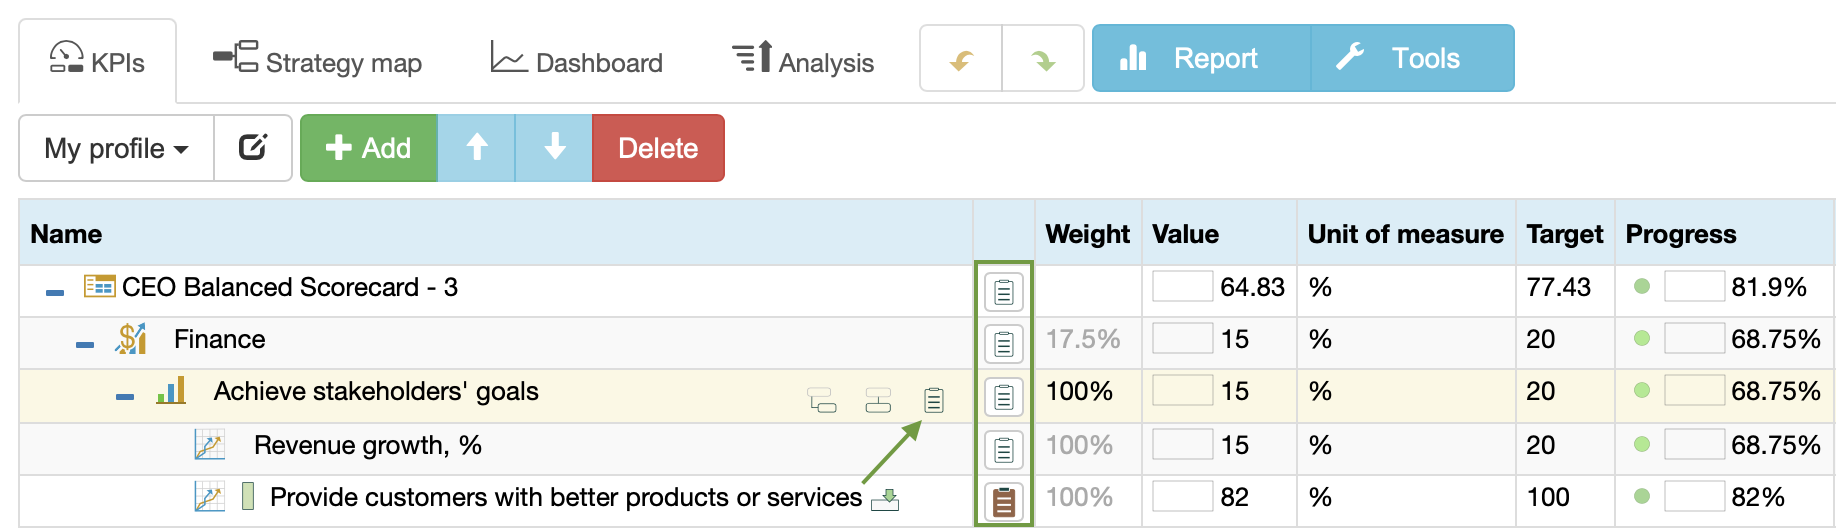
- Value. The value field displays the current value of the KPI for the date selected in the calendar. The button next to the "Value" field allows to create indicators with custom formulas.
- Max and Min values determine the minimum and maximum possible range for a value. Whereas baseline and target values show your working interval. Normally a baseline is a starting value and the target is a value that you wish to achieve.
- Simple input mode. For some indicators the Baseline is always equal to Min value and the Target is always equal to Max value. Check this checkbox and the software will show only the baseline and target fields.
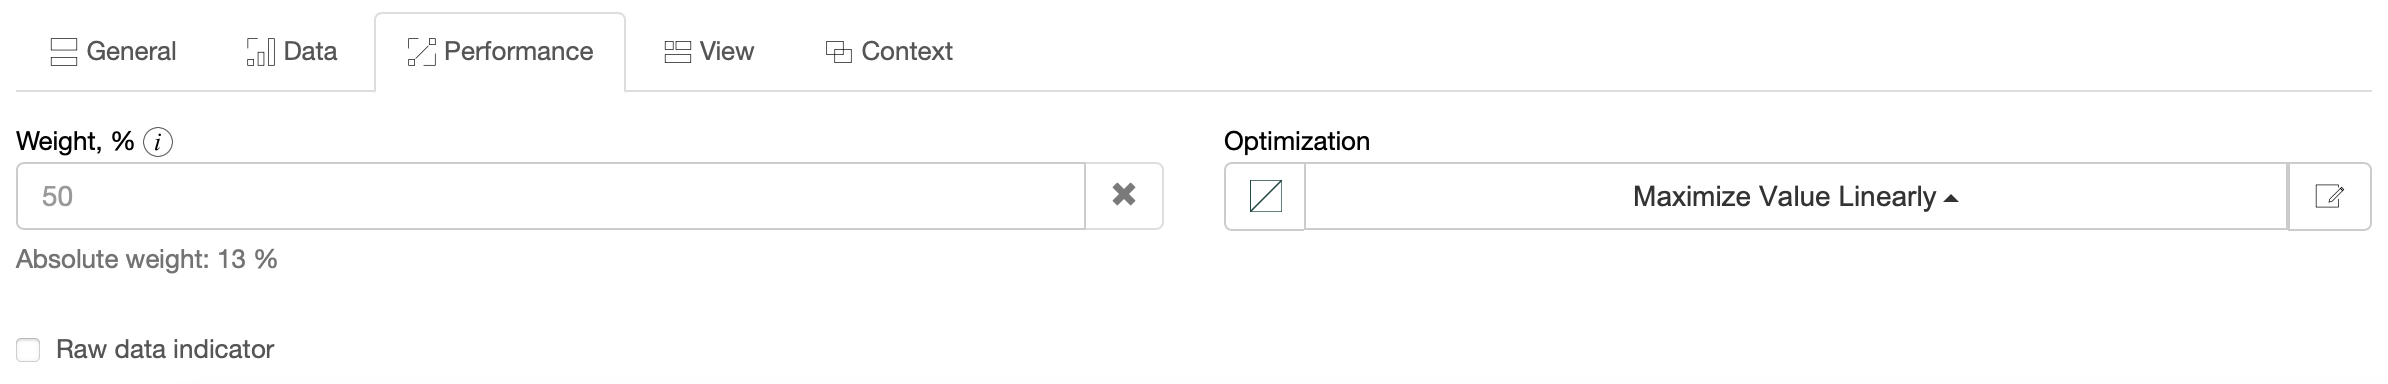
- Weight, %. The relative weight of the indicator shows how this indicator is important compared to other indicators in the same container. The absolute weight shows how this indicator is important compared to all indicators in the scorecard. The weight is taken into account when the performance of the container is calculated. Learn more about indicator's weight.
- Optimization. What do you want to do with the value of a KPI? Would you like to minimize it (for example like a turnover of employees in a company) or you'd like to maximize it (for example profit value). Choose the appropriate optimization. If the dependency is not as simple as just a line function, you can enter a custom formula into BSC Designer that the program will use to calculate your performance and progress. To do this, click on the Edit button next to the Optimization drop list.
- Raw data indicator. Some indicators on the scorecard are just data storages that are not supposed to have a performance or progress. Check this checkbox and BSC Designer won't take this indicator into account when calculating the performance of the scorecard.
View Tab
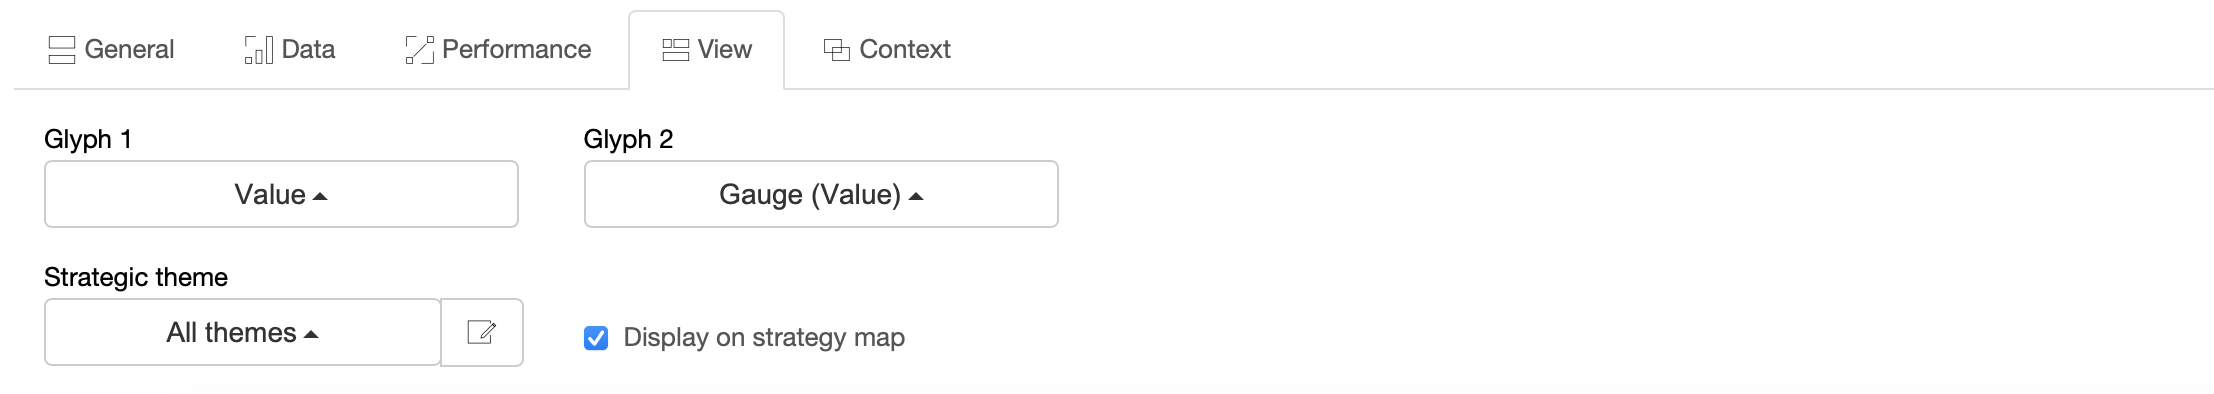
- Glyph 1 and Glyph 2. Glyph settings for the indicator on the strategy map.
- Strategic theme. Select a strategic theme for the item.
- Display on strategy map. Defines whether this item should be displayed on a strategy map.
Context Tab
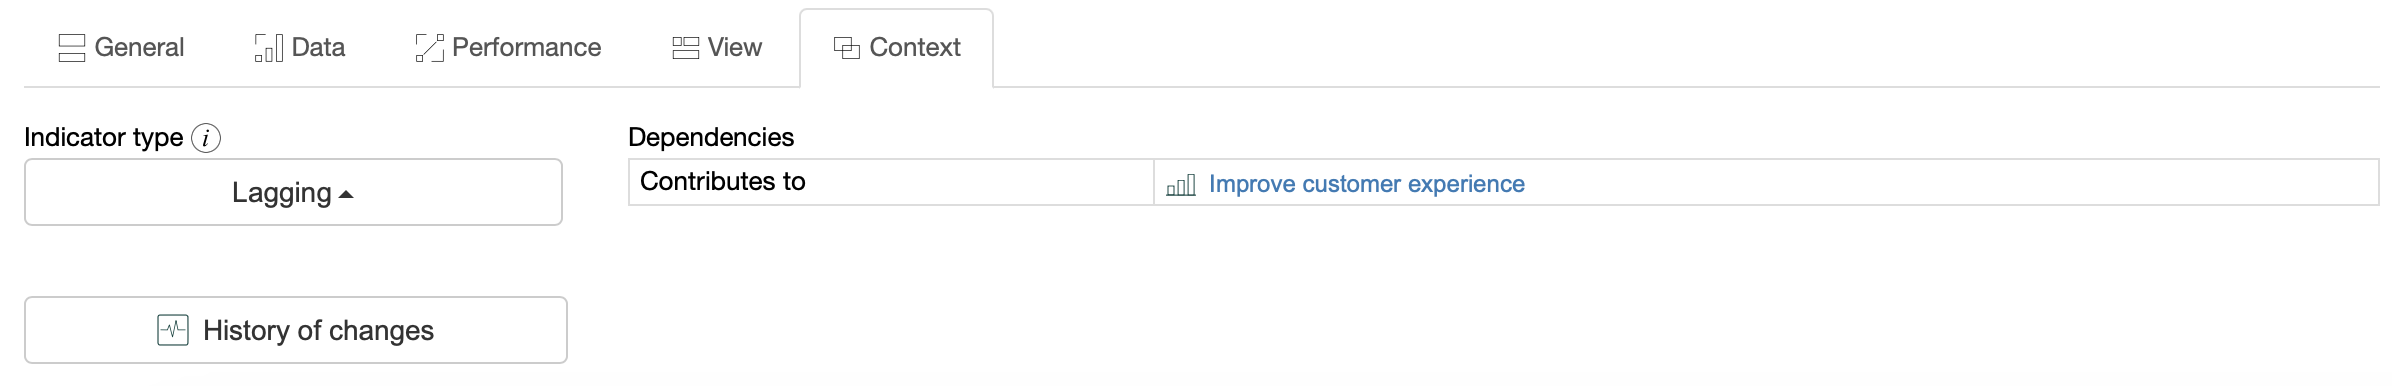
- Indicator type. The type of indicator is defined in the context of its container. Lagging indicators contribute to the calculation of higher level items.
Leading indicators are used for local calculations only.
- History of changes. Detailed change log for the item.
- Dependencies. The items that affect or are affected by the selected item.
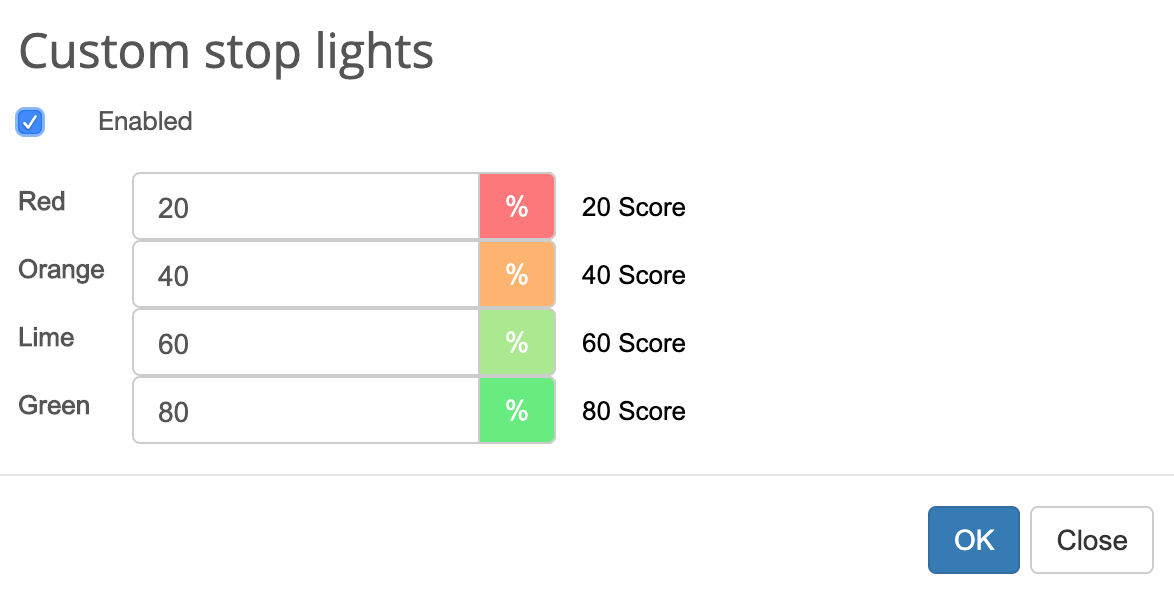
Stop-Lights
Stop-lights are cycles of different colors that are displayed next to the performance and progress values.
The stop-lights help to quickly identify the state of the indicators.
Stop-light colors can be customized for an indicator:
- Open a scorecard in BSC Designer
- Go to the KPIs tab and select an indicator
- Select Stop-lights settings in Tools menu
- Enter new values for the stop-lights, check the Enabled checkbox and click OK:
Goals and Their Attributes as Containers for Indicators in BSC Designer
Create business goals (or containers for the KPIs), adjust their settings, quantify them with leading and lagging indicators.
Creating Goal
To create a goal:
- Select an indicator and create a new indicator inside using the Add button on the toolbar. The selected indicator will become a goal.
- Drag and drop to place any existing indicator into another indicator, and the target indicator will become a goal.
Goal Settings as Containers
Choose any goal to display its properties. Most of the settings will be exactly the same as for the KPI, but there are two properties specific for a goal:
- Performance - use this property to tell the software how the "Performance" of the goal should be calculated.
- Value - use this property to tell the software how the "Value" of the goal should be calculated.
The following options are available for the "Performance:"
- Weighted average - the performance of the goal will be calculated as an average of the performance values of the contained KPIs taking into account their weight.
- Average - the performance of the goal will be calculated as an average of the performance values of the contained KPIs
- Max, Min - the software will find the max (or min) performance of the contained KPIs and will use it for the performance of the container
- Sum - the performance of the goal will be calculated as a sum of the performance values of the contained KPIs
- Self-standing - the performance values of the contained indicators won't be taken into account; the performance of the goal will be calculated using its own value, min, and max values
The following options are available for the "Value":
- Weighted average - the value of the goal will be calculated as an average of the values of the contained KPIs taking into account their weight.
- Average - the value of the goal will be calculated as an average of the values of the contained KPIs
- Max, Min - the software will find the max (or min) value of the contained KPIs and will use it for the value of the goal
- Sum - the value of the goal will be calculated as a sum of the values of the contained KPIs
- Self-standing - the values of the contained indicators won't be taken into account; the value of the goal will be entered manually by user
- Performance - the software will use the performance of the goal for its value field
Manage Initiatives - Action Plans for the KPIs and Goals
Learn how to align initiatives (action plans), persons responsible, budgets with KPIs and business goals in BSC Designer.
Initiatives
In the list of KPIs, there is a column Initiatives. Click on the button in this column to access initiatives for the KPI.
Learn more about the role of the initiatives in strategic planning.
Initiatives have the following properties:
- Name of the initiative.
- Description of the initiative.
- Document list with the links to the detailed action plans.
- Owner of the initiative.
- Type of the item, such as "initiative", "success factor", "expected outcome", "rationale", or "hypothesis."
Process-related properties:
- Status of the initiative (statuses can be configured on the Workflow tab in the account Settings).
- Aligned KPI that indicates the progress of the initiative.
- Timeline for the initiative (is used on dashboard charts).
Dependencies:
- Depends on and Contributes to define the dependency between initiatives (used on the Gantt charts).
- Context defines the contextual relationships of the initiative. Use the Add button to link the initiative by context with another initiative, goal, or indicator.
- Documents section allows uploading strategy-related documents and linking to external resources.
Budget properties:
- Budget assigned to the initiative.
- Currency of the budget (currencies can be configured on the Organization > Currencies tab in the account Settings).
- Actual expense.
- Variance (the difference) between the budget and the actual.
- Duration of the initiative.
If an initiative has budget and progress information, the software will show:
- Earned Value = Total Budget * Progress, %
- Cost Variance = Earned Value - Budget Actual
Ensure Data Consistency for KPIs Managed in BSC Designer
Use advanced functions for KPIs: specify update interval, define values grouping, change value inheritance and stop-lights properties.
Update Interval
For any KPI on the scorecard an update interval can be adjusted:
- Select a KPI
- Click Values Editor
- Find Update interval type settings
- Select required update interval and click Close
Change the update interval that the software uses by default for the new indicators via menu Tools > Options > Default update interval.
Value Inheritance
Value inheritance defines whether the software will use previous values for the dates without data, or if it will use only specifically entered values.
To adjust inheritance settings:
- Select an indicator
- Click onto the Values Editor button on the toolbar
- Use the Values inheritance option
Update default inheritance via Tools > Options > Default value inheritance.
Data Grouping
When displaying data aggregated by time periods, the software uses the grouping setting for an indicator. To define data grouping:
- Select an indicator
- Click onto the Values Editor button on the toolbar
- Use the Group by drop list
To calculate a KPI using other KPIs:
- Select a KPI
- Switch to the Data tab, click on the Data source button:
- Select
 Formula as a data source
The Formula dialog will be displayed:
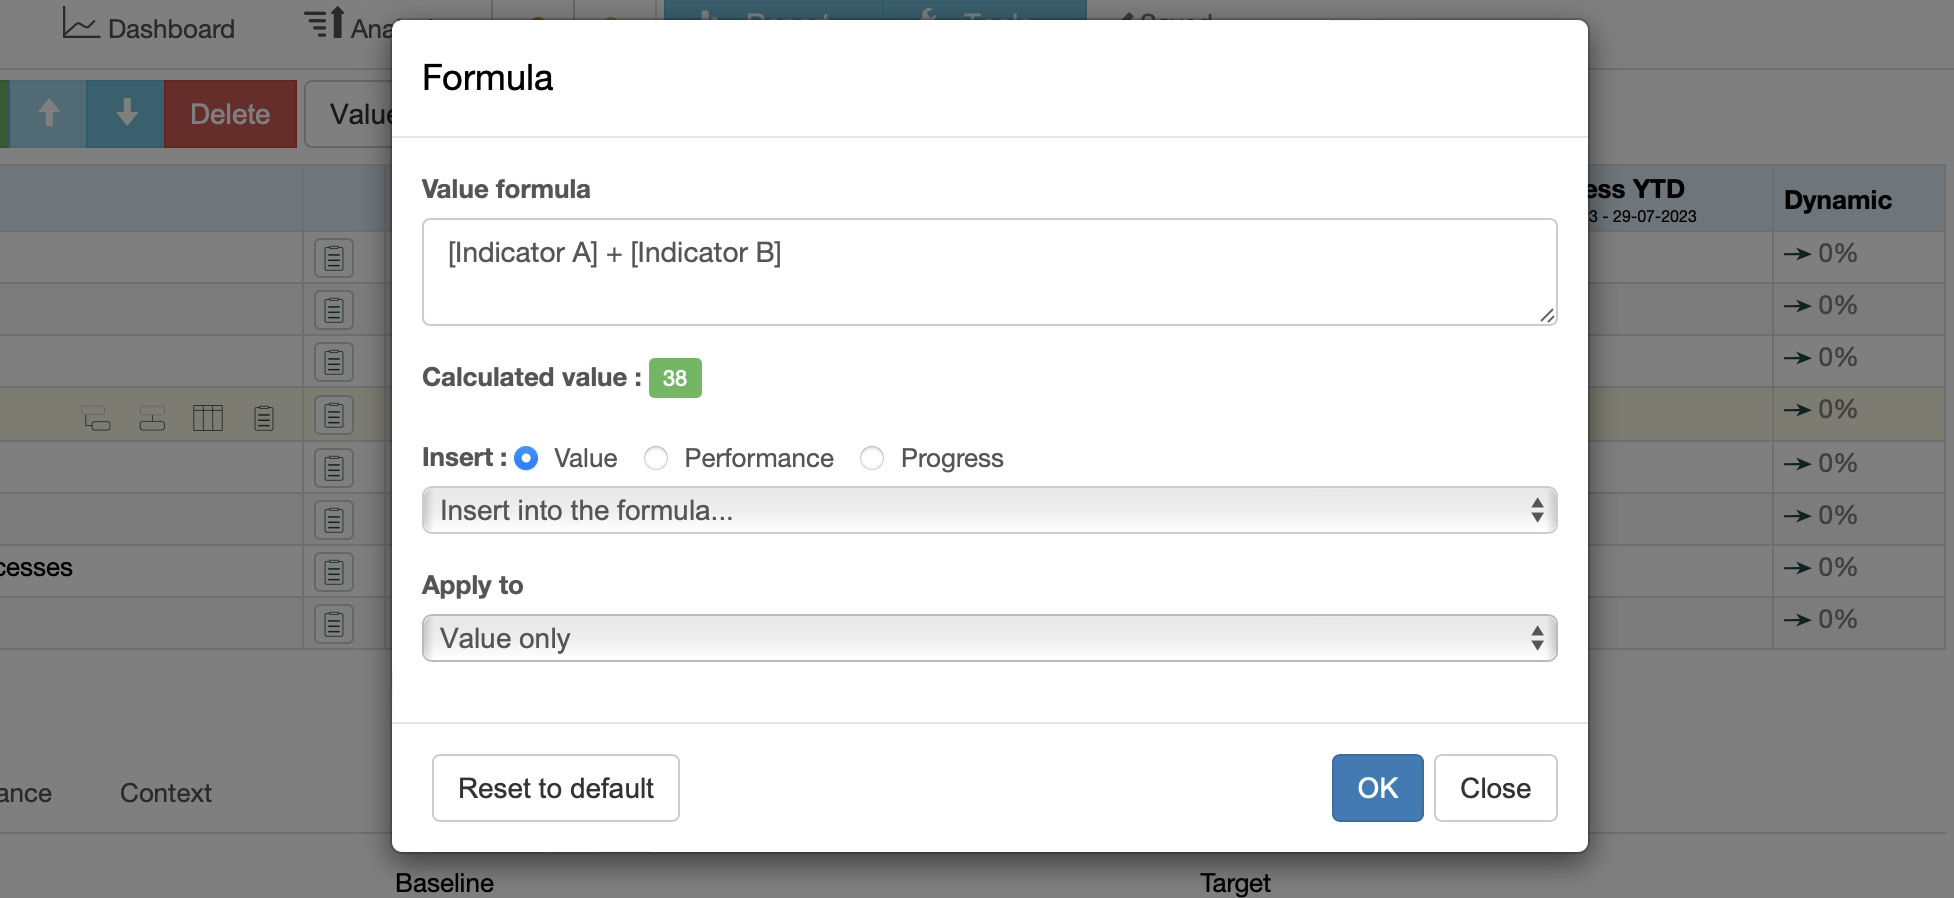
Use Insert controls to add a KPI to the formula:
- Select if the software should use the KPI's value, progress, or performance.
- Select a KPI in the list to add it to the formula.
Apply to option defines how the formula will be applied:
- All applies the formula to all numerical properties of the indicator.
- Value only applies the results to the value of the indicator. The user can enter the target manually.
- Target only applies the results to the target of the indicator. The user can enter the current value manually.
Use [.] to search for an indicator inside the current item; use [..] to search for an indicator inside the parent item.
Import Data into the Scorecard from Excel Spreadsheet
Learn how to import the performance data for KPIs into a scorecard. Learn to use importing profiles.
Step-by-Step Guide for Importing
- Go to your account in BSC Designer. Open a scorecard where you want to import some data.
- Go to the KPIs tab.
- Click on the Tools menu, select Import Data option.
- Select Import from MS Excel document. Optional: reuse previously saved import profiles from the Load settings from profile: drop list.
- Click the Next button.
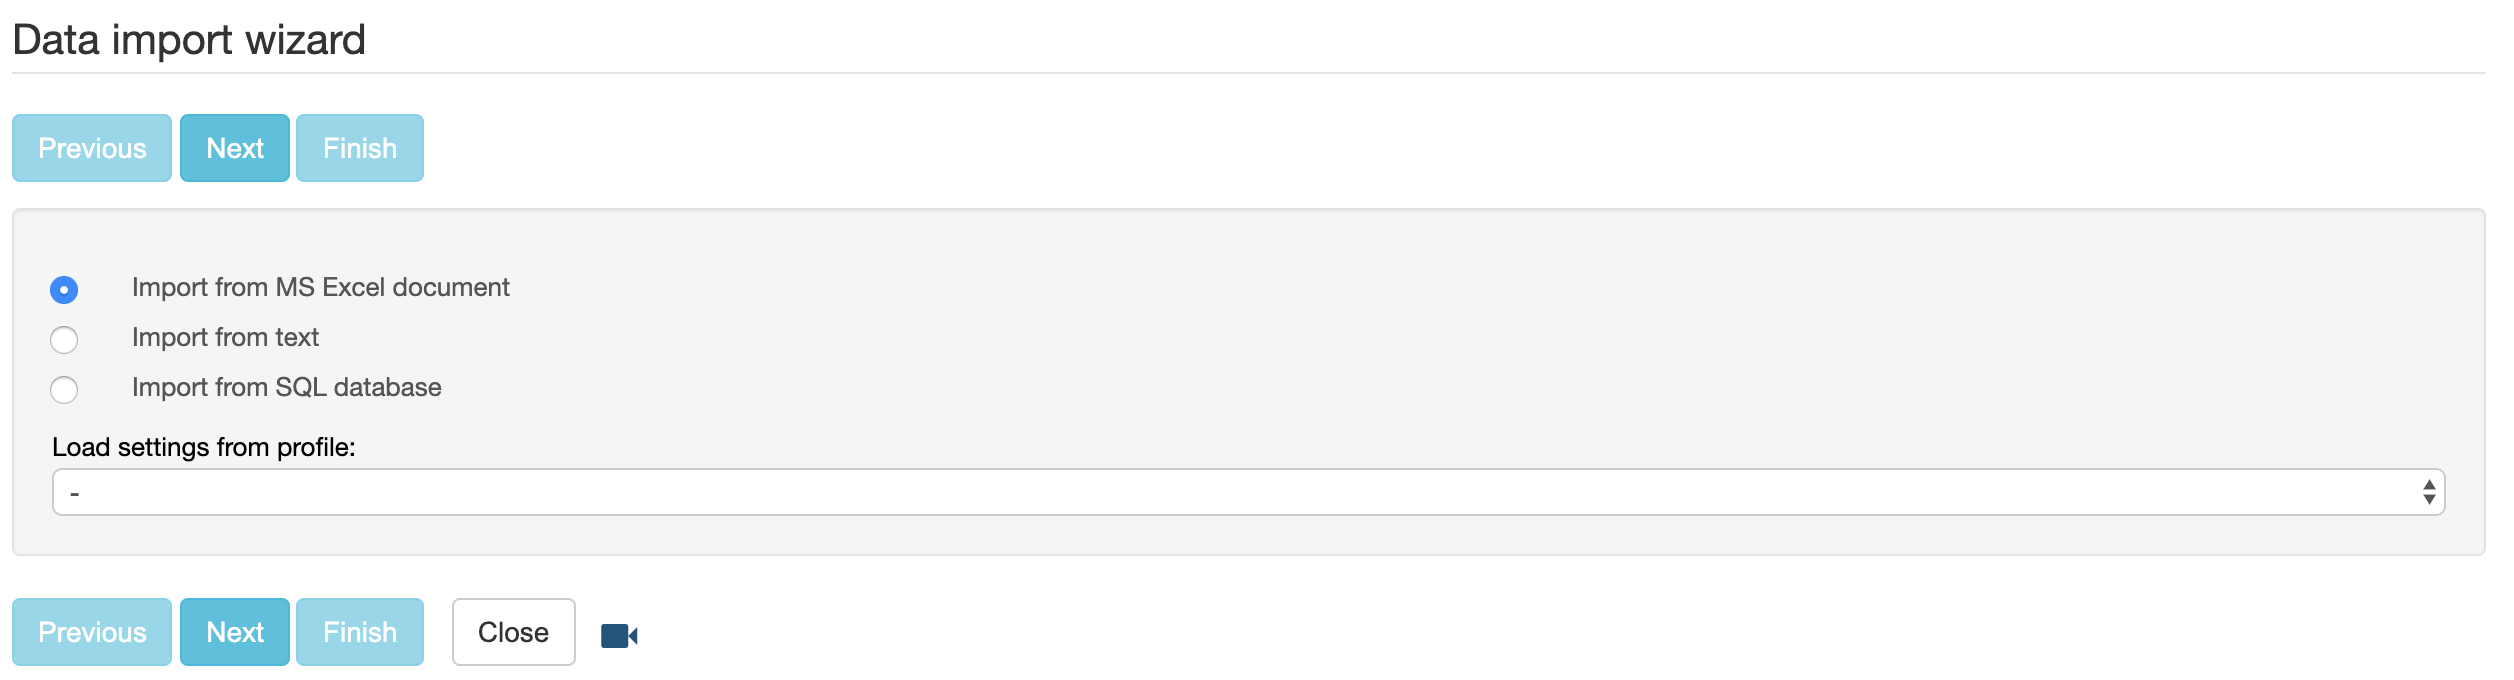
- Upload MS Excel file. You can use this example Excel project.
- BSC Designer reads the file and shows the list of available spreadsheets. Choose a spreadsheet from the list and click the Next button.
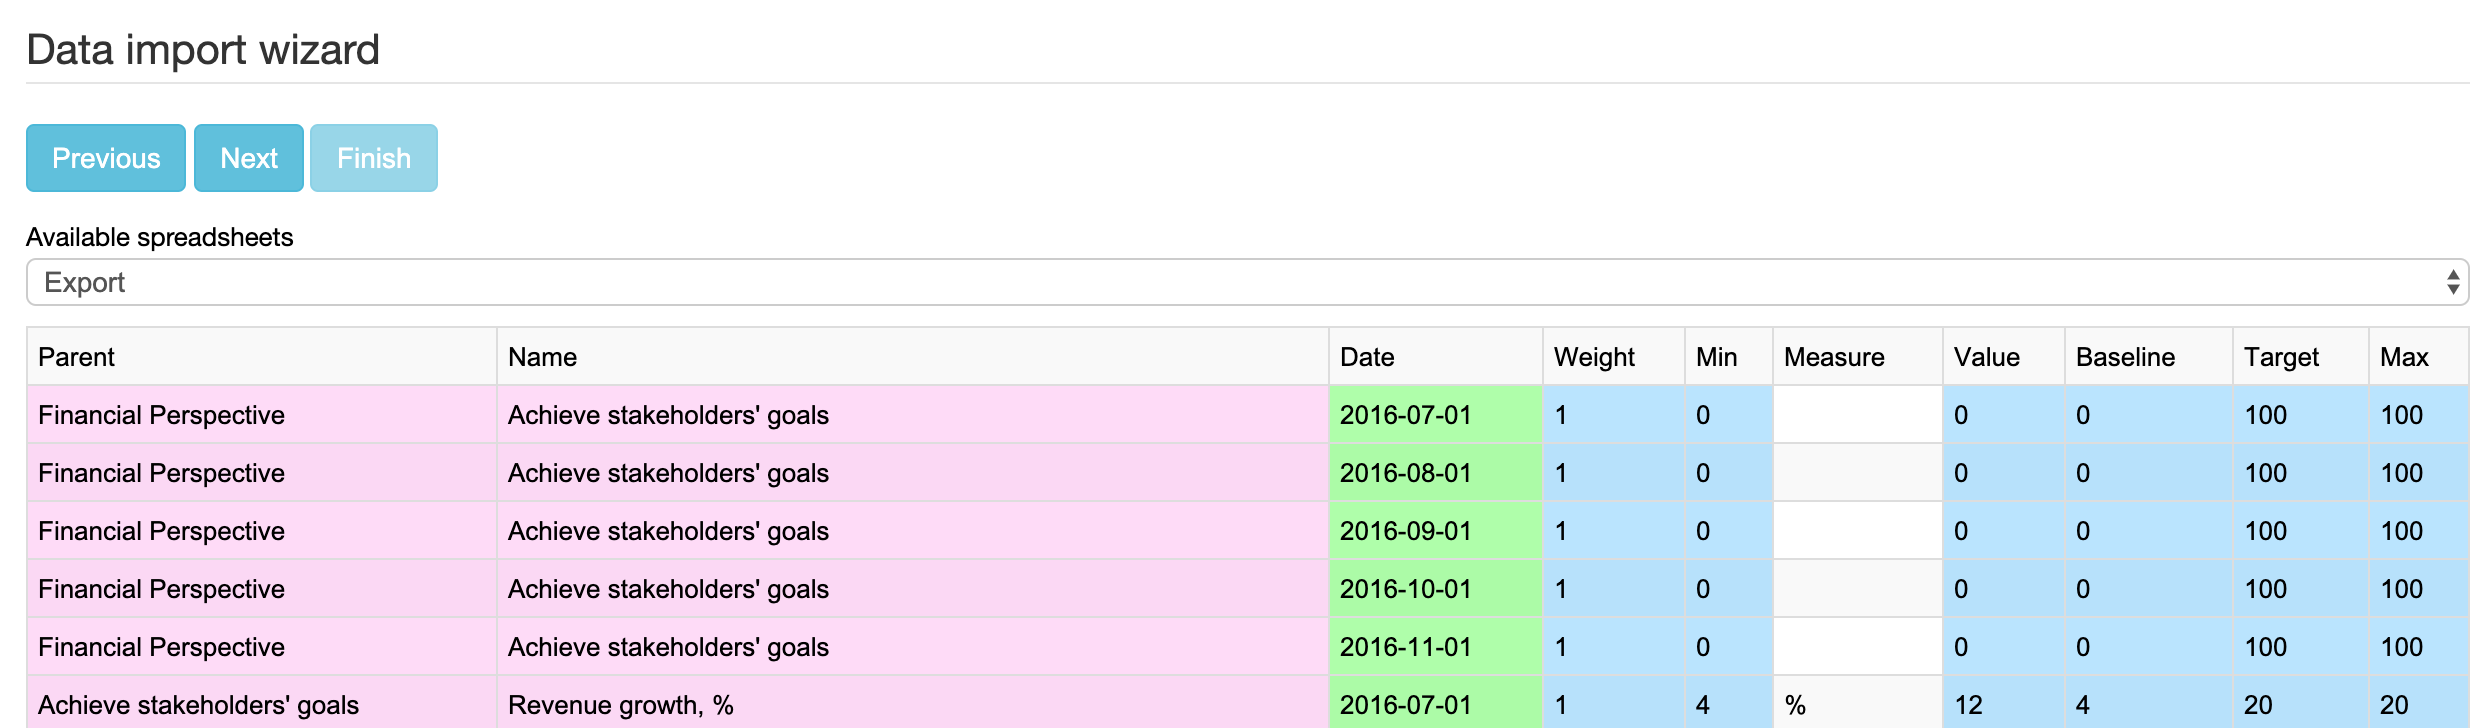
- On the next step mark the column that contains values, the column that contains dates, the column that contains target values (if any), and so on.
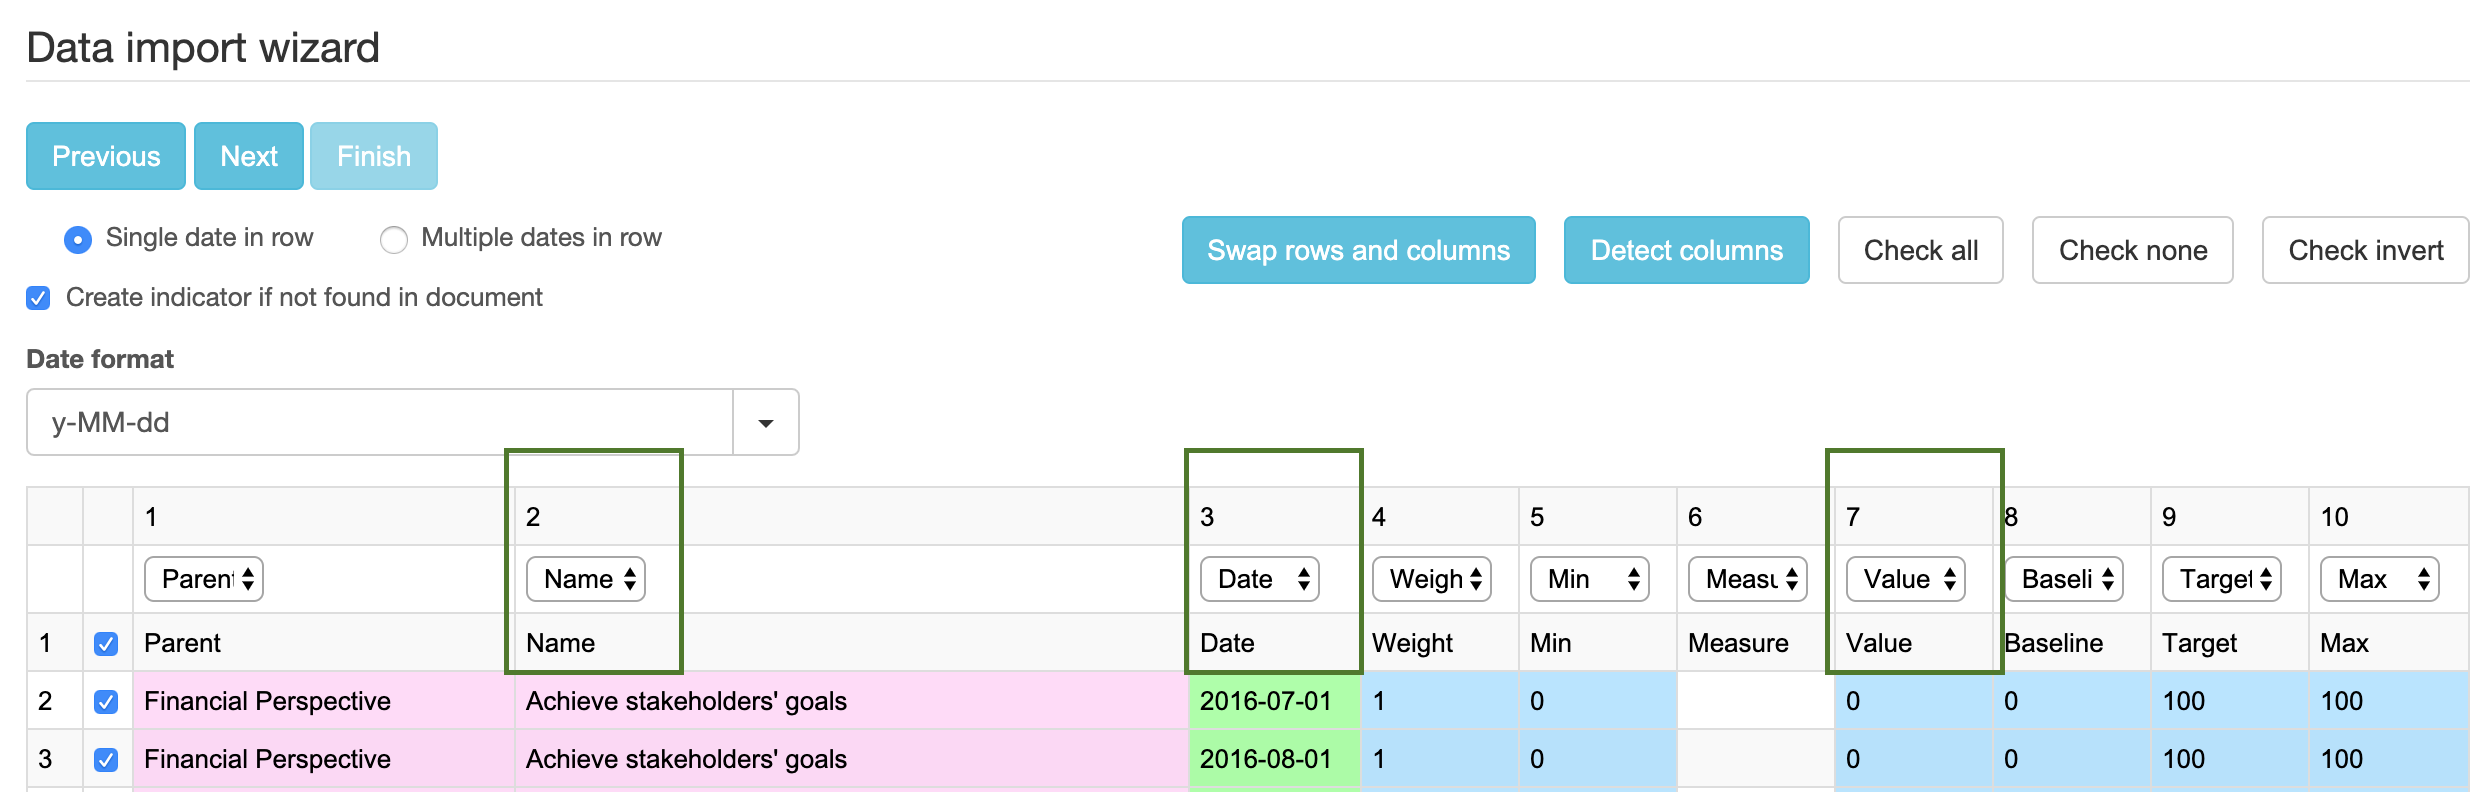
- Click the Next button to preview the results.
- To reuse this import profile later check the Save settings as ... check box. Click the Finish button to finalize data import.
Troubleshooting
- Date is not recognized. Dates might be represented in PC using different formats like yyyy-MM-dd (2016-10-23) or dd MMM yy (23 Oct 16). BSC Designer is able to recognize most formats, but sometimes you might need to specify date format manually. To do this use the "Date format" drop list. Use one of predefined formats; advanced users might want to define their own format (format guidance).
- I'm using import profile and the data is not correct. Most likely you have updated the structure of your Excel Spreadsheet, so BSC Designer cannot recognize columns and rows according to the information saved in a profile. Do a manual import once again and create a new import profile.
- I see data on preview step but I don't see it on KPIs tab. If the data was displayed correctly on the "preview" step it means that BSC Designer has recognized the data and its formats. Make sure that when you are searching for the data on KPIs tab and that you choose a correct KPI and a correct date in the calendar.
Use SQL Database as a Data Source for the Indicators
Use an external database as a data source for your KPIs. Setup SQL Indicators to access remote database.
Create a Datasource
- Click > Settings > Integrations tab
- In the Datasources section click Add to add a new datasource
Setup SQL Indicator
- Open a scorecard, go to the KPIs tab
- Select an indicator that will be a recipient of data
- Switch to the Data tab, click on the Data source button next to the Value field
- Click on the SQL Query button
- Formulate required SQL query (see some examples below).
- Click on the Next button to preview the results. Click on the Finish button.
Examples:
Examples of SQL Queries
BSC Designer expects to receive one value as a response to the SQL query. The received data will be used for the Value field of the indicator.
Supported parameters:
- %%UpdatePeriodStart%% and %%UpdatePeriodEnd%% - respective starting date of the update interval and ending date
- %%ItemName%% - the name of the KPI as specified in the Name field
- %%date%% - current date selected in the calendar in BSC Designer
Case 1: Indicator is updated daily. There is one value for each date.
select value from datatable where date = %%date%%
Case 2 (most used): Indicator is updated monthly. There are several values for this period in the database that need to be summarized.
select sum(value) from datatable where date between %%UpdatePeriodStart%% and %%UpdatePeriodEnd%%
Right to Create SQL Indicators
By default, power users don't have a right to create new SQL indicators. To grant this right:
- Go to the > Users section
- Click the Edit button for a user
- Use the Allow use external datasources checkbox
- Press Save button
Updating Data
There are several ways to update data for SQL indicators:
- Click on any date in the calendar - BSC Designer will try to read data for that day.
- Manual update - if you need to refresh data for certain date, use Refresh imported option in Tools menu
- Specify update interval - specify an update interval for an indicator. BSC Designer will update SQL indicator automatically using specified schedule.
Use External Data Sources for KPIs
Learn how to automate data input from third-party business tools to KPIs in BSC Designer with Google Sheet Add-ons and RESTFull API.
General Information
An account provides 100 API calls per hour per power user. To update KPIs automatically, use one of these methods:
- BSC Designer Sync. A Google Sheets Add-on, suitable for writing data to KPIs, no programming required.
- RESTFull API. Programming interface with API calls, suitable for reading and writing data to KPIs, programming required.
Connect KPIs to Data Sources via Add-Ons
Use Google Sheets Add-ons to obtain information from external data sources, aggregate data, and update KPIs with aggregated data automatically.
- Create Google Sheets document.
- Select the menu Extensions > Add-ons > Get add-ons.
- Install and configure one of the add-ons for a third-party data source.
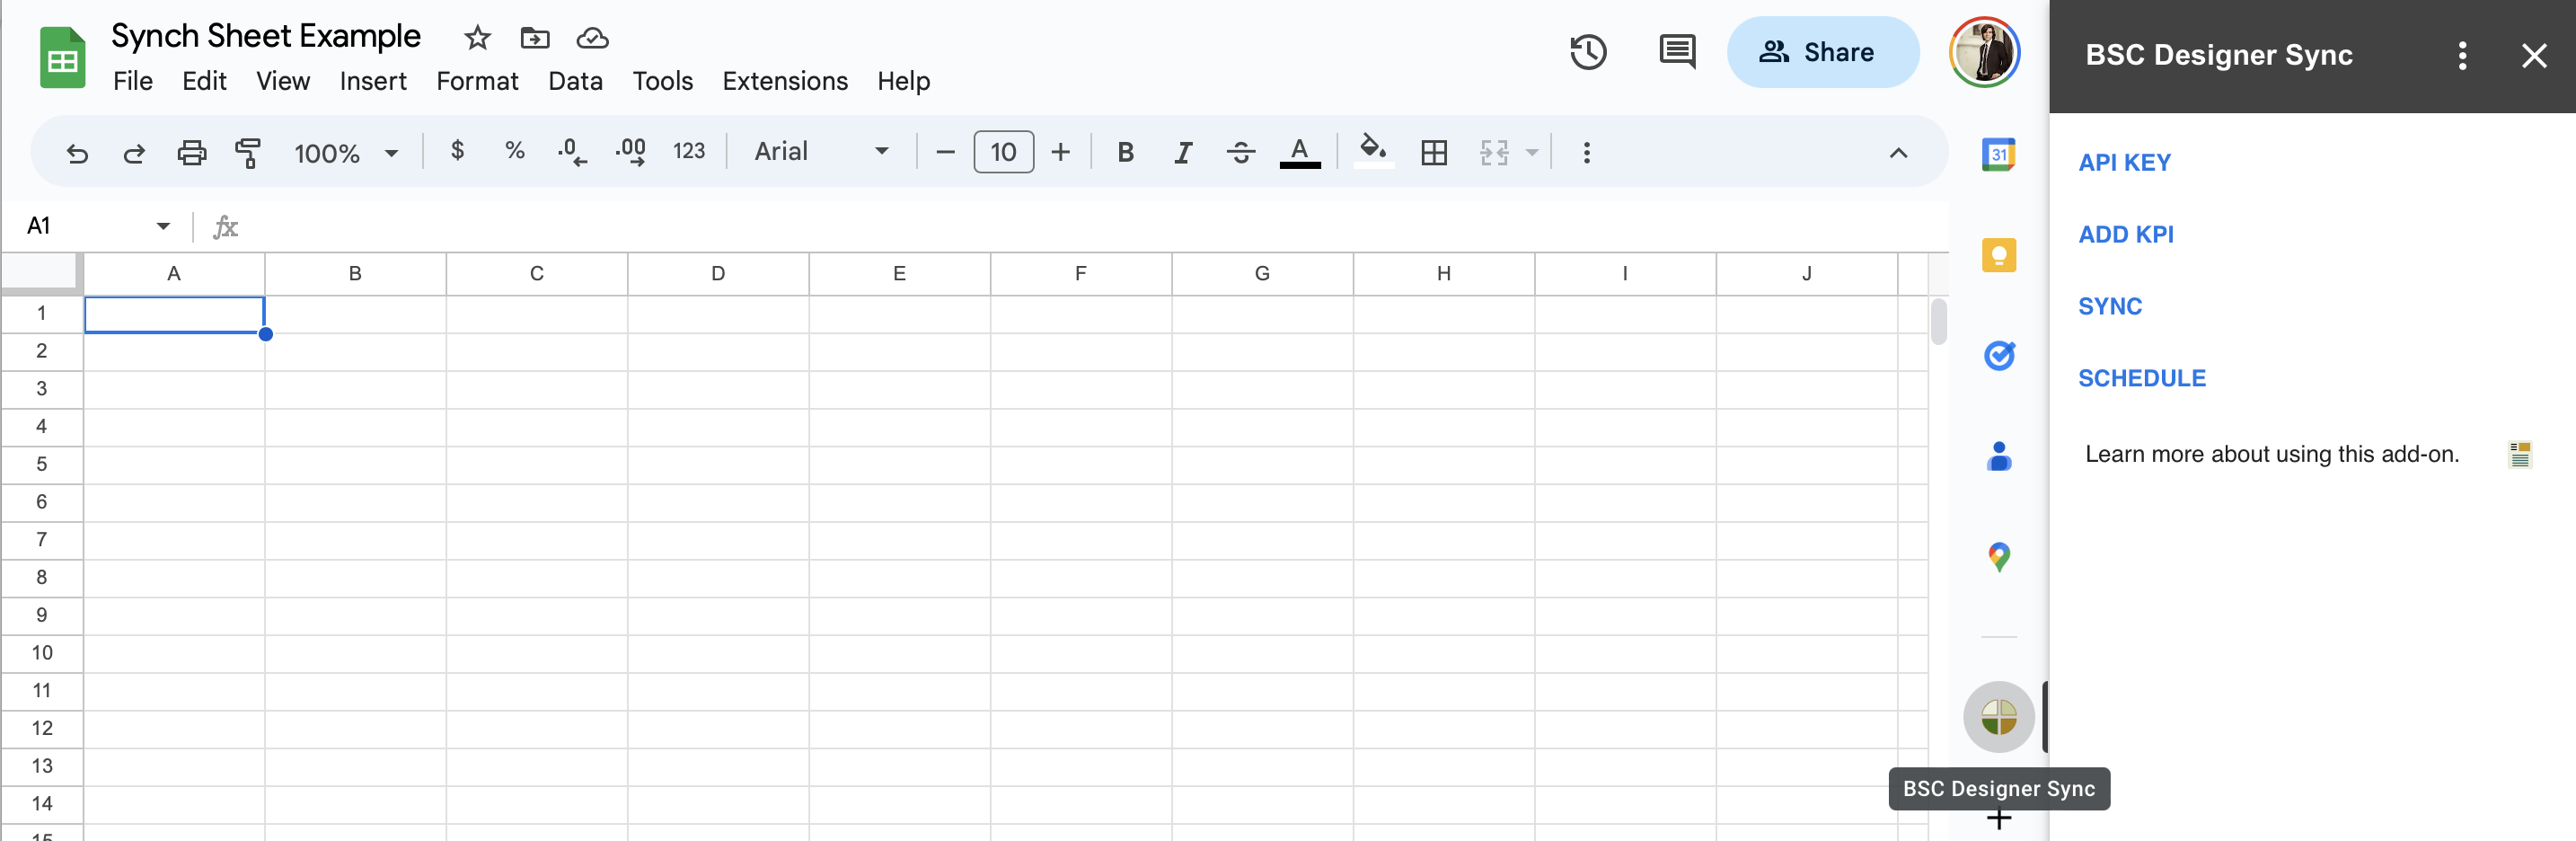
- Install add-on called BSC Designer Sync (will appear on the right toolbar).
 BSC Designer Sync's use and transfer to any other app of information received from Google APIs will adhere to Google API Services User Data Policy, including the Limited Use requirements.
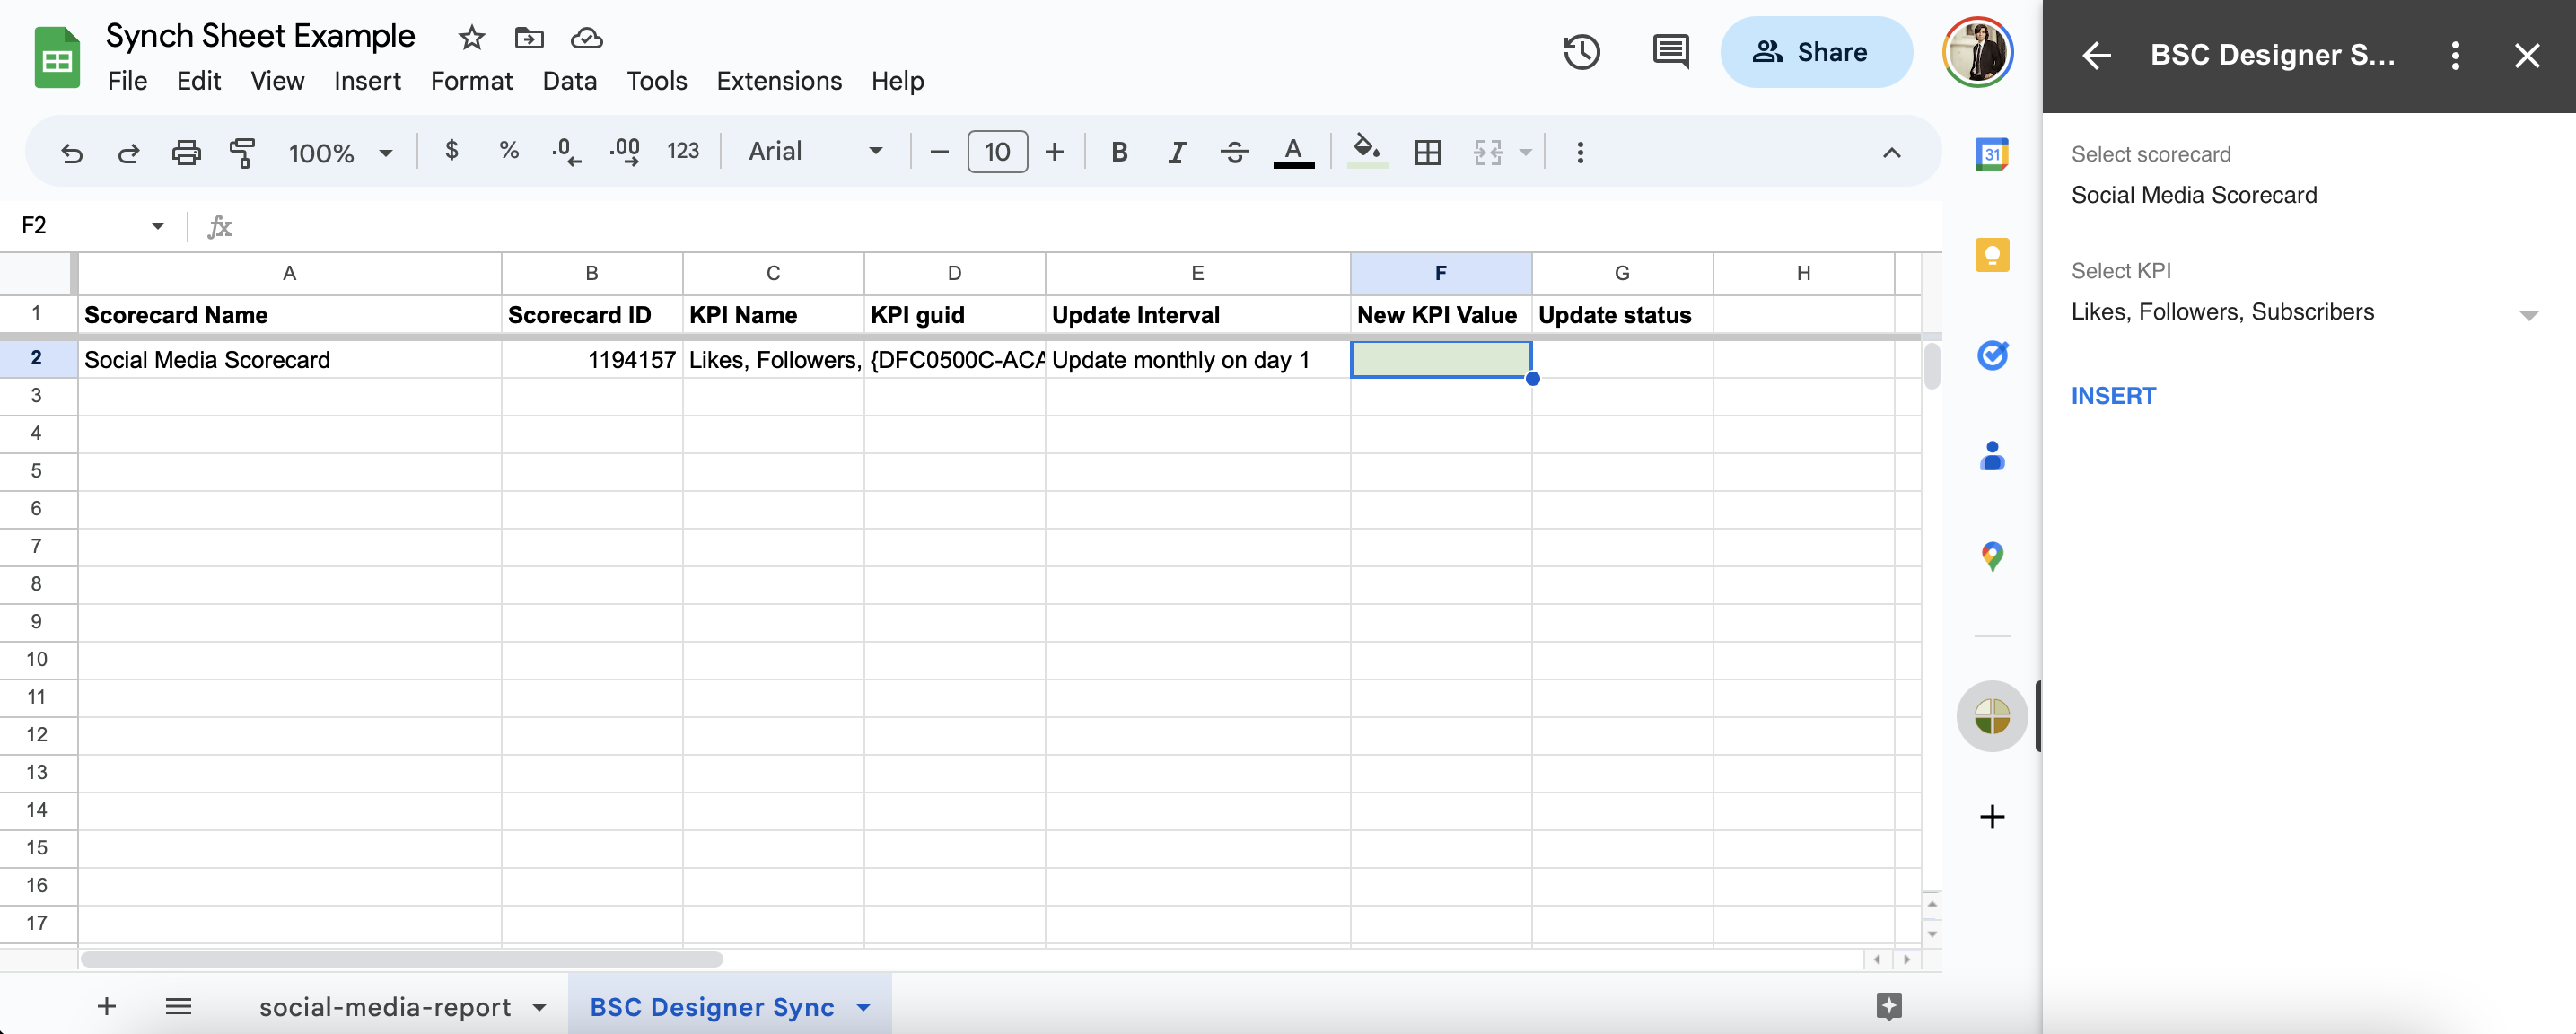
Initial Setup
- Click the API Key command to enter a valid API key (create a new API key in BSC Designer via > Settings > Integrations > Add API Key).
- Click the Add KPI command to select a scorecard and KPI from your account.
- Click Insert.
- A sheet BSC Designer Sync will be created.
- Repeat steps 2-3 to add more KPIs.
Aggregating Output of Data Source Add-on
Most data sources will provide unaggregated data. For example, an add-on for social media returns daily engagement data with Date column and number of Likes column for each of the dates.
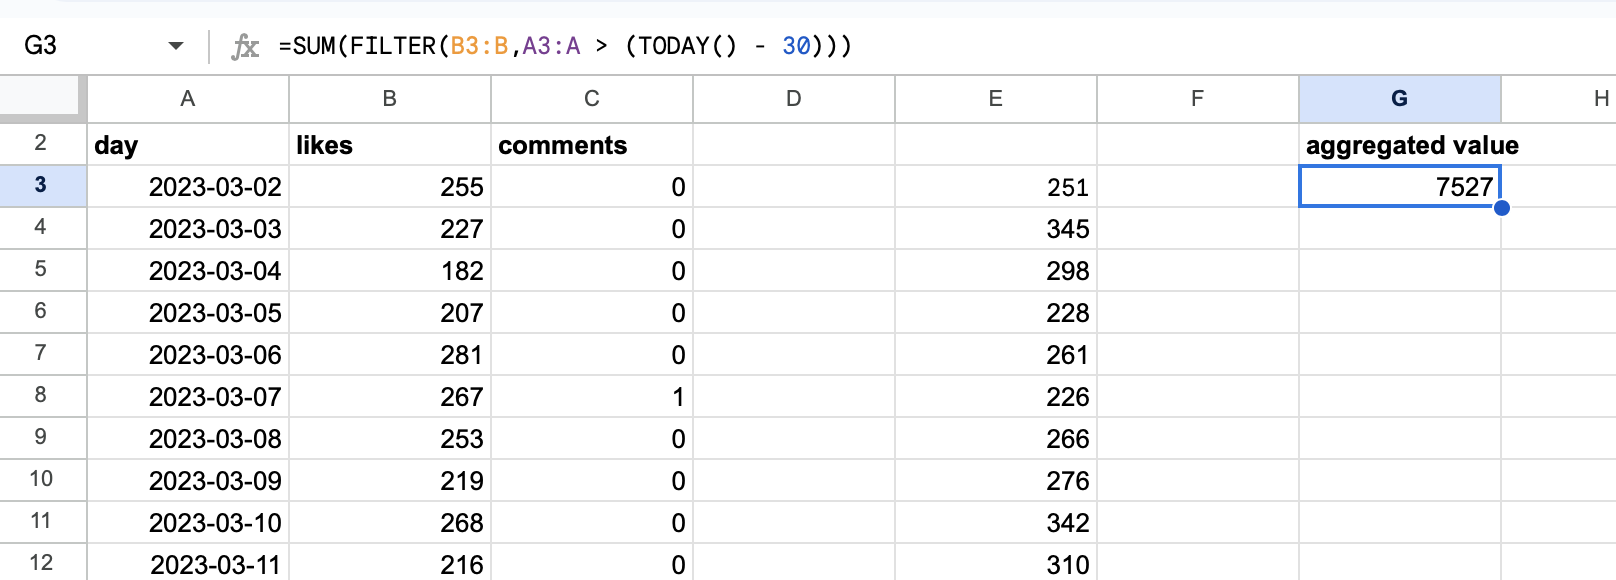
To get an aggregated data for the last month, use the formula:
- =SUM(FILTER(B:B,A:A > (TODAY() - 30)))
where A is a column with dates, and B is a column with values for each date (exclude texts, such as column name, from the range if needed).
Updating KPI with an Output of Data Source Add-on
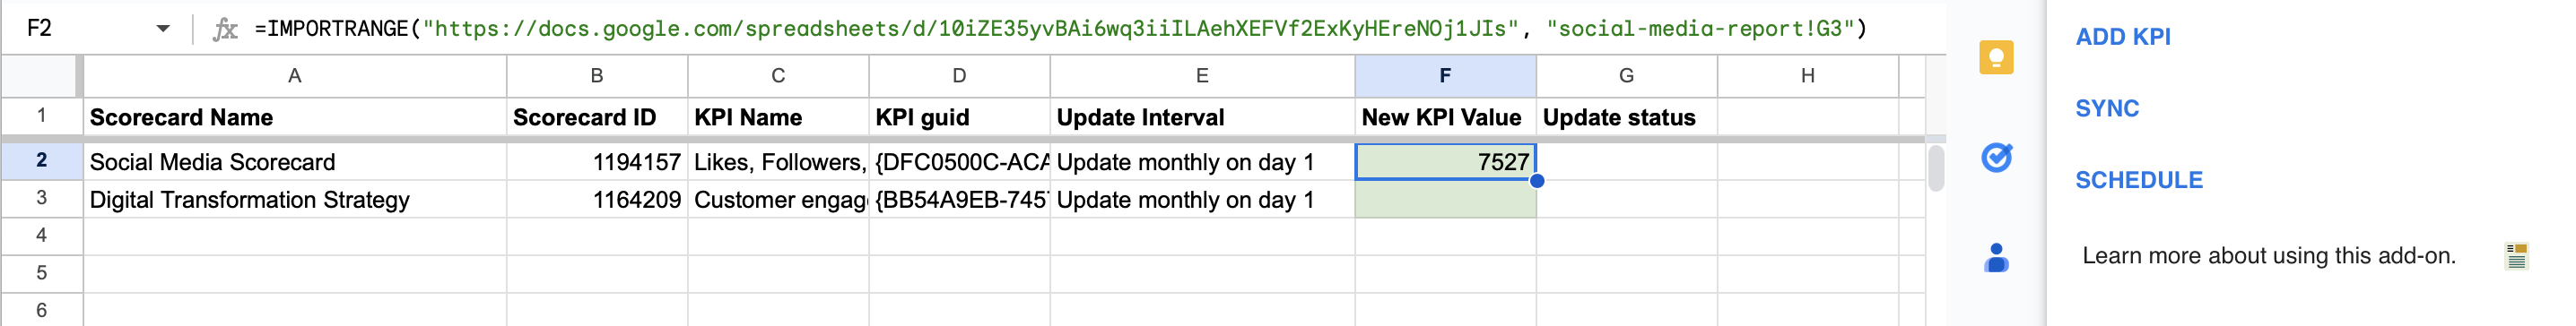
To use the aggregated data as an input for a KPI:
- Switch to BSC Designer Sync sheet.
- Find New KPI Value column for the destination KPI.
- Use IMPORTRANGE formula for the New KPI Value cell.
- Click the Sync command to start manual synchronisation or click the Schedule command to automate synchronisation.
The KPI in the BSC Designer scorecard will be updated according to the update interval configured for the indicator.
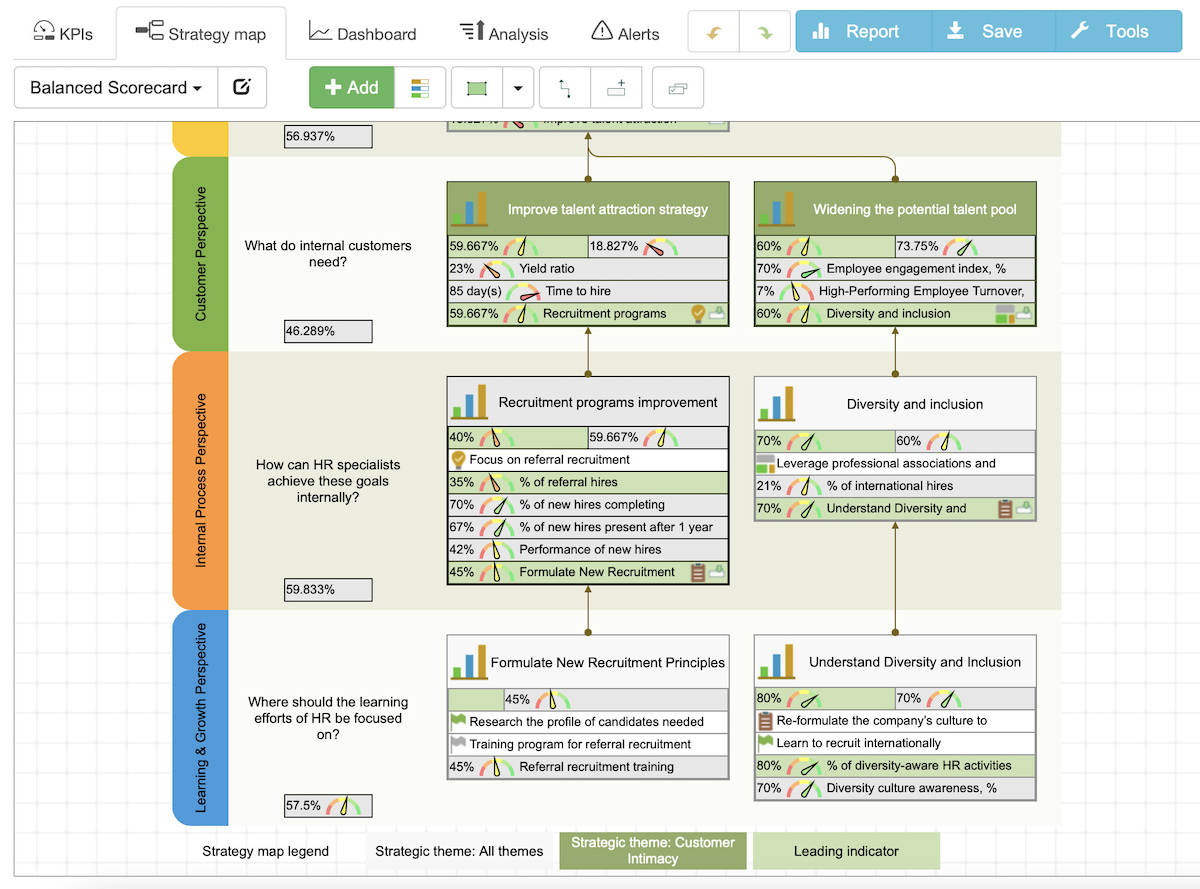
Create Professional Strategy Maps Automatically
Create strategy maps using data from KPIs tab. Display perspectives, strategic themes, business goals, and KPIs.
For more information about strategy maps design, check out this article.
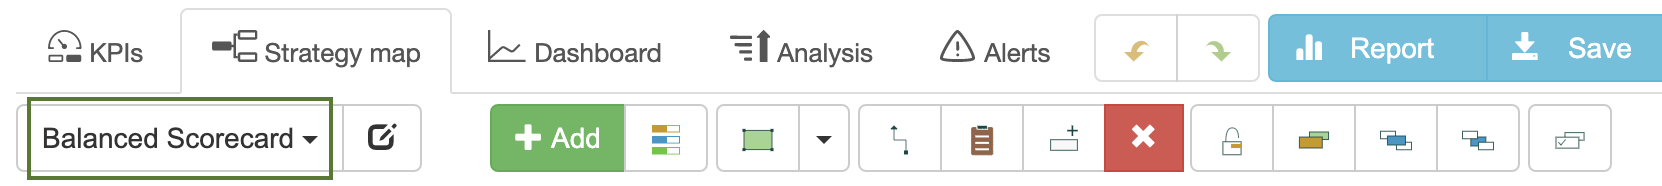
Manage Strategy Maps
To view or edit a strategy map you need to open an existing scorecard or create a new one, and then go to the Strategy Map tab.
On the toolbar there is a drop list with all of the strategy maps available in your scorecard:
Generate Strategy Map Automatically
BSC Designer can generate a strategy map automatically using information about business goals, aligned KPIs, and cause-and-effect connections between them. To generate a map automatically, create a new map and click the Strategy map placement button:

BSC Designer will suggest for you to select a type of the map that you want to create, and will also allow you to customize map settings.
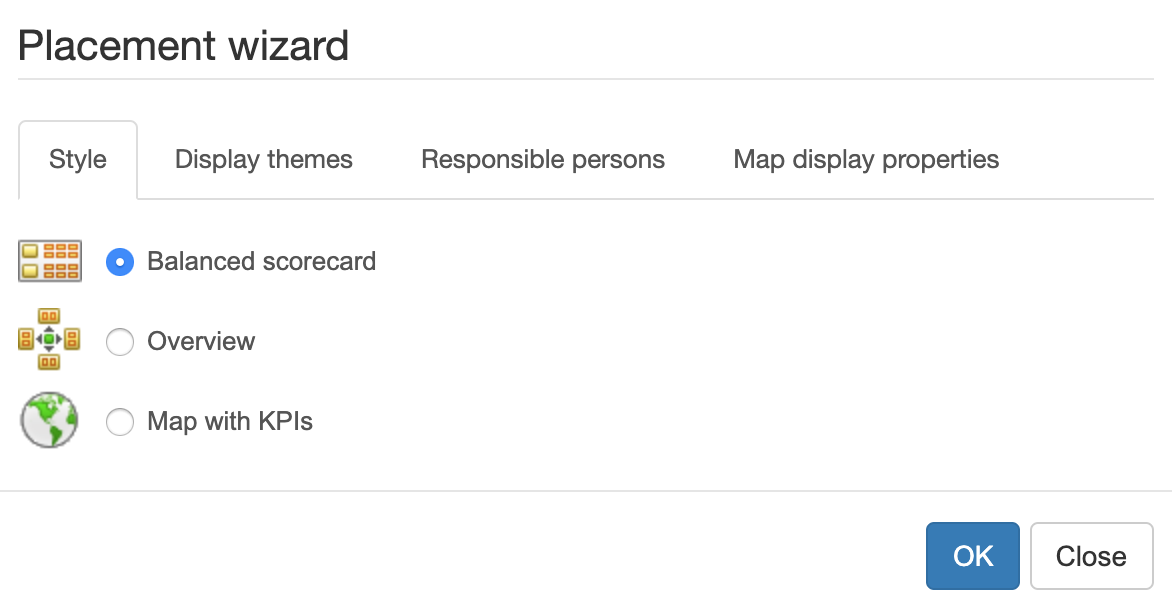
The interface of the map wizard is divided into several tabs.
Style
Select from several supported visualization styles
- Balanced Scorecard - a modern Balanced Scorecard strategy map with 4 perspectives, business goals, and cause-and-effect links between them
- Overview map - a rectangle-style map with top level KPIs/business goals only
- Map with KPIs - a geographical map where KPIs can be visualized
To use Map with KPIs map follow these steps:
- Create a Map with KPIs using one of the predefined templates (* note, in BSC Designer PRO you can create more templates)
- Go to the KPIs tab and select an indicator that you need to align with a region on the map
- Select Link item to the map in the Tools
- Go back to the Strategy map tab and update your Map with KPIs
Display Themes
A business goal in BSC Designer can belong to various strategic themes. On Display themes tab one can choose the themes that need to be visualized on the current map.
Owner
Choose if you want to show all goals, or goals/initiatives for the selected owners only.
Map Display Properties
Various controls on this tab allow the user to customize the appearance of the business goals and aligned items on the strategy map.
Customize the Way Objects Look
BSC Designer uses certain color styles for business goals and KPIs. It is possible to adjust some color settings. Select any object on the strategy map and click Formatting button on the toolbar:

Once you finish editing make sure to click
Lock button on the toolbar to let the software know that this object should not be changed when map will be rebuilt:

Another mean to customize the way how the business goals are displayed on strategy map is by customizing color scheme of the strategic themes. To do this go to the KPIs tab, select any business goal, go to the Context tab, find "Strategic theme" drop list, and click Edit button next to the drop list:
Drawing on the Strategy Map
BSC Designer provides a wide range of objects that you can put on the map. Click on the Custom objects drop list to see what options you have:

Select an object from the list and click on the strategy map in a place where you want to place this new object.
- Double click onto the new object to enter some text.
- If you need to customize objects' settings such as color, gradient, etc. you need to select an object and click Object properties button.
Text on the Strategy Map
With the Text element you can put a text note anywhere on the strategy map.
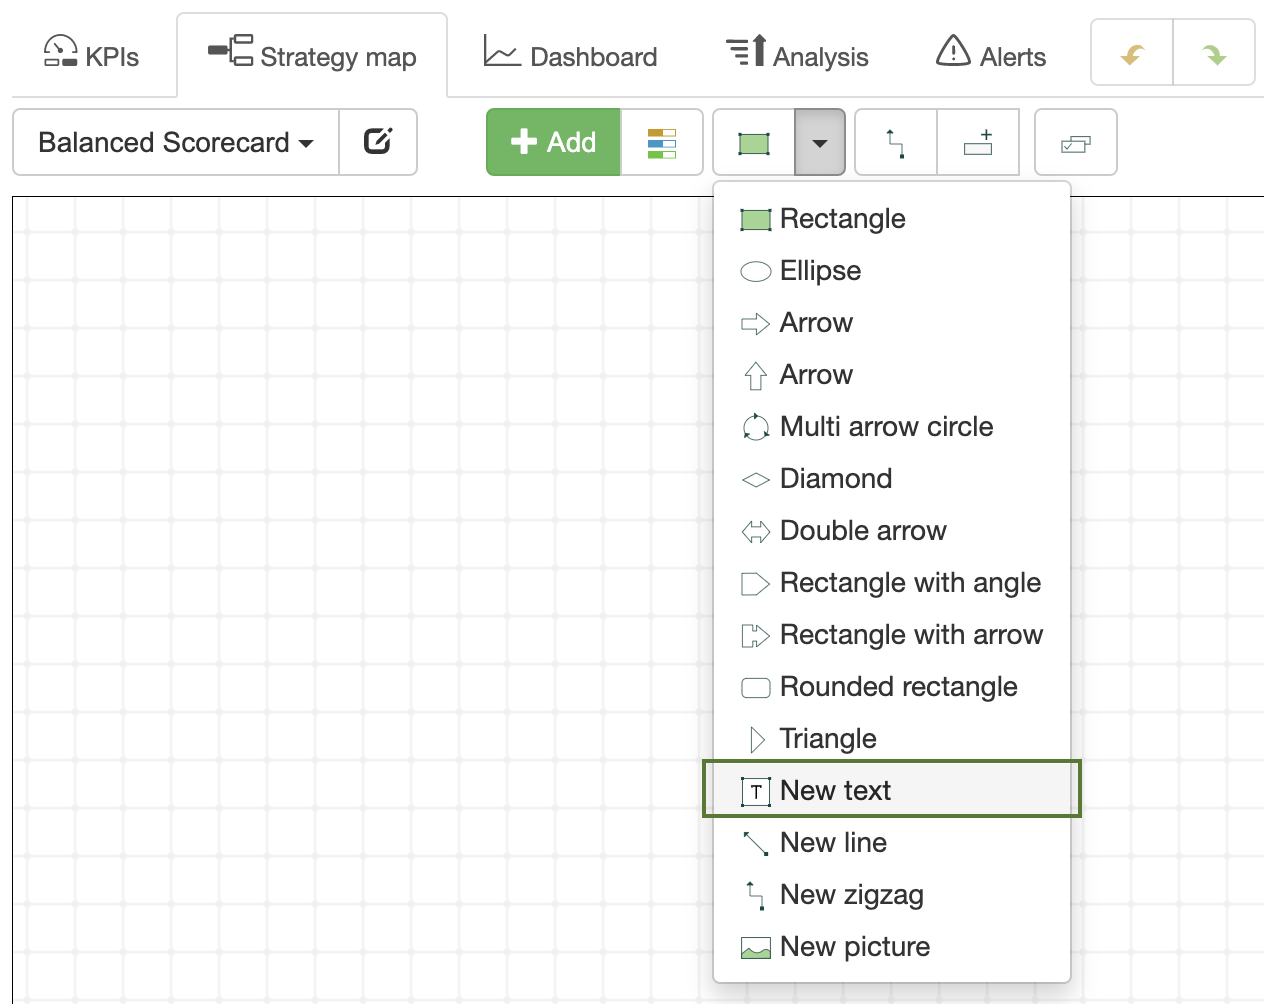
To customize text properties such as font size and color, select an element and click the Text Properties button on the toolbar.
Links
You can link two objects using different link types. Select a link type that you need:
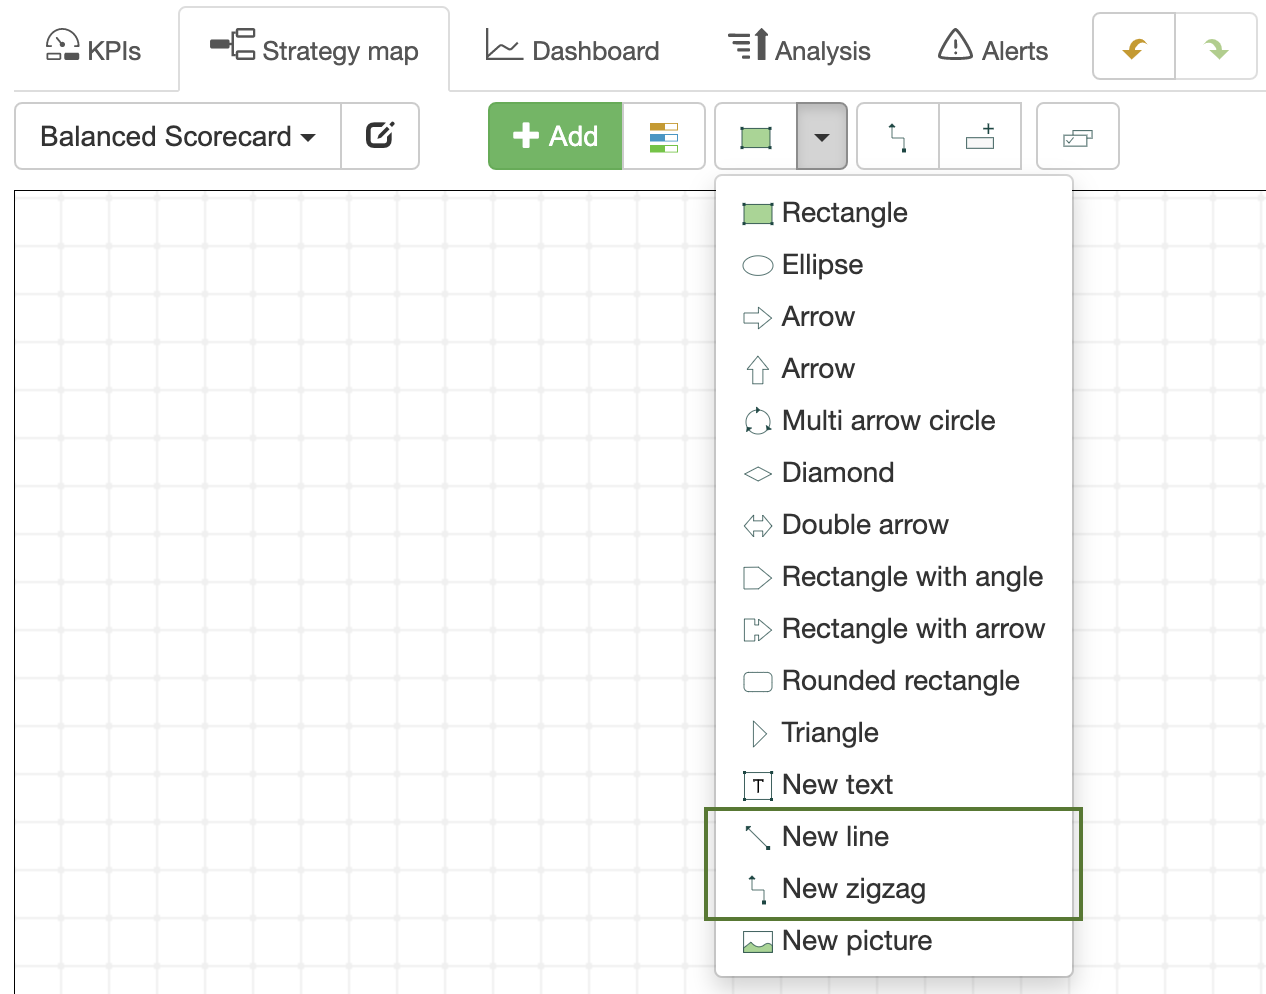
move a cursor over a source object, click and don't release a mouse button, move the cursor to the other object, select destination point and release the mouse button.
Send to Back, Bring to Front
Two buttons will help you to organize objects on the strategy map. Use them when you need to move some object to the front or bring it to the back.

Adding Items
You can add business objectives and KPIs to the strategy map.
To add a new goal or indicator:
- Select a parent perspective or goal
- Use Add Item button

To add an item that already exists:
- Use Add Existing Item button

Export Goal to Another Scorecard
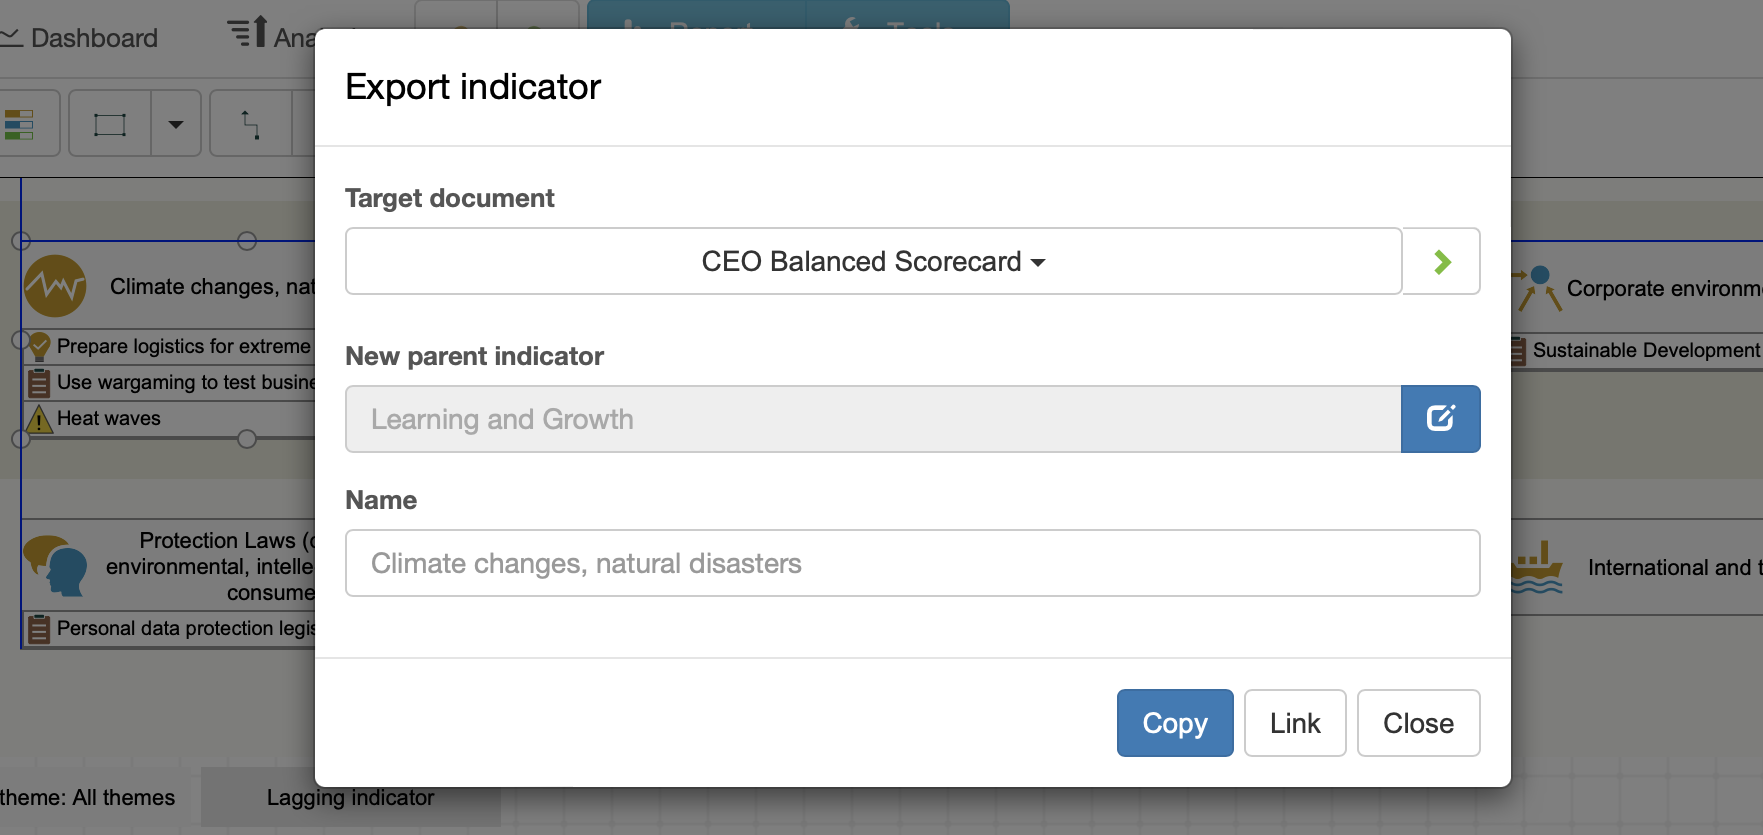
A goal on the strategy map can be exported to another scorecard. For example, the results of PESTEL analysis can be exported to another strategy scorecard for further development.
- Select a goal on the map
- Click on the Export Goal button
- Select target scorecard and new parent item
- Click Copy or Link button
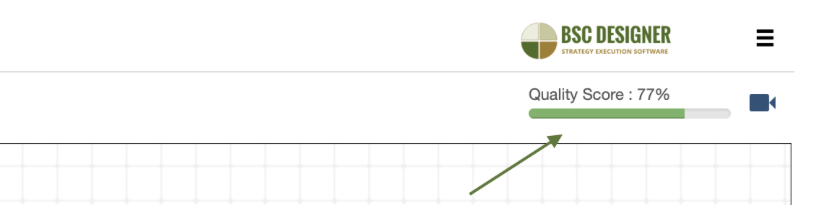
AI-Powered Quality Control
The software tracks automatically the application of the best practices of strategic planning on the strategy map.
Find the resultant quality score in the right-top corner of the strategy map:
- Click on the quality indicator to check out suggested improvements
- Disable quality analysis via Settings > Workflow > Check the quality score of strategy map
Create Performance Dashboards for the Most Important KPIs
Display performance data on a dashboard in BSC Designer. Add new charts, create several dashboards, filter data that you need to see.
For more information about dashboards design, check out this article.
Access Dashboards
To access the dashboards follow these steps:
- Log into your account at BSC Designer
- Open any scorecard
- Go to the Dashboard tab
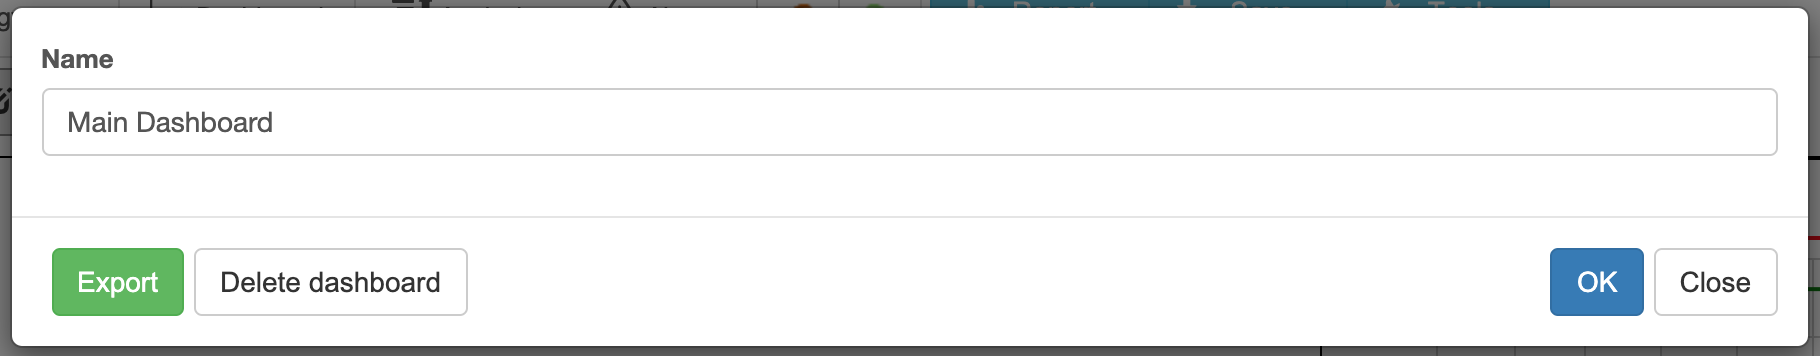
Creating a New Dashboard
Any scorecard in BSC Designer can include several performance dashboards. Using the toolbar on the Dashboard tab you can:
- Switch between dashboards available in the scorecard:
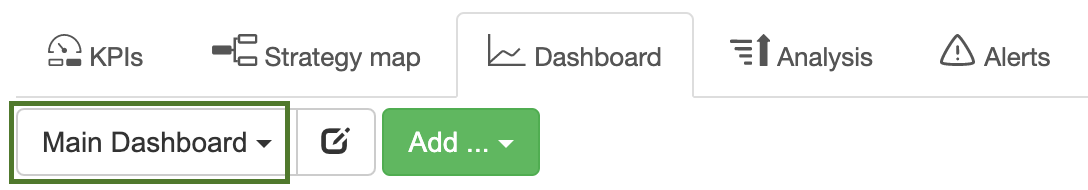
- Add new dashboards
- Add charts to the dashboards
- Rename existing dashboards
- Delete dashboards
- Export dashboard as a picture file
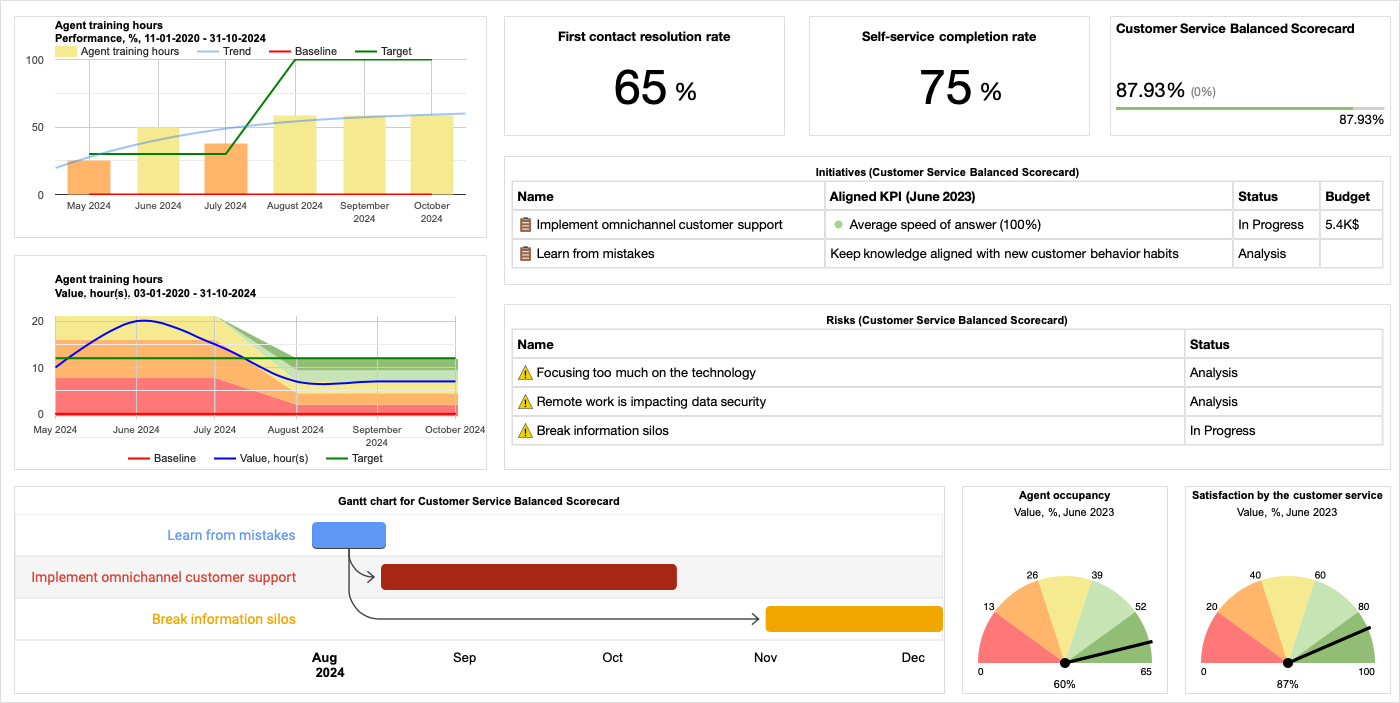
Adding a New Chart to a Dashboard
To add a new chart to a dashboard follow these steps:
- Open any scorecard, go to the Dashboard tab
- Click the Add... button on the toolbar
- Choose an indicator that will be used as a source of the chart data
- Select chart type from the drop list
- Select if you want to visualize on the dashboard Value, Performance, or Progress
- Click OK to finalize the process
Adjusting Chart Properties
In BSC Designer it is possible to move and resize charts according to your needs.
To delete a chart:
- Hover over the chart
- Click on the red cross icon that will appear
To resize a chart:
- Move mouse pointer to the edge of the chart
- Press mouse button, resize chart as needed
- Release mouse button
Some charts (for example, a Time chart) can be customized additionally.
- Move mouse pointer over the chart
- Additional control will appear
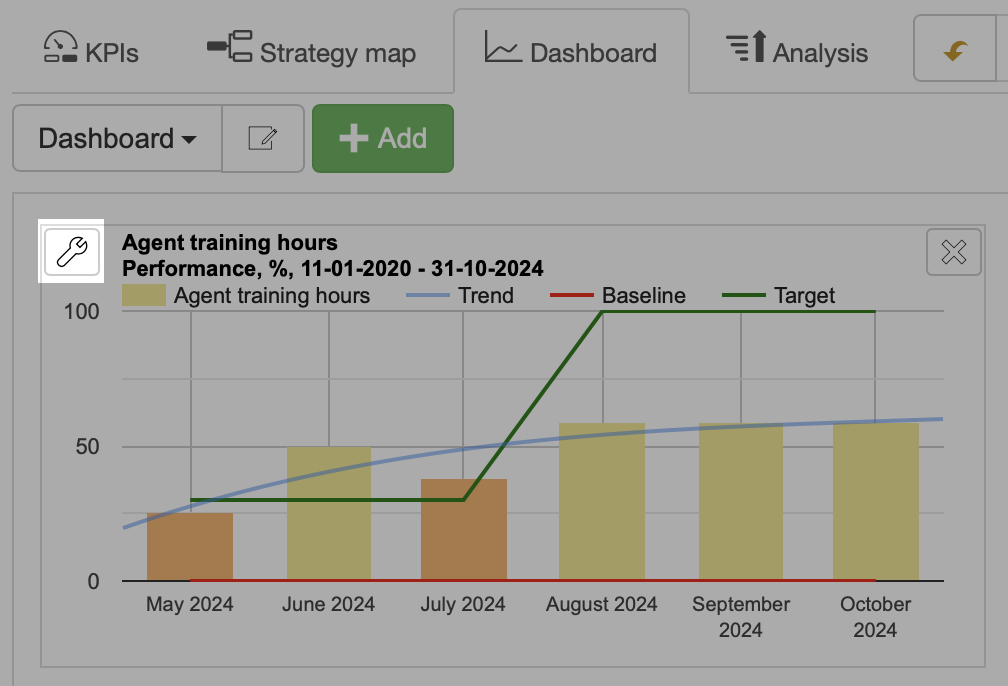
- Use "gear" button to customize chart, for example to change the period of time visualized on the chart
Dashboard Templates
If you plan to use the same layout of charts for different scorecards, then it's a good idea to create a dashboard template:
- Click Edit dashboard properties button
- Click Save as template
A new template will appear in the list of dashboards.
Existing dashboard templates can be managed on the > Settings > Workflow tab.
Performance Analysis and Forecast for KPIs
Find the best performing indicators, biggest gain or loss, predict indicator value, and detect indicators that were not updated on time.
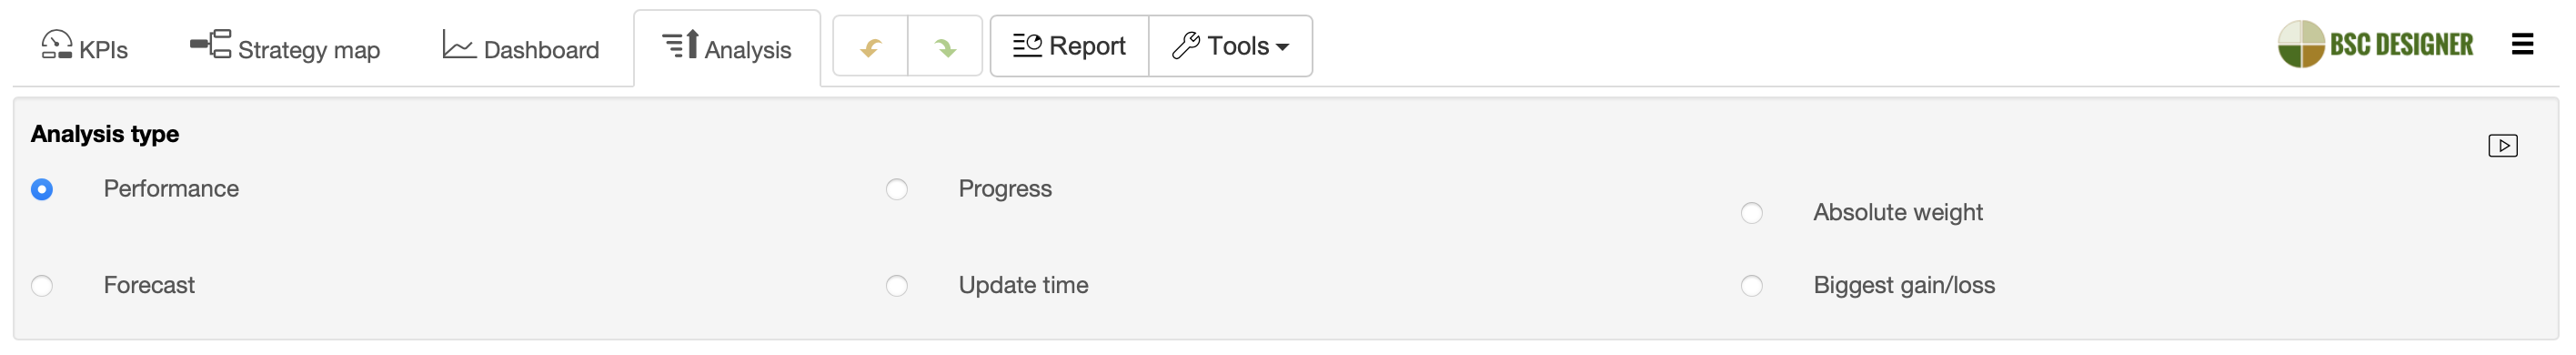
How-to use Analysis Function
Here is a general approach to using the analysis functions in BSC Designer:
- Open a scorecard in BSC Designer and go to the
 Analysis tab
- Choose the analysis type that you want to use:
- In the list of indicators some columns will support order sorting, click on them to change sorting order:
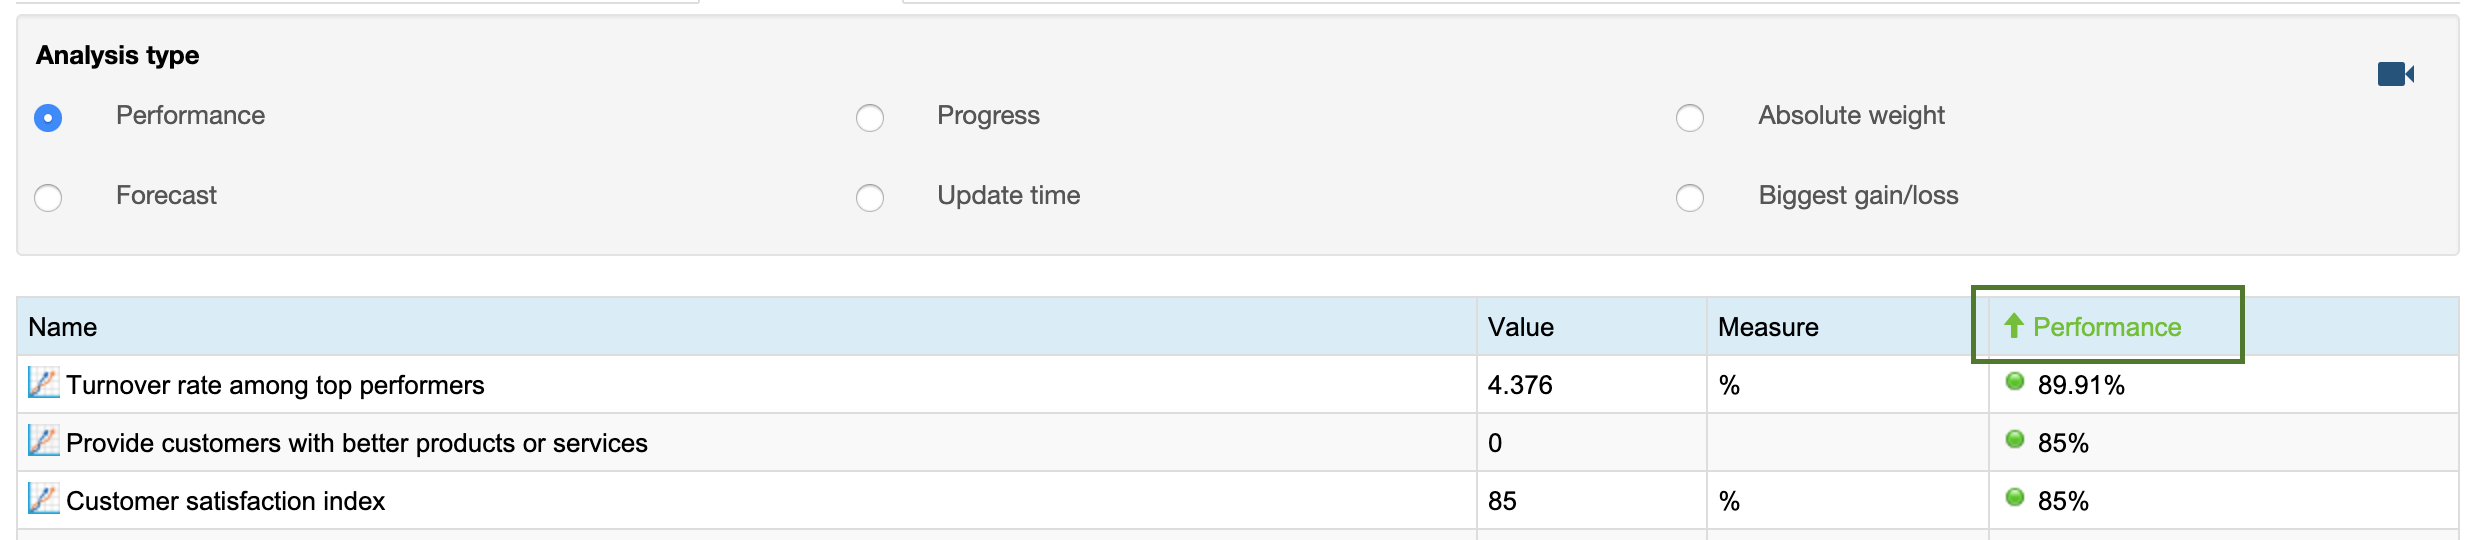
- Options below allow to adjust time interval for the analysis as well as other settings
Analysis Types
Here are the supported analysis types in BSC Designer:
- Performance - find best/worst performing indicators
- Progress - find indicators with highest/lowest progress
- Absolute weight - find indicators with the highest/lowest impact on the scorecard performance
- Forecast - do a linear forecast of indicator's value that is expected to be achieved for a certain date, or forecast a date when certain value will be achieved
- Update time - list indicators and their update dates, find indicators that were not updated on time
- Biggest gain/loss - find indicators that were the biggest gain/loss (can be applied to "value," "performance," "progress") over a period
Performance Reports for KPIs, Goals, and Initiatives
Generate reports with various views on scorecard performance: overview, action plans, costs of strategy.
Access Reports
To access Reports dialog:
- Open a scorecard
- Click Report
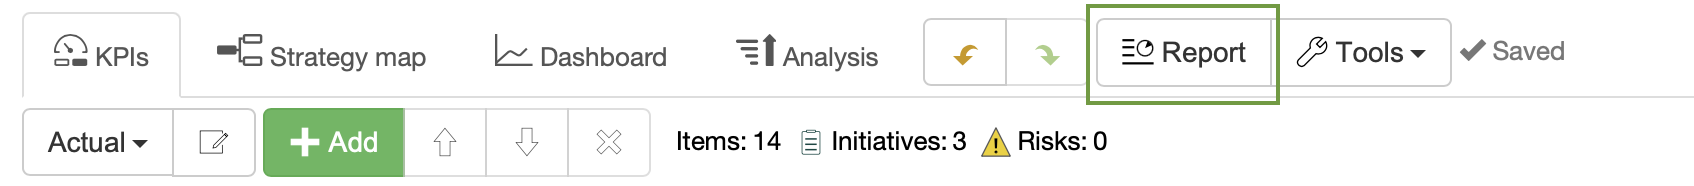
Reports dialog will be displayed:
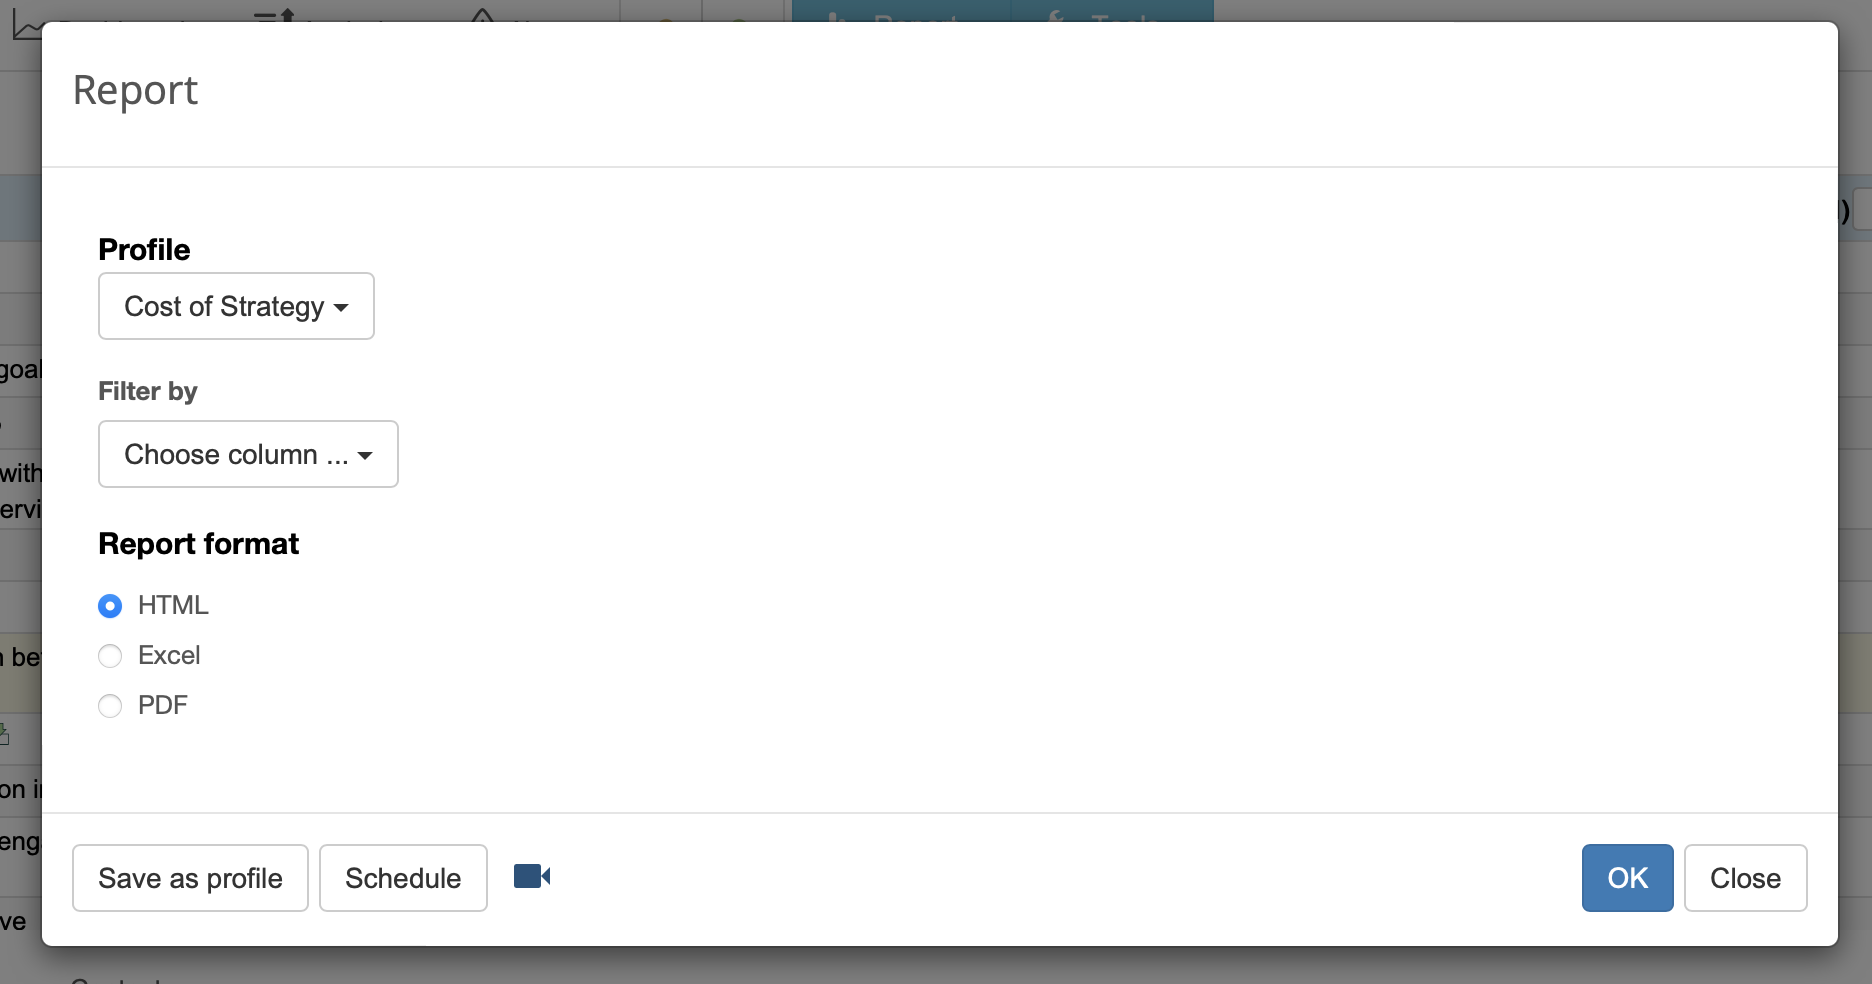
Generate a Report for the Scorecard
To generate a report:
- Select one of the options:
- Values - a report with the values of all indicators from the scorecard
- Cost of Strategy - a summary of all initiatives with budget and duration data
- Efforts vs. Results - a report with data of the leading and lagging indicators
- Action Plan - a report with goals, initiatives, and persons responsible
- Strategic plan - a report with mission, vision, core values, strategic themes
- Overview - a report with all the details about your KPIs and their performance
- Dashboard - a report with all dashboards of the scorecard
- Strategy map - a report with all strategy maps of the scorecard
- Customize - use this option to create your own reports.
- Follow the link to open a generated report.
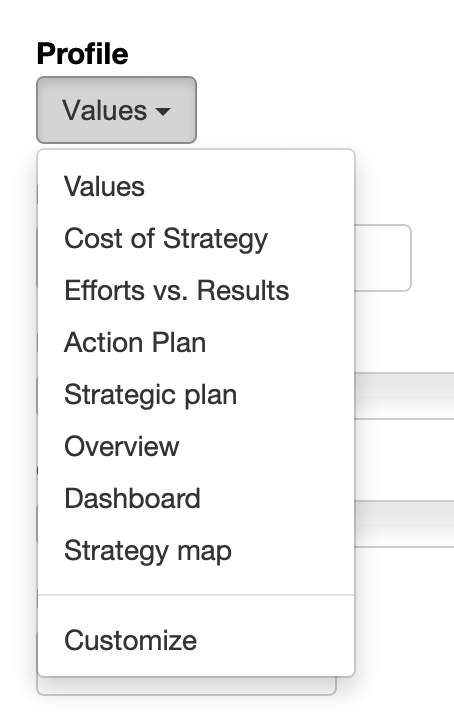
Create a New Report Profile
To create a new report profile:
- In the Profile droplist select any existing report to use it as a starting point
- Apply necessary filters
- Add/remove necessary columns or rows:
- Select a report field and click
 button to add it to the profile columns
- Select a report field from the Data group and use
 button to add it to the report rows
- Click OK button to save profile
Modify Existing Profiles
To modify custom profiles:
- Select Customize in the Profile droplist
- Use arrows to change the position of profile
- Use Edit button to modify the settings of the profile
Schedule Regular Reports
Receive reports regularly by email:
- Select any report profile from Profile droplets
- Click Schedule button
- Specify sending frequency
- Specify the recipient of the report
- Click OK to save
Charts in BSC Designer
To access charts and diagrams in BSC Designer open a scorecard, go to the KPIs tab and select any container or indicator. The chart element is displayed on the right.
Besides having a chart you have several drop lists.
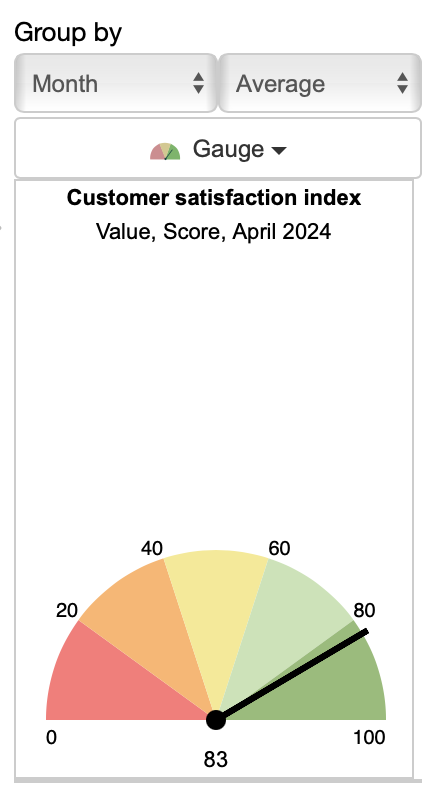
- Group by has two drop lists that define information reporting interval (by day, by month, etc.) and summary type (average, sum, etc.)
- Chart type - select the chart that you want to display right now
- Leading/lagging - select to display leading or lagging part of the data (available for containers only)
Details about Charts and Diagrams
BSC Designer supports several types of chart.
- Time chart. The chart shows how the value of the KPI changes over time. On the chart, the baseline and target values are displayed as well.
- Performance and Progress. These charts show how the performance and progress value for the selected KPI are changing over a period of time.
- Gauge diagram. Displays the values of the KPI for the date selected in the calendar. The baseline and target values are displayed as well.
- Pie. A Pie diagram is useful when you need to compare the performance of several KPIs in one container or in several top container.
- Table. Values table shows a date and respective KPI value for these dates.
- Weight. This chart shows the weights of all KPIs within a selected container.
- Risk. The chart visualizes the impact (weight) and probability (value).
- Radar. The chart for the containers that visualises performance, baseline and target of the child indicators.