Learn how to track the warehousing process from receiving to shipping. Find a template of a strategy map with trending improvement initiatives and performance metrics.
In this article, we analyze warehouse effectiveness challenge on two levels:
- Process level with the focus on efficiency and effectiveness metrics
- Strategy level that helps to align warehouse activities with the company’s overall goals
Warehouse Process KPIs
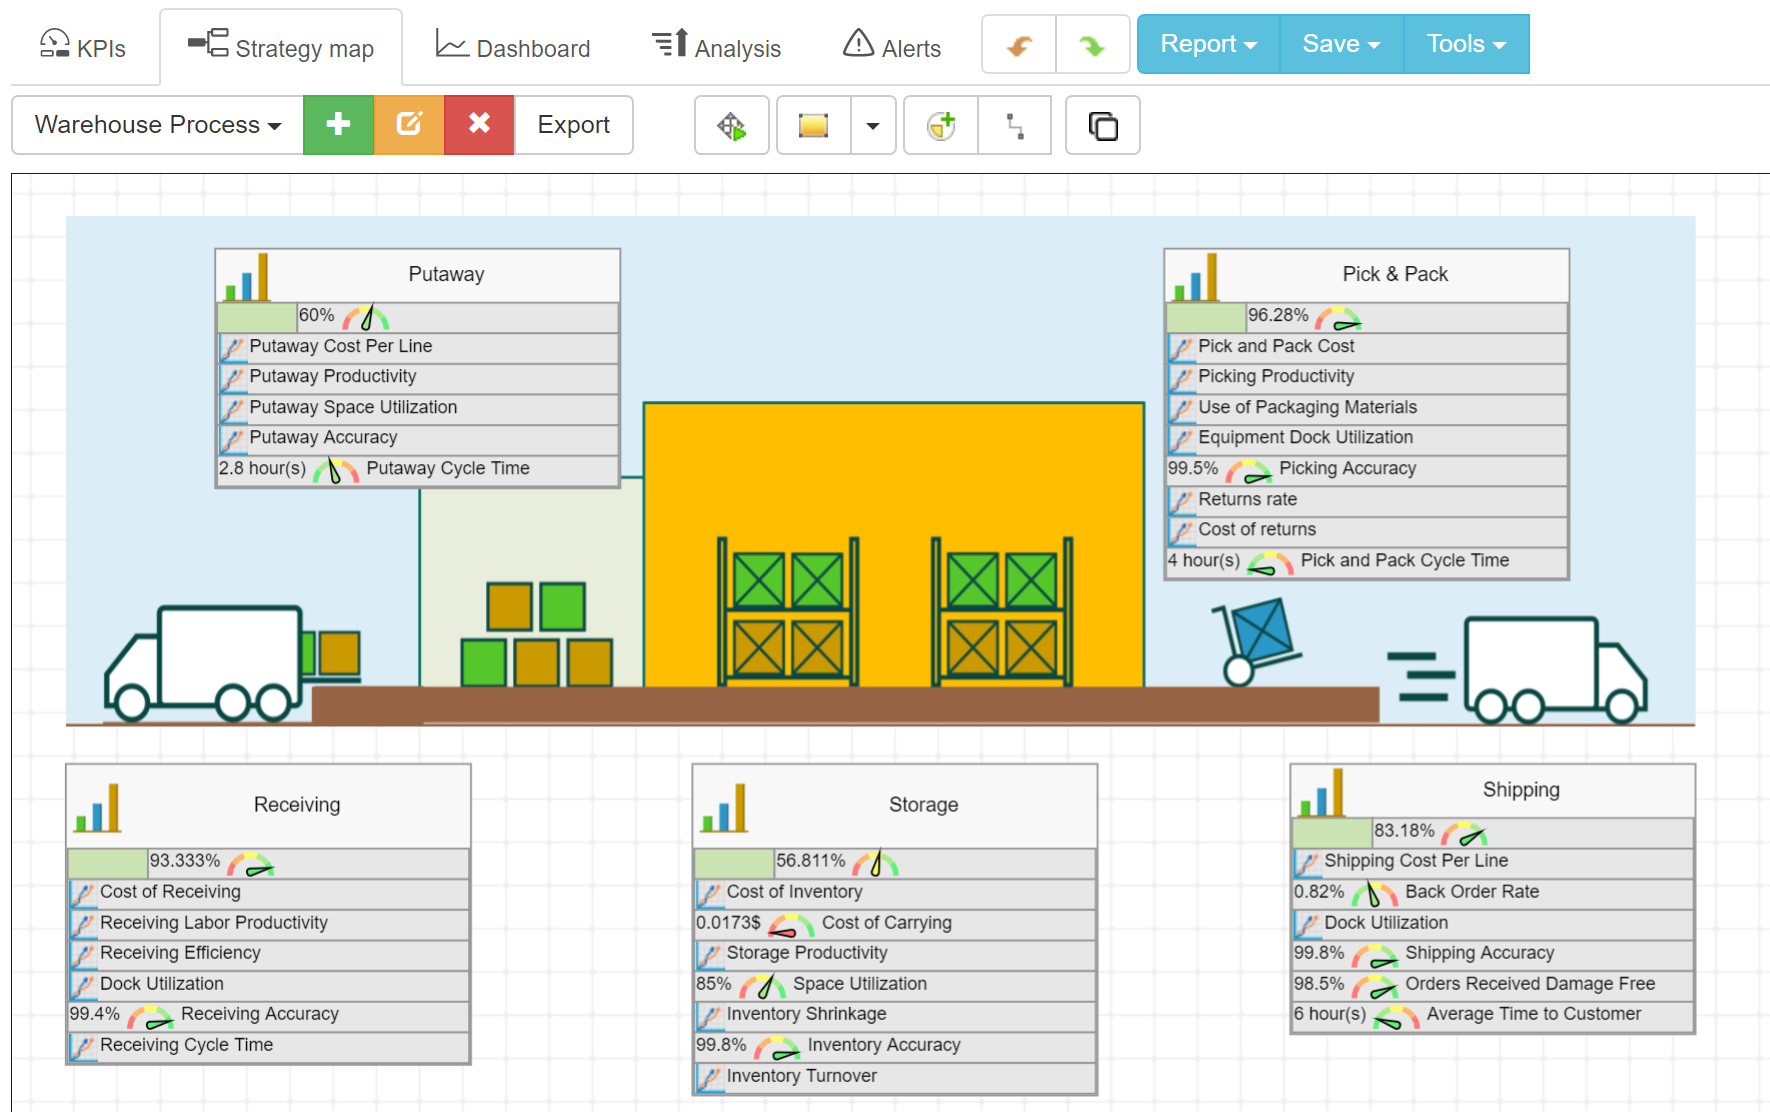
Warehouse activity is associated with certain established process steps 1. These steps are an excellent base for the process-oriented performance metrics.
Possible measurement points in this case are:
- Financial metrics
- Effectiveness (productivity) metrics
- Utilization metrics for equipment and storage
- Quality metrics
- Cycle time metrics
Respectively on each step, these evaluation parameters are adjusted to the process step.
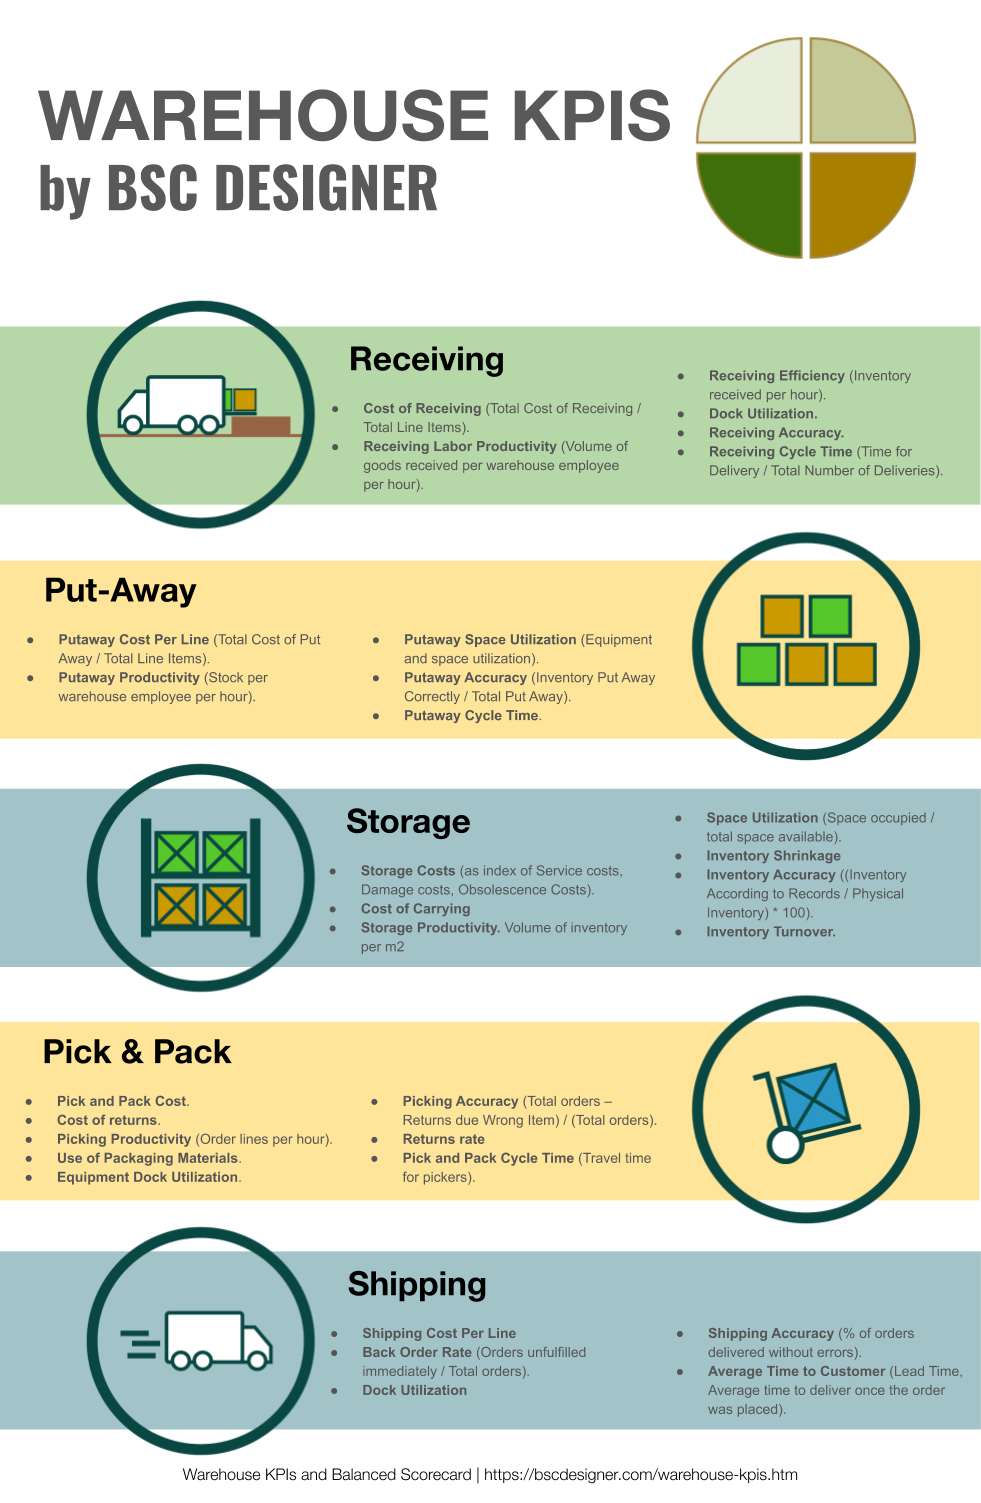
Receiving
- Financial metric: Cost of Receiving (Total Cost of Receiving / Total Line Items).
- Effectiveness metric: Receiving Labor Productivity (Volume of goods received per warehouse employee per hour).
- Effectiveness metric: Receiving Efficiency (Inventory received per hour).
- Utilization metric: Dock Utilization.
- Quality metric: Receiving Accuracy.
- Cycle time metric: Receiving Cycle Time (Time for Delivery / Total Number of Deliveries).
Put-away
- Financial: Putaway Cost Per Line (Total Cost of Put Away / Total Line Items).
- Effectiveness: Putaway Productivity (Stock per warehouse employee per hour).
- Utilization: Putaway Space Utilization (Equipment and space utilization).
- Quality: Putaway Accuracy (Inventory Put Away Correctly / Total Put Away).
- Cycle time: Putaway Cycle Time.
Storage
- Financial: Storage Costs (as index of Service costs, Damage costs, Obsolescence Costs).
- Financial: Cost of Inventory
- Financial: Cost of Carrying (Cents per dollar spent on inventory overhead).
- Effectiveness: Storage Productivity. Volume of inventory per m2
- Utilization: Space Utilization (Space occupied / total space available).
- Quality: Inventory Shrinkage ( (Recorded Inventory Cost – Physical Inventory Cost) / Recorded Inventory Cost).
- Quality: Inventory Accuracy ((Inventory According to Records / Physical Inventory) * 100).
- Cycle time: Inventory Turnover.
Preparation (Pick & Pack)
- Financial: Pick and Pack Cost.
- Financial: Cost of returns.
- Effectiveness: Picking Productivity (Order lines per hour).
- Utilization: Use of Packaging Materials.
- Utilization: Equipment Dock Utilization.
- Quality: Picking Accuracy (Total orders – Returns due Wrong Item) / (Total orders).
- Quality. Returns rate (Units returned / Units sold)
- Cycle time: Pick and Pack Cycle Time (Travel time for pickers).
Shipping
- Financial: Shipping Cost Per Line
- Effectiveness: Back Order Rate (Orders unfulfilled immediately / Total orders).
- Utilization: Dock Utilization
- Quality: Shipping Accuracy (% of orders delivered without errors).
- Cycle time: Average Time to Customer (Lead Time, Average time to deliver once the order was placed).
Benchmark Data
The scorecard template includes some benchmarking data obtained from:
- “2015 Warehousing Education and Research Council (WERC) DC Measures Report” 2
- fcbco.com
- Warehousing 2020
Use this data as a starting point for your research. The final numbers depend a lot on your market conditions.
When finding benchmarks for your indicators, make sure that you follow the same approach to measurement and the compared organization.
A starting point for any benchmark is your own historical data.
Quality Metrics
Quality metrics are implemented on each step of the warehousing process. A general formula is focused on finding the number of correctly served items compared to the total number of items.
An interesting question is how the warehouse manager could estimate the number of correctly served items. The two possible control points are:
- Customer complaints (for example, as measured by returns)
- Random checks of the items
In the Quality KPIs article, we have discussed various approaches that organizations can use to measure and improve quality.
Safety Metrics
The classical process-oriented approach doesn´t include safety metrics explicitly, but it is obvious that safety should be a main priority of warehouse managers.
For this reason, on the strategy map below, we have a separate “Safety” theme.
We can track safety efforts with these leading metrics:
- Safety standards awareness
- Near-miss reporting awareness
- Safety equipment used
The results can be validated in this way:
- Time lost due to injury
- Accidents per year
- Near-miss issues reported
In the strategy map section below, we will discuss some ideas for safety initiatives. For now, I´d like to pay attention to the specific setup of safety metrics.
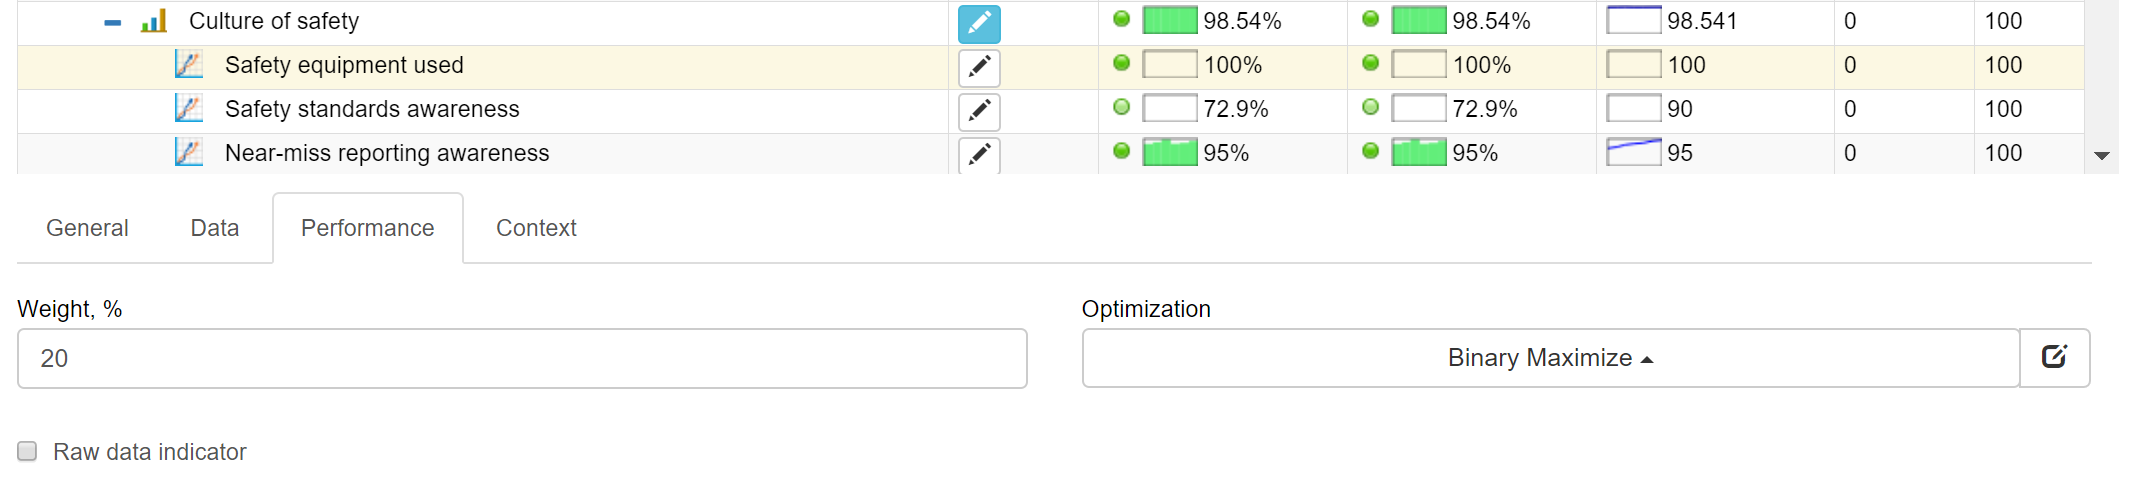
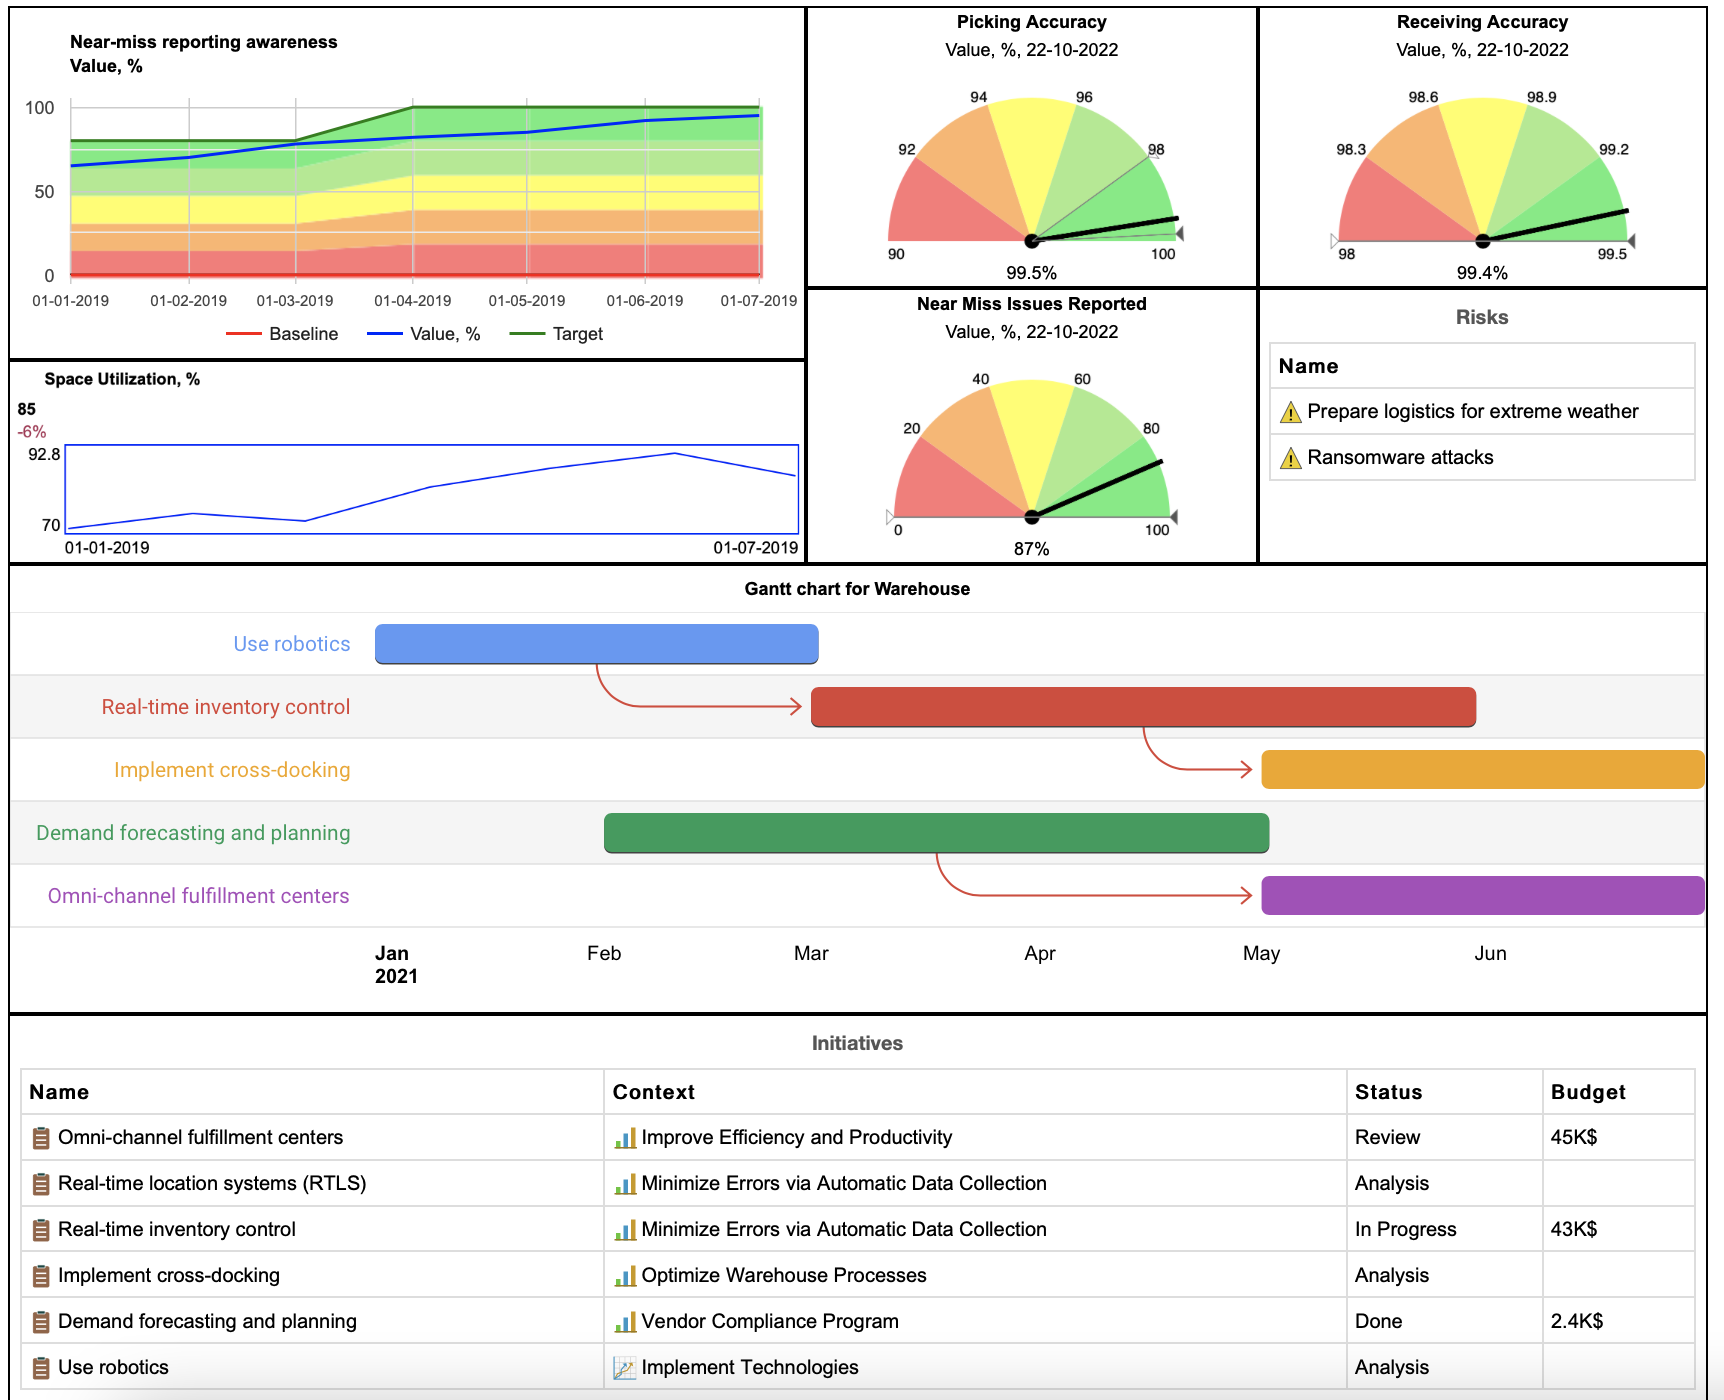
The performance function for the “Safety equipment used” should be binary. This means that the metrics can be in the green zone (have 100% performance) only if 100% of the used equipment is adjusted to the current safety standards.
The Safety standards awareness metric should have a specific performance function as well. It allows a certain margin between 100% awareness due to the normal fluctuations in staff and standards change, but the scale should be much more aggressive compared to a standard line growth function.
The idea is to align safety initiatives with overall strategy of the organization. A Balanced Scorecard strategy map is an excellent business tool to do this. Check out an example of the Safety Strategy Map that we discussed before.
Strategy Scorecard
I see several reasons why the warehouse should have a properly designed strategy scorecard.
- It helps to describe a warehouse strategy, have a big picture view and know growth points.
- It allows to align supply chain strategy with overall company strategy.
- It focuses performance measurement efforts beyond simple process metrics.
Below, I’m following the logic of the Balanced Scorecard framework to create a strategy map template for the warehouse. If you want to learn more about the framework, I recommend this article to you. Additionally, consider connecting this warehouse strategy scorecard to a procurement scorecard, for example, by the “Inventory accuracy, %” indicator.
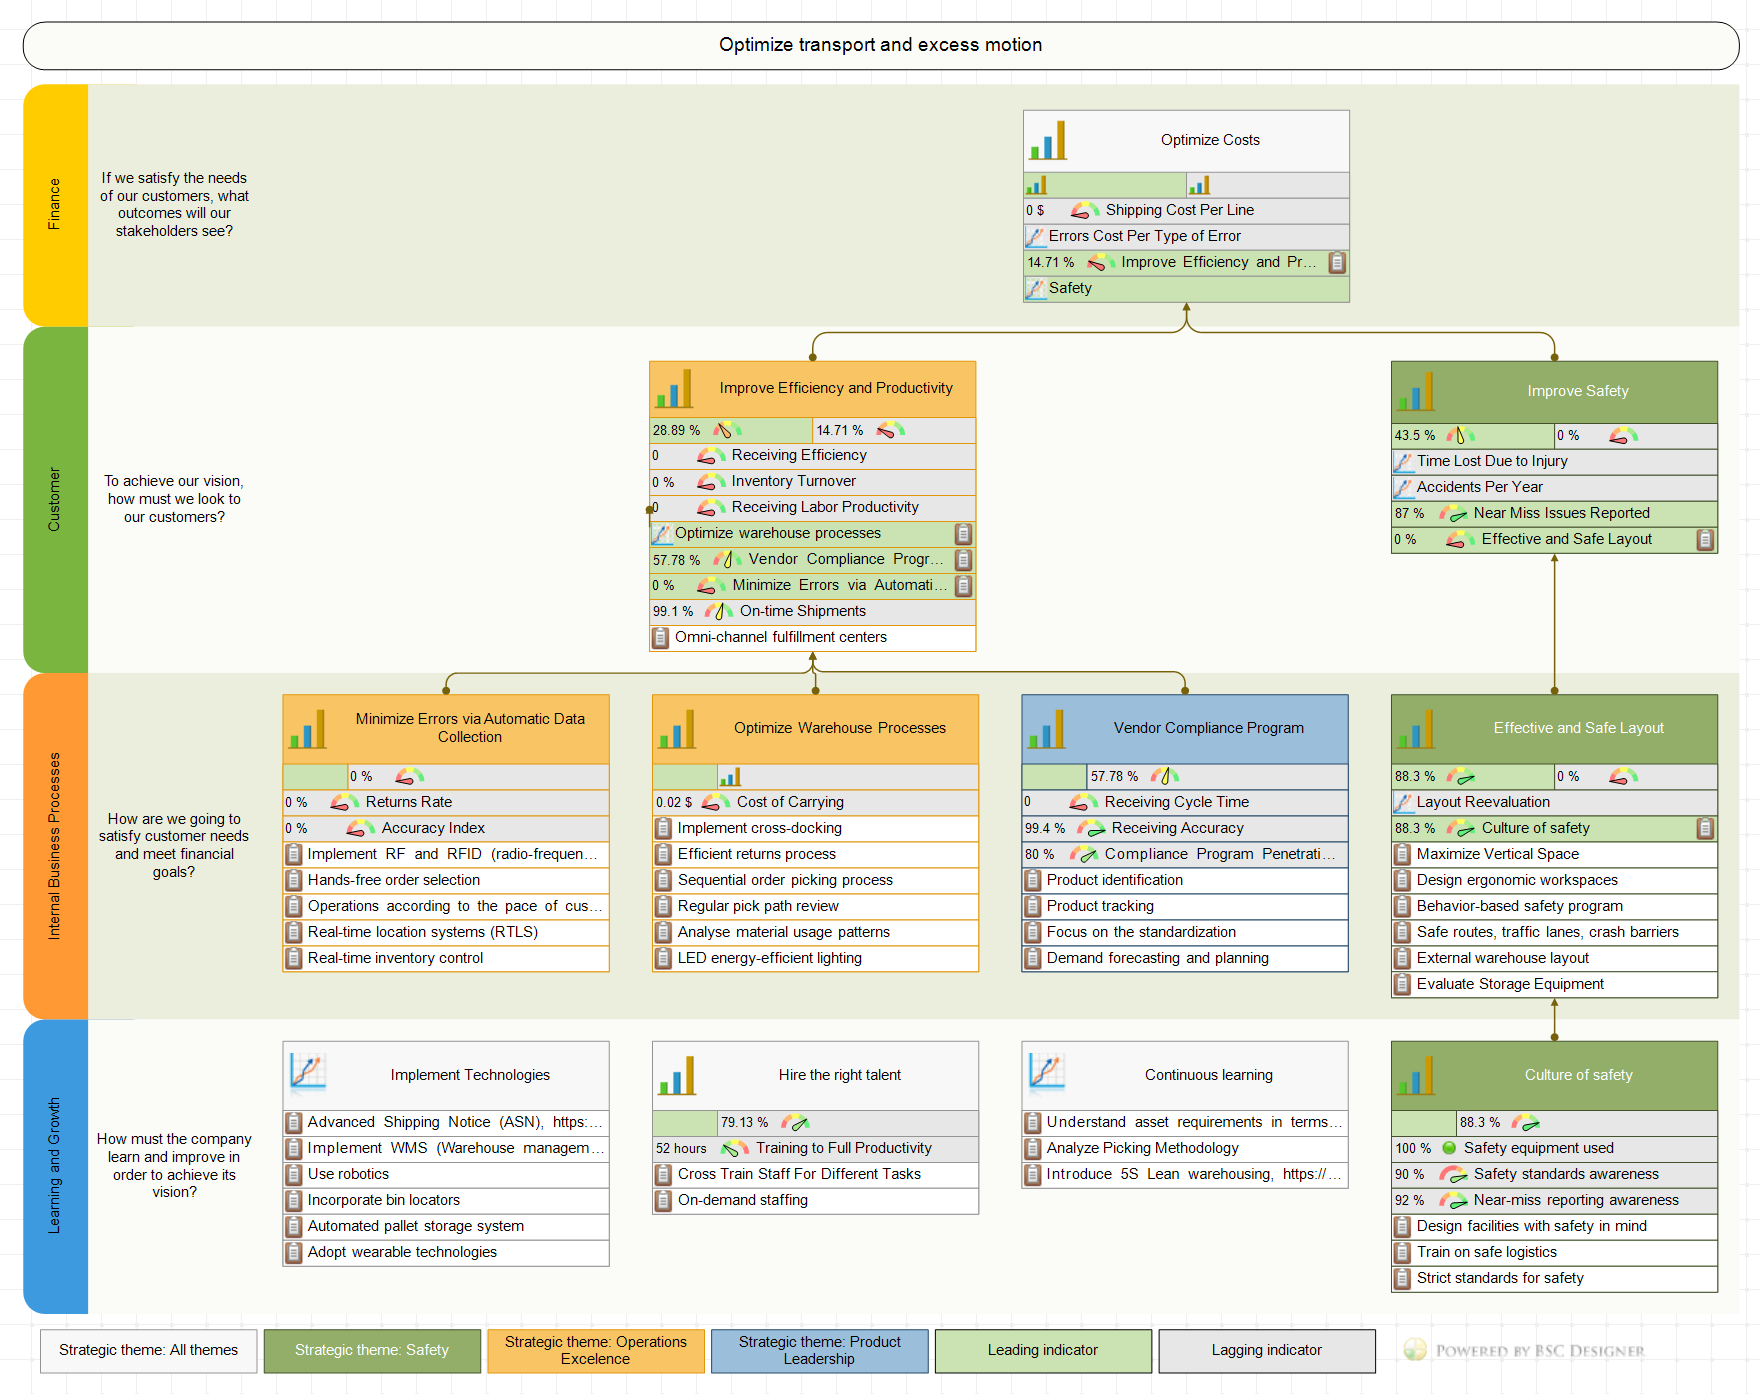
Finance Perspective
The financial goals of the warehouse are related to optimizing running costs.
Business goal: Optimize Costs
Lagging metrics:
- Shipping Cost Per Line
- Errors cost per type of error
Customer Perspective
The stakeholders of the warehouse can include suppliers, clients, warehouse team, logistic personnel. Respectively, the goals of the customer perspective can be formulated around the needs of these stakeholders.
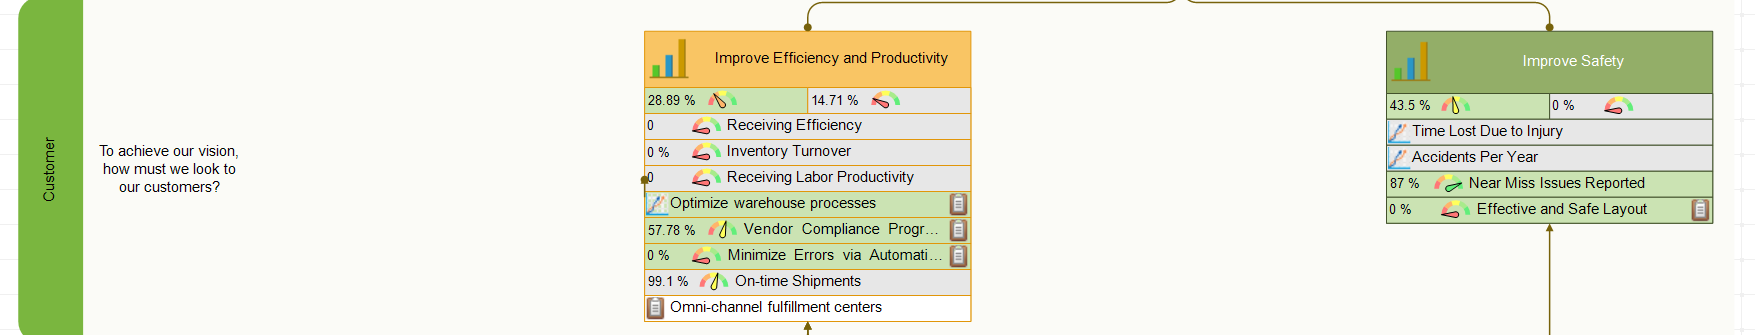
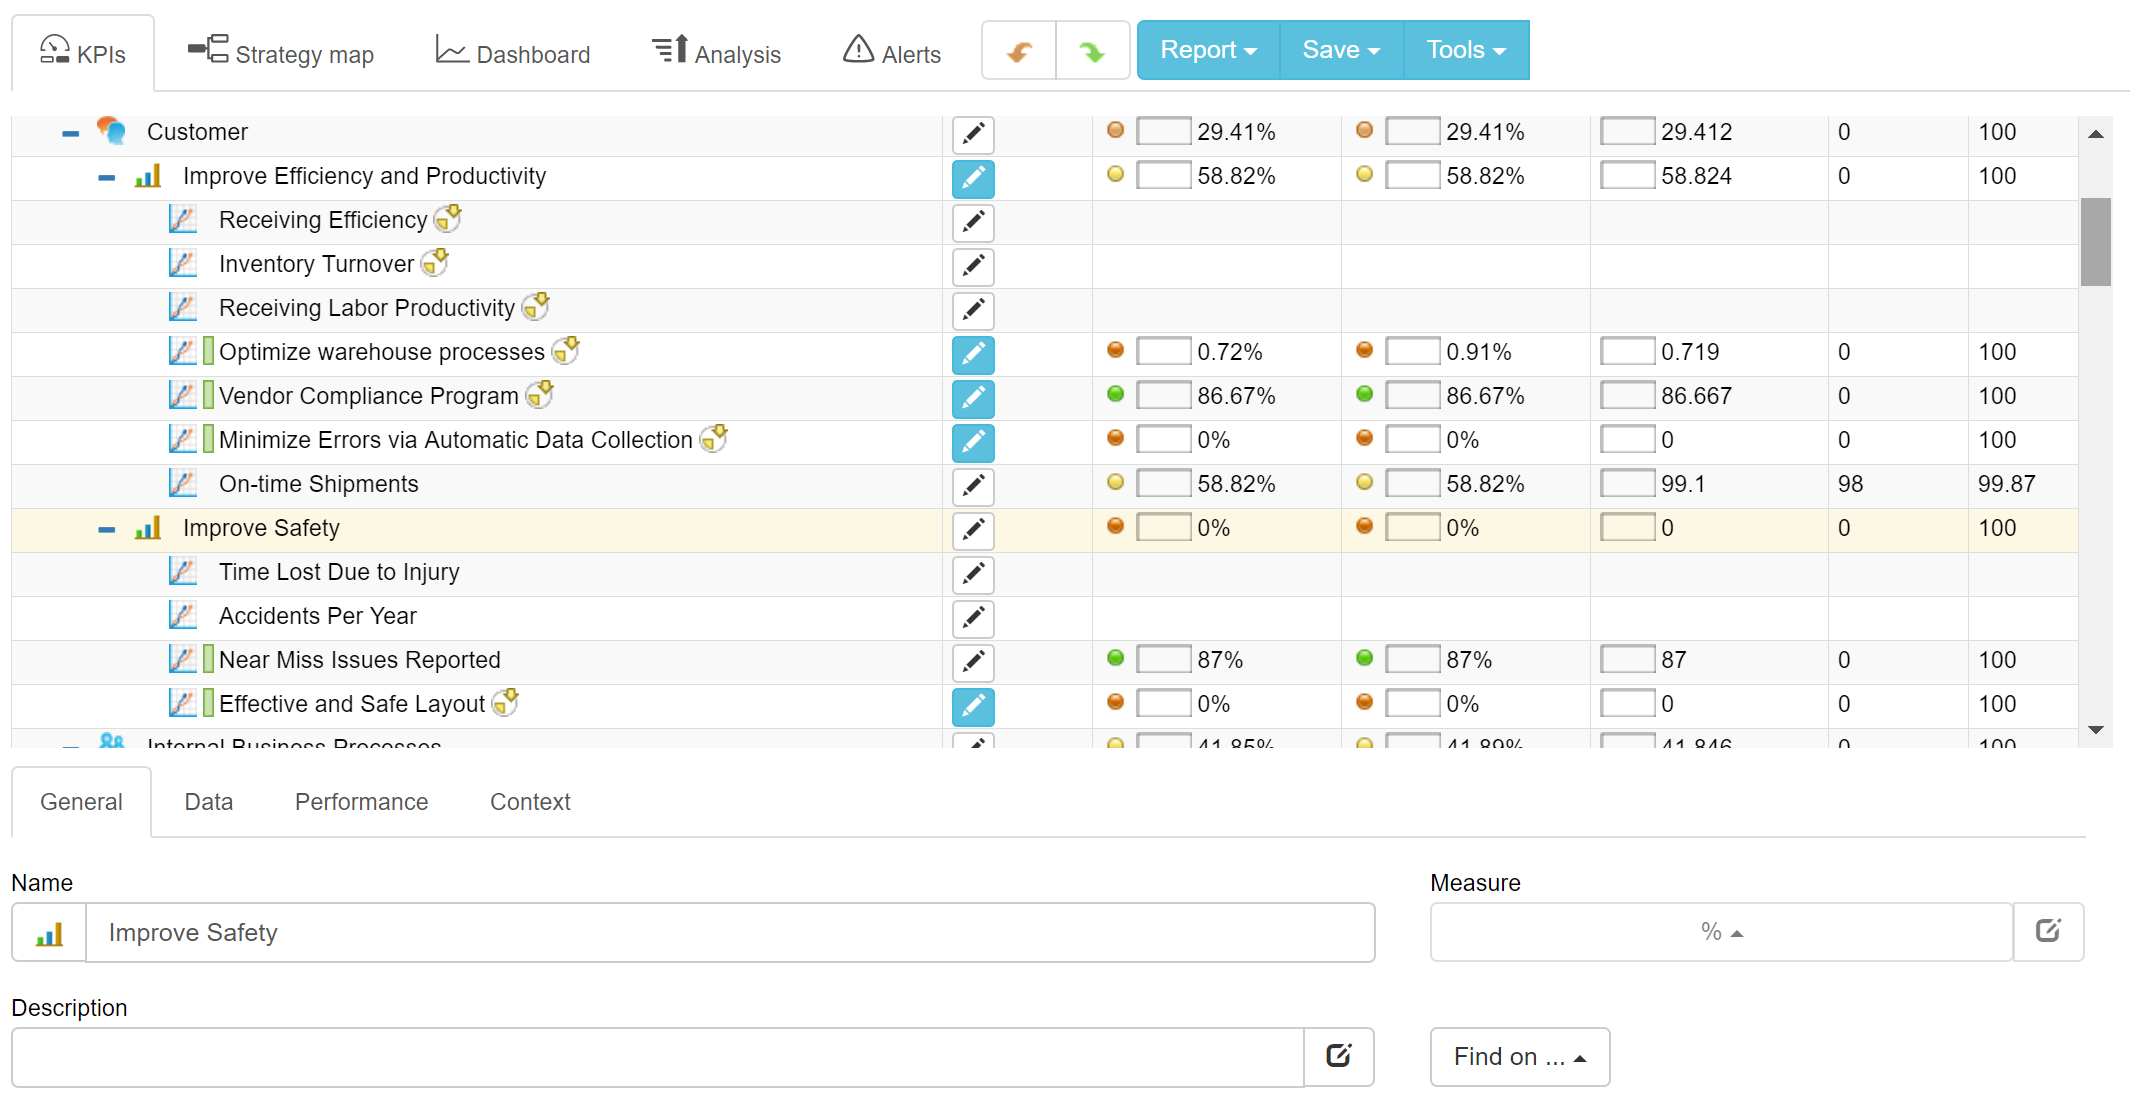
There are two goals to map in the Customer perspective:
- Improve Efficiency and Productivity
- Improve Safety
Business goal: Improve Efficiency and Productivity
Metrics:
- Receiving Efficiency
- Inventory Turnover
- Receiving Labor Productivity
Possible initiatives:
- Omni-channel fulfillment centers
Business goal: Improve Safety
Metrics:
- Time lost due to injury
- Accidents per year
- Near miss issues reported
Internal Perspective
The goals of the internal perspective are supposed to answer the question: “How are we going to satisfy the needs of our stakeholders?” The improvements might be focused on the goals discussed in this section.
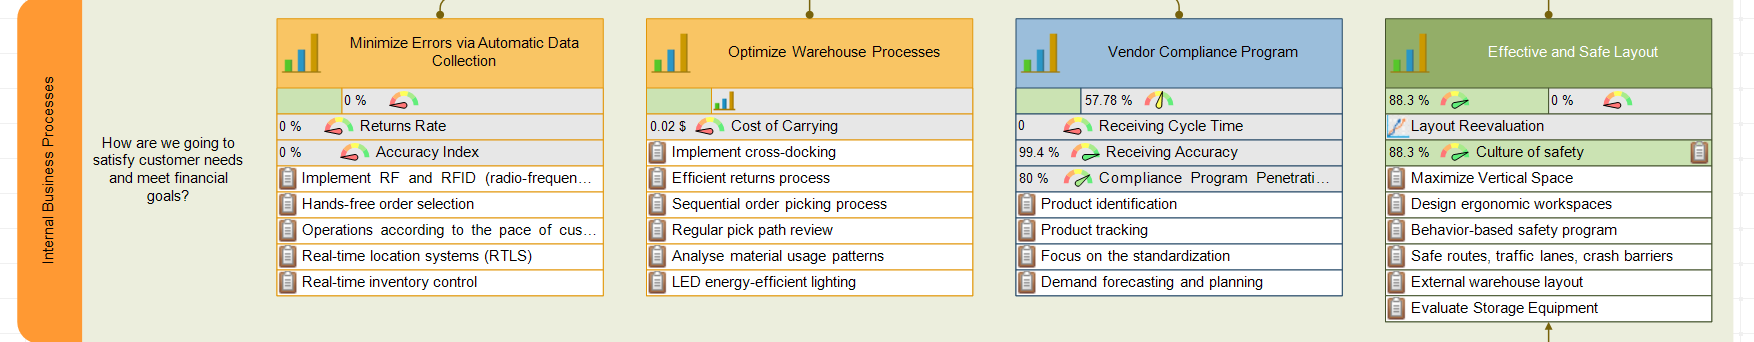
Minimize Errors via Automatic Data Collection
Metrics:
- Returns rate
- Accuracy Index (as measured according to accuracy indexes on all steps of the warehousing process)
The weights of the indicators that form the accuracy index can be equal or can be adjusted to the current strategy, for example, by giving a Shipping Accuracy higher weight compared to other indicators.
Additional metrics should be introduced when specific initiatives are implemented.
Possible Initiatives:
- Implement RF and RFID (radio-frequency identification)
- Hands-free order selection
- Operations according to the pace of customer demand
- Real-time location systems (RTLS)
- Real-time inventory control
The next business goal is:
Optimize warehouse processes
It can be validated by many effectiveness and utilization indicators.
A good measurement option is this general indicator:
- Cost of Carrying. Cents per dollar spent on inventory overhead.
Improvement initiatives to consider:
- Implement cross-docking
- Efficient returns process
- Sequential order picking process
- Regular pick path review
- Analyse material usage patterns
- LED energy-efficient lighting
Among the stakeholders, we have suppliers/vendors.
A business goal related to these stakeholders can be formulated as:
Vendor Compliance Program
The metrics in this case might be:
- Receiving Cycle Time. Time for Delivery / Total Number of Deliveries
- Receiving Accuracy
- Compliance Program Penetration Rate
The initiatives that can be implemented within a vendor compliance goal:
- Product identification
- Product tracking
- Focus on standardization
- Demand forecasting and planning
Finally, the “Safety” goal from the Customer perspective is supported by:
Effective and Safe Layout goal
The measurement part in this case can be formulated by two metrics:
- Leading metric “Culture of safety” that quantifies the lagging performance of the respective goal from the “Learning perspective.”
- Lagging metric “Layout Reevaluation” that should be aligned with a detailed plan to revise warehouse layout to optimize for effectiveness and safety.
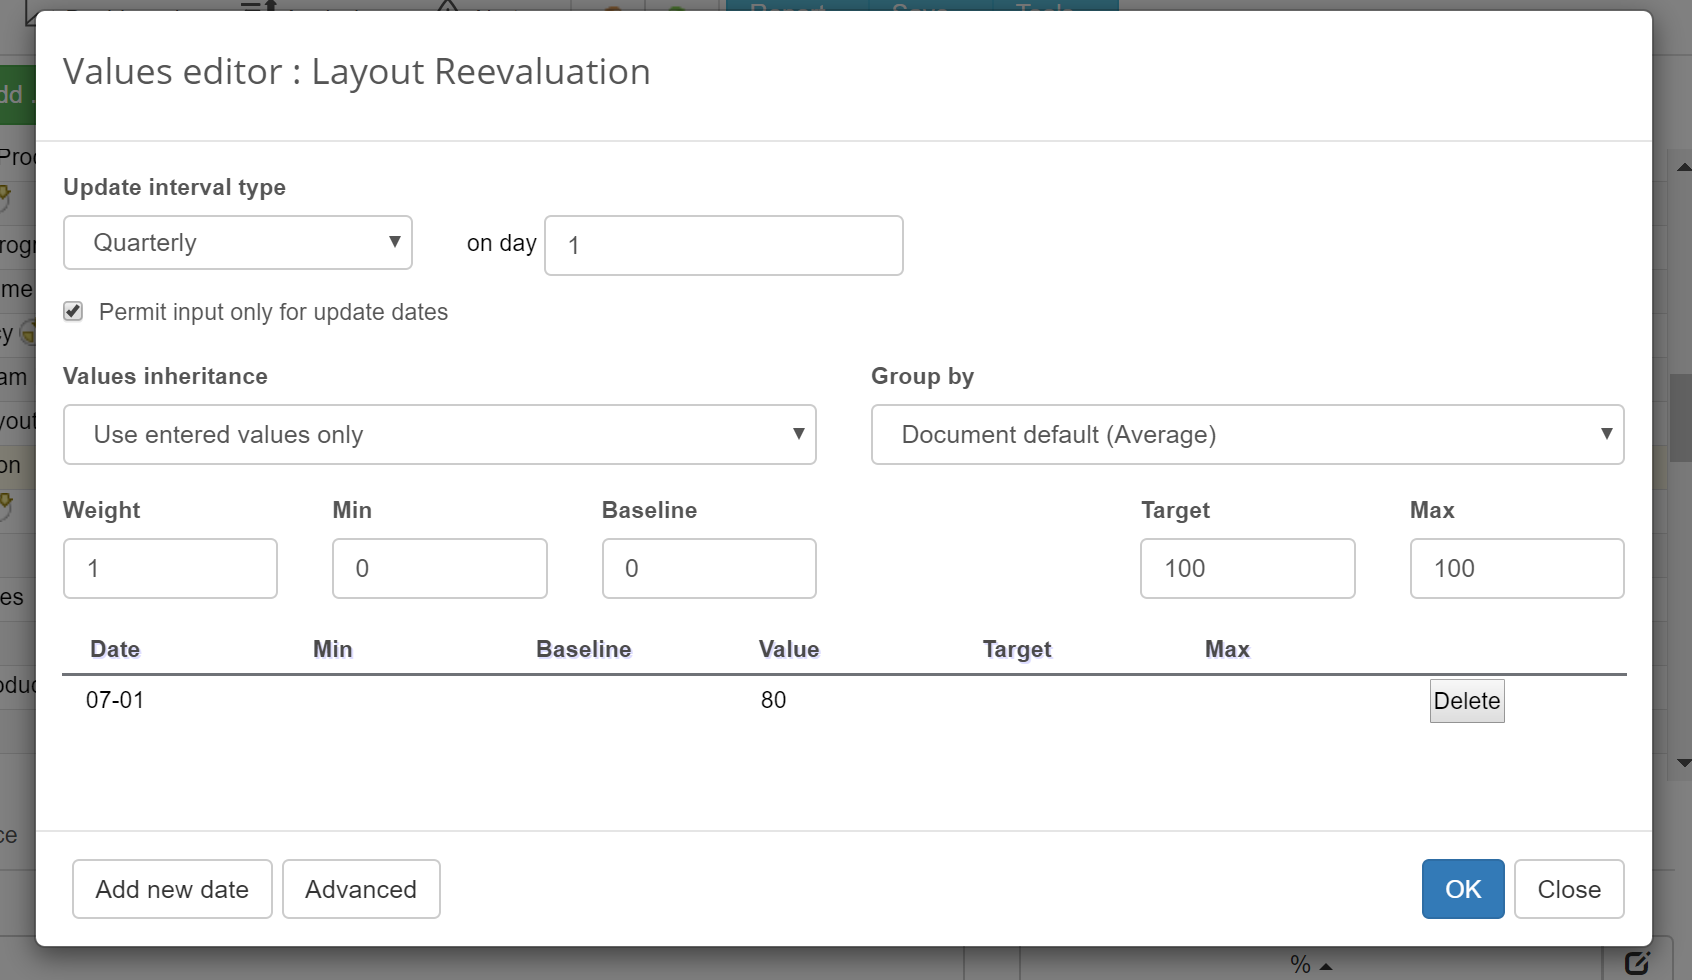
The Layout Reevaluation should be programmed to be updated with a certain period of time depending on the type of the products stored. In this example, it is updated Quarterly. Obviously, the value of this indicator cannot be inherited from the previous evaluations, and to reflect this, I’ve picked the “Entered values” option in BSC Designer software.
Effective and safe layout goal can be further supported with various improvement initiatives:
- Maximize vertical space
- Design ergonomic workspaces
- Behavior-based safety program
- Safe routes, traffic lanes, crash barriers
- External warehouse layout
- Evaluate storage equipment
Learning and Growth Perspective
In the learning perspective, we need to map goals that will help to focus learning efforts. What information about the stakeholders will help to make better decisions? What IT infrastructure will help to serve warehouse stakeholders better? What changes in management can lead to achieving internal goals?
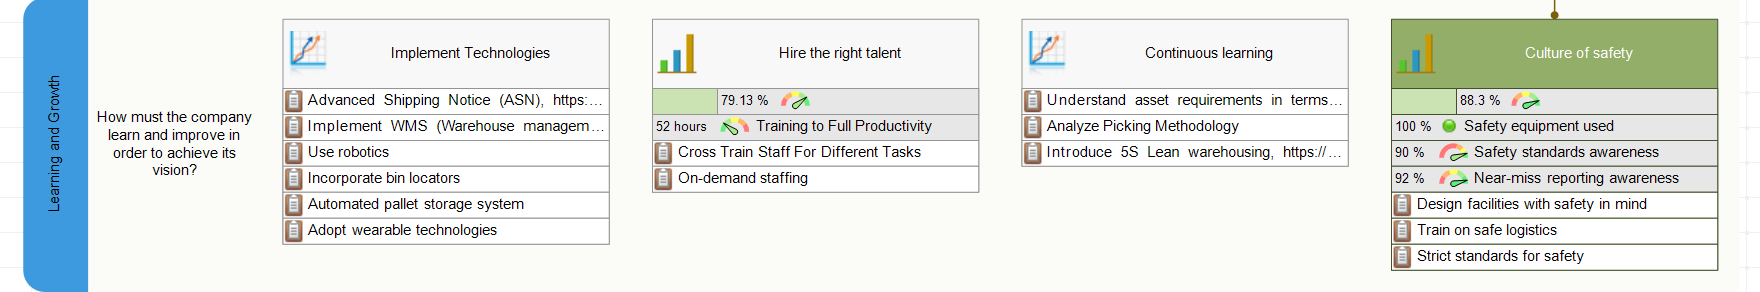
The pillars of learning perspective are:
- Hiring the right staff
- Continuous learning
- Culture
- Technologies
Let’s review these goals one by one.
Implement Technologies goal
This goal helps to leverage warehouse growth and effectiveness by focusing on the emerging technologies. Here are possible initiatives to consider:
- Implement Advanced Shipping Notice (ASN)
- Implement WMS (Warehouse management system)
- Use robotics
- Incorporate bin locators
- Automated pallet storage system
- Adopt wearable technologies
A general IT scorecard will also be useful.
The next goal is:
Hire the right talent
Looking beyond obvious training challenges, two initiatives might add value to the warehouse effectiveness and safety:
- Cross Train Staff For Different Tasks
- On-demand staffing
Obviously, any talent-related goals should be supported by proper training.
On this warehouse strategy map the training goal is formulated as continuous learning.
Continuous learning
Possible initiatives are:
- Understand asset requirements in terms of infrastructure and equipment
- Analyze Picking Methodology
- Introduce 5S Lean Warehousing
Finally, the keystone of warehouse safety is Culture of safety with these initiatives aligned:
- Design facilities with safety in mind
- Train on safe logistics
- Strict standards for safety
The measurement part, in this case, can be represented by these metrics:
- Safety equipment used
- Safety standards awareness
- Near-miss reporting awareness
Final Word
A warehouse today should adapt to the fast pace of stock turnaround, new technological and logistical challenges.
In this article, we discussed the basic process metrics that will help to achieve excellence in warehouse operations, as well as an example of a strategy map template that will help to align warehouse strategy with the overall needs of the organization.
Infographic
- Follow our
 Strategy Implementation System to align stakeholders, strategic ambitions, and business frameworks into a comprehensive strategy.
 - Automate strategic planning with BSC Designer by organizing goals, initiatives, risks, and KPIs into scorecards.
More About Strategic Planning


- Frazelle, E., 2002, World-class Warehousing and Material Handling, McGraw-Hill, New York ↩
- DC Measures Annual Survey & Report ↩
![]() CEO | Author | Speaker
CEO | Author | Speaker
BSC Designer is strategy execution software that enhances strategy formulation and execution through tangible KPIs. Our proprietary strategy implementation system reflects our practical experience in the strategy domain.
Muy buena publicación de KPI, con esto reforzare mis conocimientos en logística