![]() Let BSC Designer check the quality of your KPI scorecard. The software will analyze your KPI scorecard automatically and suggest some improvements.
Let BSC Designer check the quality of your KPI scorecard. The software will analyze your KPI scorecard automatically and suggest some improvements.
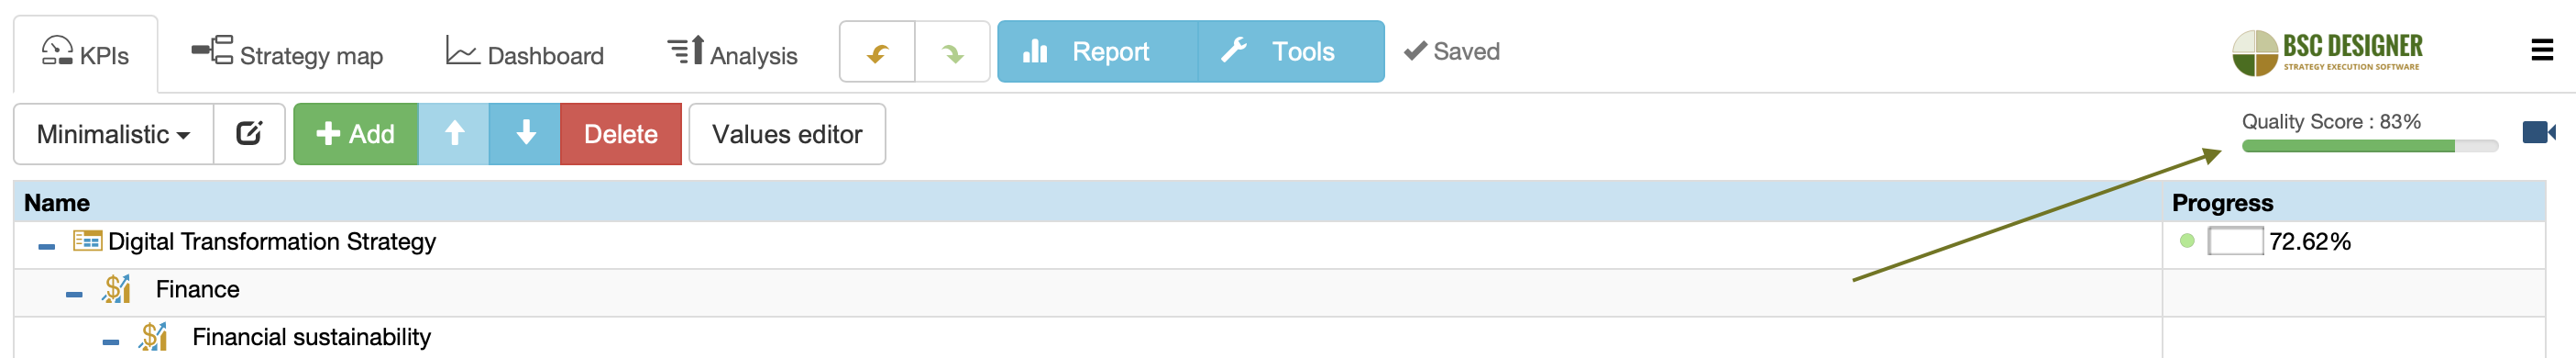
How to Get Quality Score Calculated
To use the KPI Scorecard Audit, follow these steps:
- Sign into your account at BSC Designer or create a free one
- Create a scorecard or open an existing one
- Check the quality score data on the toolbar and click on it for more information
How can I improve my KPI scorecard?
Here are the suggestions based on automated analysis of your KPI scorecard.
Recommendation: Map Your Improvement Ideas as Business Goals
Business goals are building blocks of any strategy (see step 3 of the strategic planning process). Formulate hypotheses that you plan to work on and add them to the appropriate perspective of a scorecard.
- Switch to the
 KPIs tab
 - Select any perspective
- Click the Add button
- Enter the goal’s detail in the fields below
Recommendation: Add KPIs to Make Your Strategy More Tangible
KPIs or Key Performance Indicators help to make the goals more specific. Align indicators with your goals to track their performance.
- Select a business goal
- Click the Add button
- Specify the name of the indicator
Recommendation: Add Leading Indicators to Quantify the Success Factors
While lagging indicators validate the achieved results, leading indicators are linked to success factors and track your efforts towards reaching the goal.
- Select a business goal
- Click the Add button
- Switch to the Context tab
- Change the type of indicator to leading
Tip: BSC Designer can calculate separately leading (quantified efforts) and lagging (quantified outcomes) performance.
Recommendation: Add Action Plans to the Strategic Goals
Add initiatives to your goals. Specify action plans, status, progress indicator, budgets, timelines, and persons responsible.
- Select a business goal
- Click Initiatives
- Enter the details of an initiative
- Click OK
Recommendation: Identify Risks
Add risk definitions with risk mitigation plans to the strategic objectives.
- Select a business goal
- Click Initiatives
- Select Risk in the type list
- Enter the details of a risk and risk mitigation plan
- Click OK
Recommendation: Specify Current Value of the Indicators
Start filling in your scorecard with data. You can enter data manually, import it from Excel, or use external data sources.
- Select an indicator
- Select a date in the internal calendar
- Switch to the Data tab
- Enter the numerical value into the Value field
Adjust the setting for value inheritance to tell the software if the values should be inherited from the previous period or if only specifically entered values should be used.
Recommendation: Show how the KPI changes over time
Select a date in the calendar on the right and enter the value for the indicator for that date. Remember to specify update interval first.
- Select an indicator
- Select a new date in the calendar
- Switch to the Data tab
- Update the new value in the Value field
Use the Values Editor as an alternative way to view and enter data.
Recommendation: Enter the Target or Expected Value of the Indicator
BSC Designer uses the current value, baseline and target to calculate the progress of the indicator.
- Select an indicator
- Switch to the Data tab
- Enter the value in the Target
Recommendation: Specify Relevant Weight of the Indicators
Relevant weight shows the importance of the indicator compared to the importance of other indicators in the same branch.
- Select an indicator
- Switch to the Performance tab
- Enter the value in the Weight
The software will also calculate the absolute weight, e.g., the weight that takes into account the weight of the item and its parent items.
Recommendation: Specify Measurement Units
BSC Designer supports quantitative ($, %, the number of…), qualitative (excellent, good, average), and binary (yes/no) measurement units.
- Select an indicator
- Switch to the General tab
- Select measurement units in the Measure drop list
Recommendation: Add the Description to the Indicators
What is this indicator for? How do you plan to get its value? Specify this information in the description field.
- Select an indicator
- Switch to the General tab
- Enter relevant information in the Description field
Recommendation: Decomposition of the goals
Make goals more specific by doing decomposition: adding sub-goals and KPIs of additional levels.
- Select a goal or an indicator
- Click the Add button to add a sub-goal or an indicator
- Repeat the steps until you can quantify the value created for the stakeholders
Tip: use the “Shift + N” and “N” keyboard shortcuts to create the sub-goals faster.
Recommendation: Define Strategic Themes for Your Goals
Strategic themes are the pillars of your strategy. They work as a first filter for new ideas. They also make a strategy map more readable.
- Double click on a business goal
- Switch to the Context tab
- Select the appropriate strategic theme
You can define your own strategic themes and their expected results.
Recommendation: Add Mission Statement to Your Strategy
What is your mission? What is inspiring your team? Add mission statement to your strategy map.
- Switch to the KPIs tab
- Select the root element
- Define the mission statement below
You can also define strategy attributes for a specific scorecard or define them globally (see ![]() > Settings > Strategy).
> Settings > Strategy).
Recommendation: Link Goals by Cause and Effect Links
Strategy is built on coherent goals. Use the link tool to show on your strategy map how different goals support each other.
- Select the Link tool on the toolbar
- Connect two different goals
- Decide if you want the output of one goal to be an input of another
You can also add some graphical elements to explain the dependencies on your map.
Recommendation: Check the Cause-and-Effect Logic
The connection between the goals cannot skip a perspective. For example, a goal from the Learning perspective cannot impact the Customer perspective directly without passing through a goal in the Internal perspective.
- Find connections that break cause-and-effect logic
- Remove bad connections
Recommendation: Conduct a stakeholder analysis
Do a stakeholders analysis to understand the high-level needs of the interested parties.
- Switch to > Settings > Strategy
- Click the ‘New Analysis’ button
- Open the ‘Stakeholder Analysis’ template
- Click ‘Sync’ to transfer stakeholders from the template
Recommendation: Assign stakeholders to the goals
A good strategy focuses on the strategic ambitions of stakeholders.
Define stakeholders via ![]() > Settings > Strategy > Stakeholders.
> Settings > Strategy > Stakeholders.
- Select a goal that resonates with stakeholder ambitions
- Switch to the General tab
- Assign a stakeholder via the Owner property
Recommendation: Assign owners
Assign owners to the goals, indicators, and initiatives. Owners will gain access to the items, receive relevant notifications for updates, and see the items on their global dashboard.
- Add new users via > Users
- Select a goal or indicator
- Switch to the General tab below
- Use the Owner field to assign a user to the item
Recommendation: Monitor KPIs on the dashboard
Use the performance dashboard to monitor the state of key indicators, goals, and initiatives.
- Switch to the Dashboard tab
- Click Add to add a new diagram
- Select the KPI that will be a data source for a diagram
- Adjust settings and click OK to finish
Recommendation: Connect this scorecard with other scorecards
Connect/align various strategy and functional scorecards by context or by data. Use the outcomes of one scorecard as input for another and provide an explanation for the reasoning behind the goals.
- Open source and destination scorecards on different tabs
- Copy (Tools > Copy Indicator) relevant goal in the source scorecard
- Paste (Tools > Paste Indicator) in into the destination scorecard
- Link by context or by data
Recommendation: Add supporting documentation
Supporting documentation will help your strategy team understand and execute strategies more effectively.
- Select a goal or initiative
- Open the Description dialog for a goal or open the details of an initiative
- Upload relevant documents in the Documents section
Recommendation: Break down SMART goals into components.
SMART Goals such as “Improve customer satisfaction by 10% within a 1-year period by introducing innovative products” require decomposition into goal, metric, target, and initiative.
- Click the Initiatives button to add an action plan.
- Click the Add button to create a metric.
- Switch to the Data tab, and assign a target.
Recommendation: Organize KPIs into groups
Long lists of KPIs work better when similar KPIs are organized into groups.
- Create a grouping item.
- Drag and drop KPIs with similar context onto the grouping item.
Recommendation: Align of KPIs with initiatives
Quantify the initiatives using KPIs to track execution progress.
- Open the Initiatives dialog.
- Click on the ‘…’ button next to the aligned KPI field.
- Select an indicator that quantifies the initiative.
Looks like your KPI scorecard has all the necessary components!
- A scorecard with a 100% quality score is one of the evaluation criteria for the BSC Designer Specialist Certification. Learn more about our certification programs
What’s next?
- Use this checklist for an in-depth analysis of your strategy scorecard
- Use our implementation guide to scale from a single scorecard to a comprehensive strategy
- Contact the BSC Designer team if you need any help
- If you mastered the strategy design skill, then you can hide the quality score indicator via > Settings > Workflow
BSC Designer is strategy execution software that enhances strategy formulation and execution through KPIs, strategy maps, and dashboards. Our proprietary strategy implementation system guides companies in practical application of strategic planning.