 Use a template discussed in this article to conduct Pareto analysis for a strategy. Focus execution efforts on the strategic goals and performance indicators according to their absolute weight.
Here are the key topics of the article:
- Introduction – Pareto analysis and strategy.
- Template – Pareto analysis on the Strategy Map
- Hard data – quantitative Pareto analysis based on absolute weights
- Disadvantages – four risks of using “80/20” principle
Pareto Analysis and Strategy
“The essence of strategy is choosing what NOT to do.1“
Michael Porter
If we look at the business environment most organizations are working in, Porter’s statement about strategy will make perfect sense:
- The possible strategic hypothesis seems to be unlimited, while
- The resources of any organization have limits
A good strategy is many things, and one of them is understanding our priorities. We don’t have resources everywhere; a successful organization has to laser focus on a few important themes.
Pareto analysis can help us to focus on those few critical things that promise to generate most of the benefits.
Or, on the contrary, address those few challenges that cause us most of the problems.
Template: Pareto Analysis on the Strategy Map
On the comparison table of strategic planning frameworks, we categorized Pareto Analysis as a strategy formulation tool. Let’s see how we can apply Pareto analysis (or simply the 80/20 rule) to the different aspects of the organization’s strategy.
- We’ll use the perspectives of the strategy map as a starting template
- In each perspective, we’ll map examples of the challenges
- With each challenge, we’ll align an 80/20 guiding question
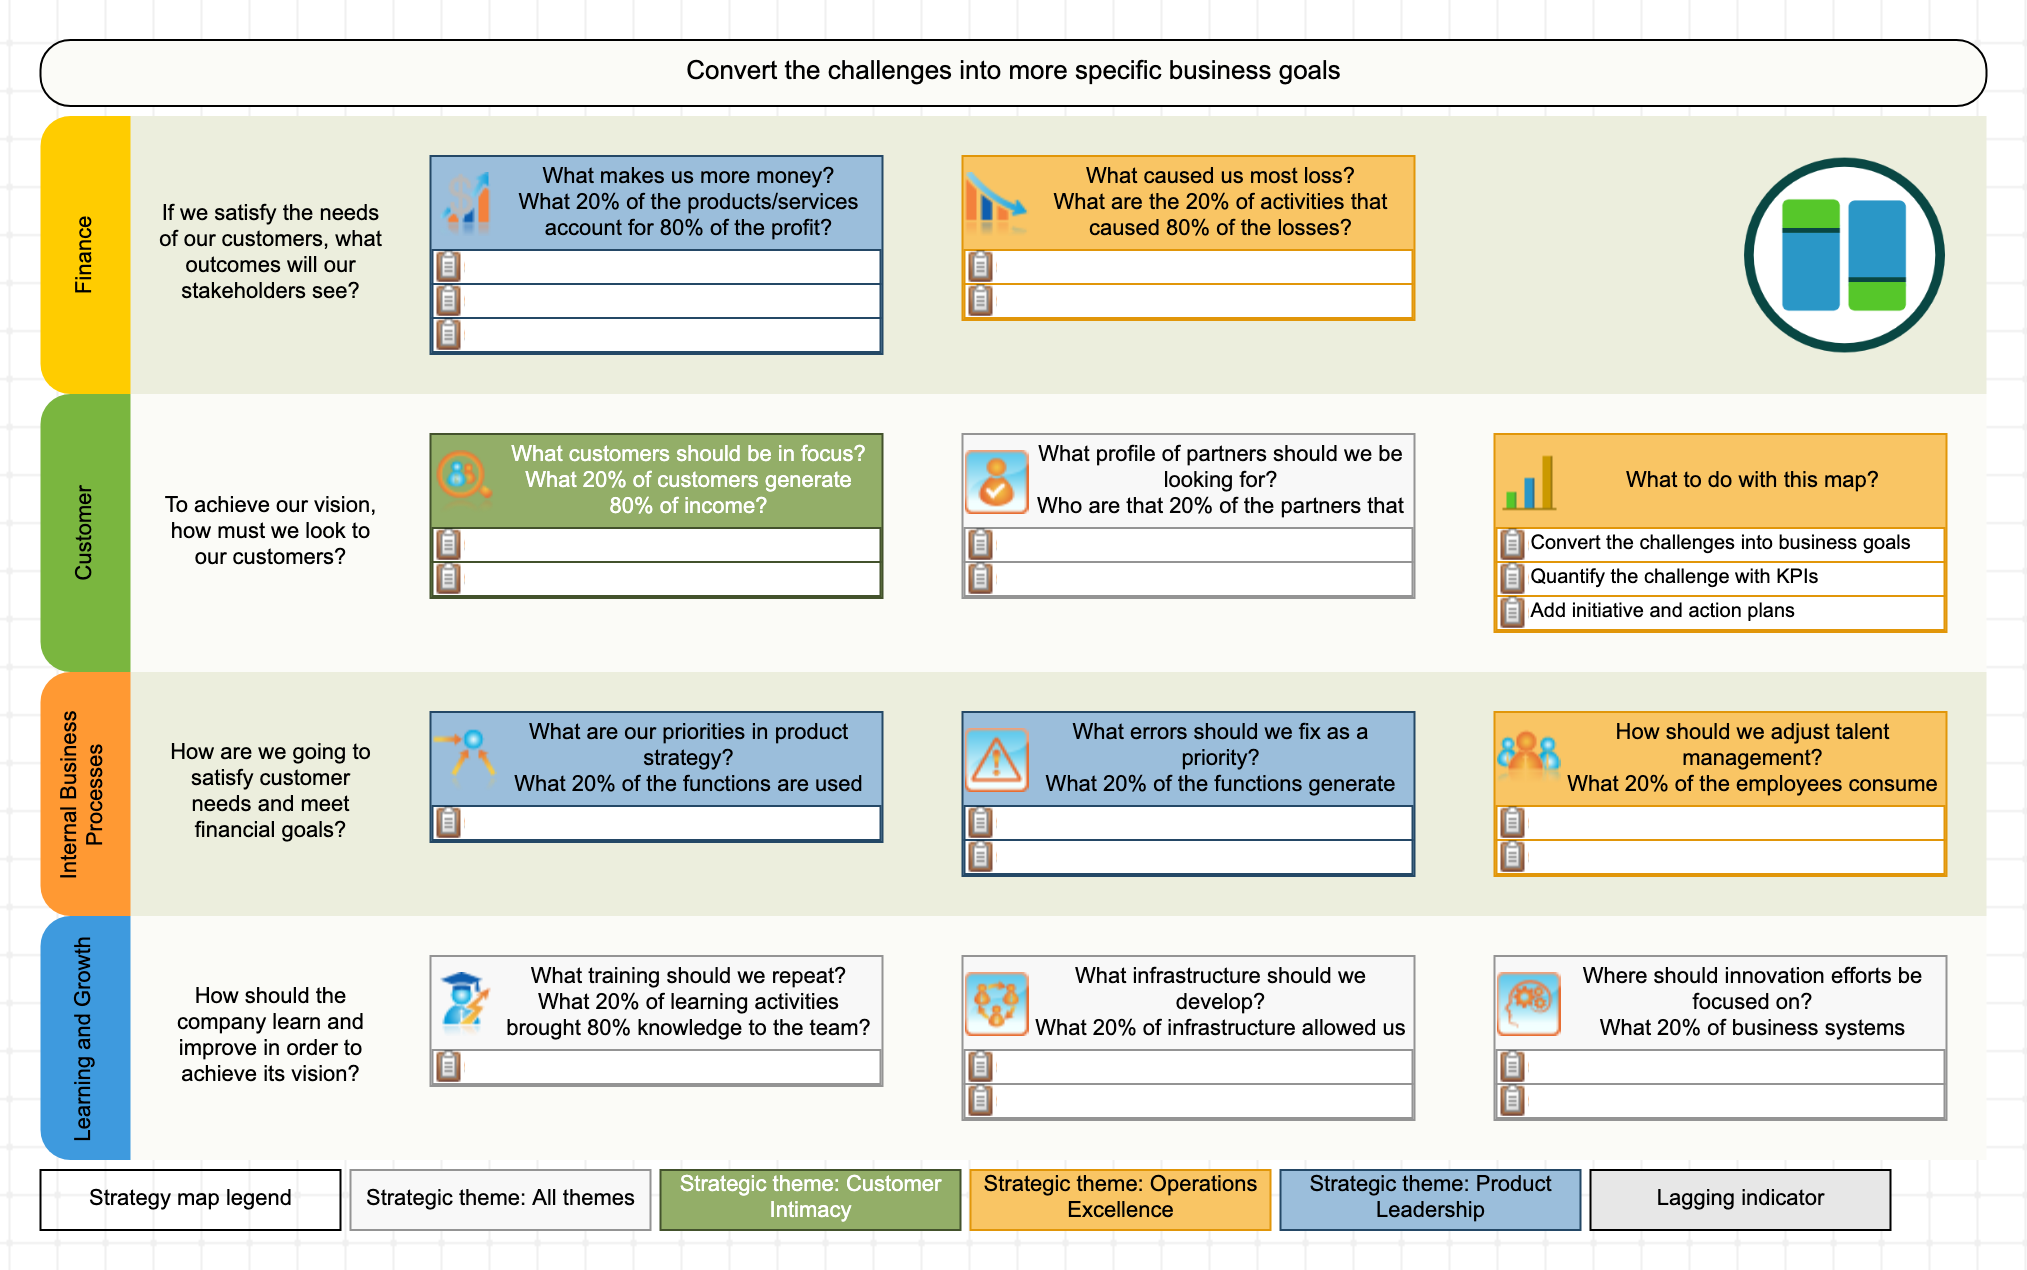
Finance
- What makes us more money? What 20% of the products/services account for 80% of the profit?
- What caused us most loss? What are the 20% of activities that caused 80% of the losses?
Customer service
- What customers should be in focus? What 20% of customers generate 80% of income?
- What profile of partners should we be looking for? Who are that 20% of the partners that generated us 80% of income?
Internal
- What are our priorities in product strategy? What 20% of the functions are used by 80% of the clients?
- What errors should we fix as a priority? What 20% of the functions generate 80% of complaints?
- How should we adjust talent management? What 20% of the employees consume 80% of the manager’s time? What 20% of the employees generated the most revenue?
Learning and Growth
- What training should we repeat? What 20% of learning activities brought 80% knowledge to the team?
- What infrastructure should we develop? What 20% of infrastructure allowed us to gain 80% of the benefits?
- Where should innovation efforts be focused on? What 20% of business systems generated 80% of the useful insights? Who were 20% of the staff that generated 80% of innovative ideas that proved to work?
What to do with this map?
- Convert the challenges into more specific business goals
- Find performance indicators to properly quantify the challenge
- Add initiative and action plans
Quantitative Pareto Analysis for a Strategy Scorecard
The results of Pareto analysis are often presented on a diagram where the causes are correlated with effects. Let’s use customer support for a SaaS solution as an example.
What are the reasons why people contact customer support?
- Asking for a temporary code – 40%
- Lost password questions – 20 %
- Need help to place an order – 13%
- Asking to schedule a live call – 10%
- Some function is not working as expected – 7%
- Asking about partnership 5%
- Other questions – 5%
A higher load of customer support results in higher costs for the business. What can we do about this? We can sort these cases by the frequency of occurrence and present them on the diagram. In this case, the Pareto analysis will tell us that we need to focus on temporary code issues first.
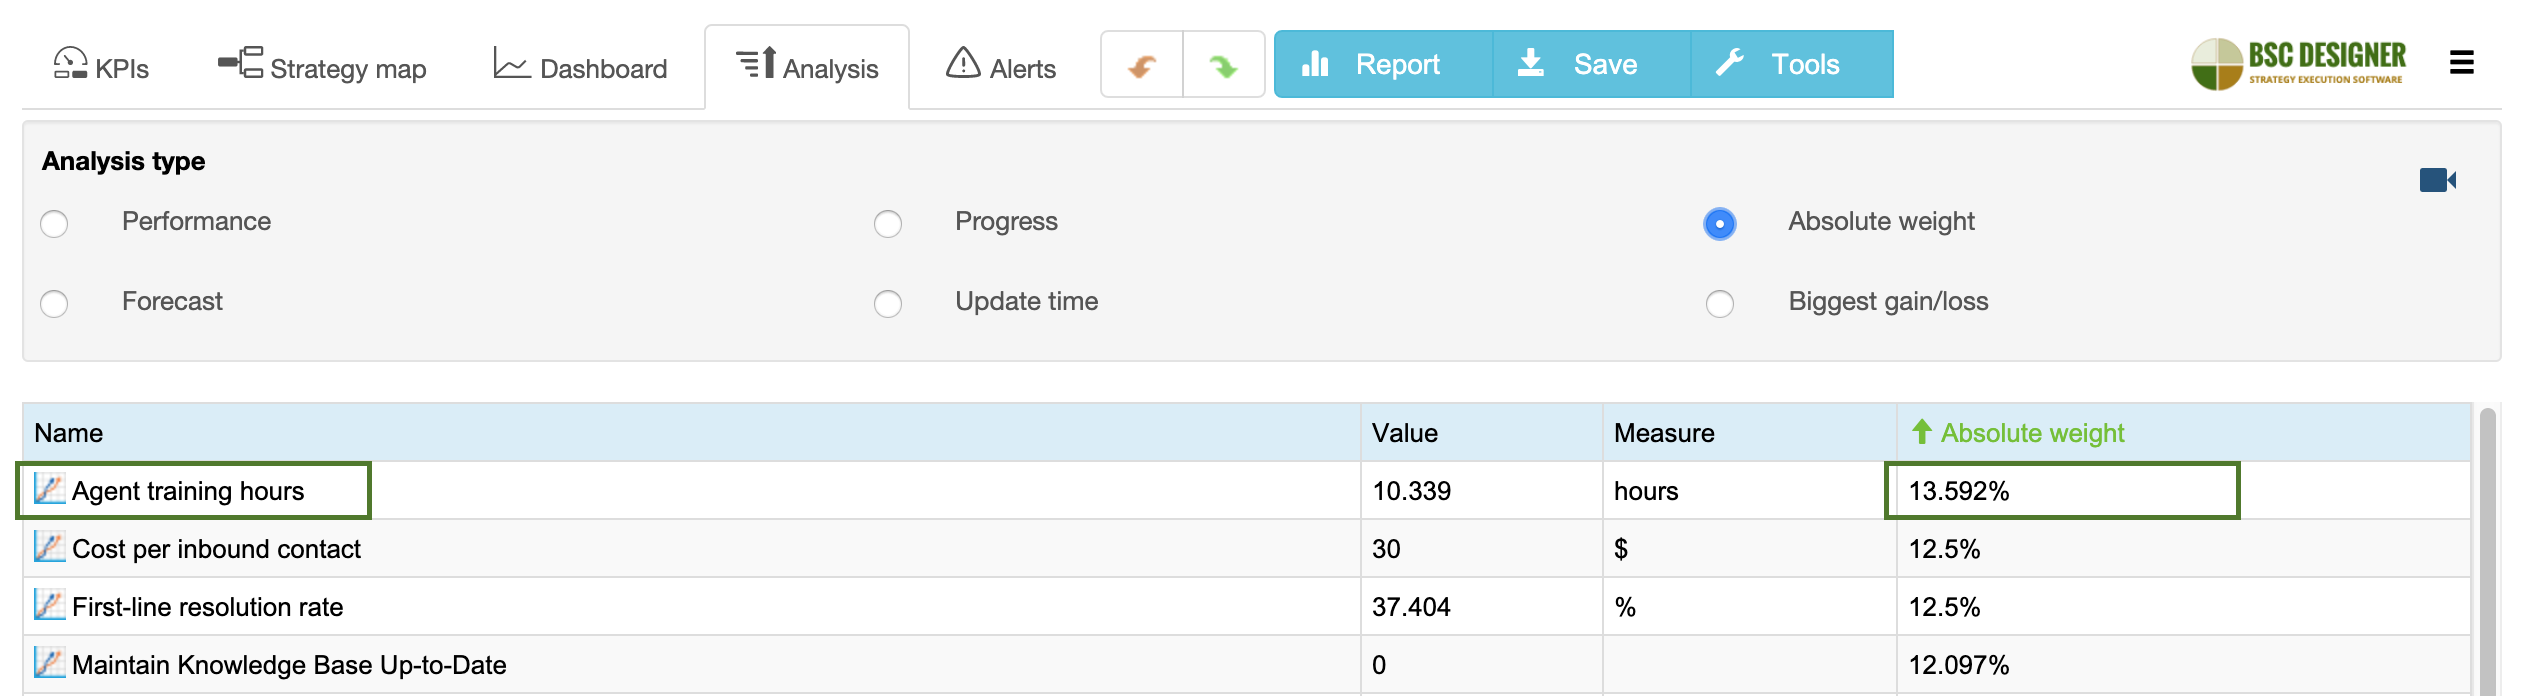
Similar to the cause/effect diagram, we can analyze a strategy scorecard and its goals/indicators based on the element’s absolute weight and element’s performance.
By absolute weight, we mean the relevant importance of the item calculated recursively using the information about the relative weight of elements on each level.
The performance of the goal or indicator is calculated using current values and some reference scale.
Similar to a classical Pareto diagram, we can sort the goals/indicators by their absolute weight, thus making the priorities clearer.
The biggest win will be achieved for the items with the highest absolute weight (=the highest impact on the overall performance) and the lowest performance (=there is a space for improvement).
If you are using automation software like our BSC Designer, then finding those items will be an easy task.
Let’s take the Customer Service scorecard as an example.
- Here we have an “Agent training hours” indicator that, according to the “Absolute weight” analysis, has one of the highest impacts on the overall scorecard performance.
- Also, looking at its performance data, we can see that its current performance is low, and there is a space for improvement.
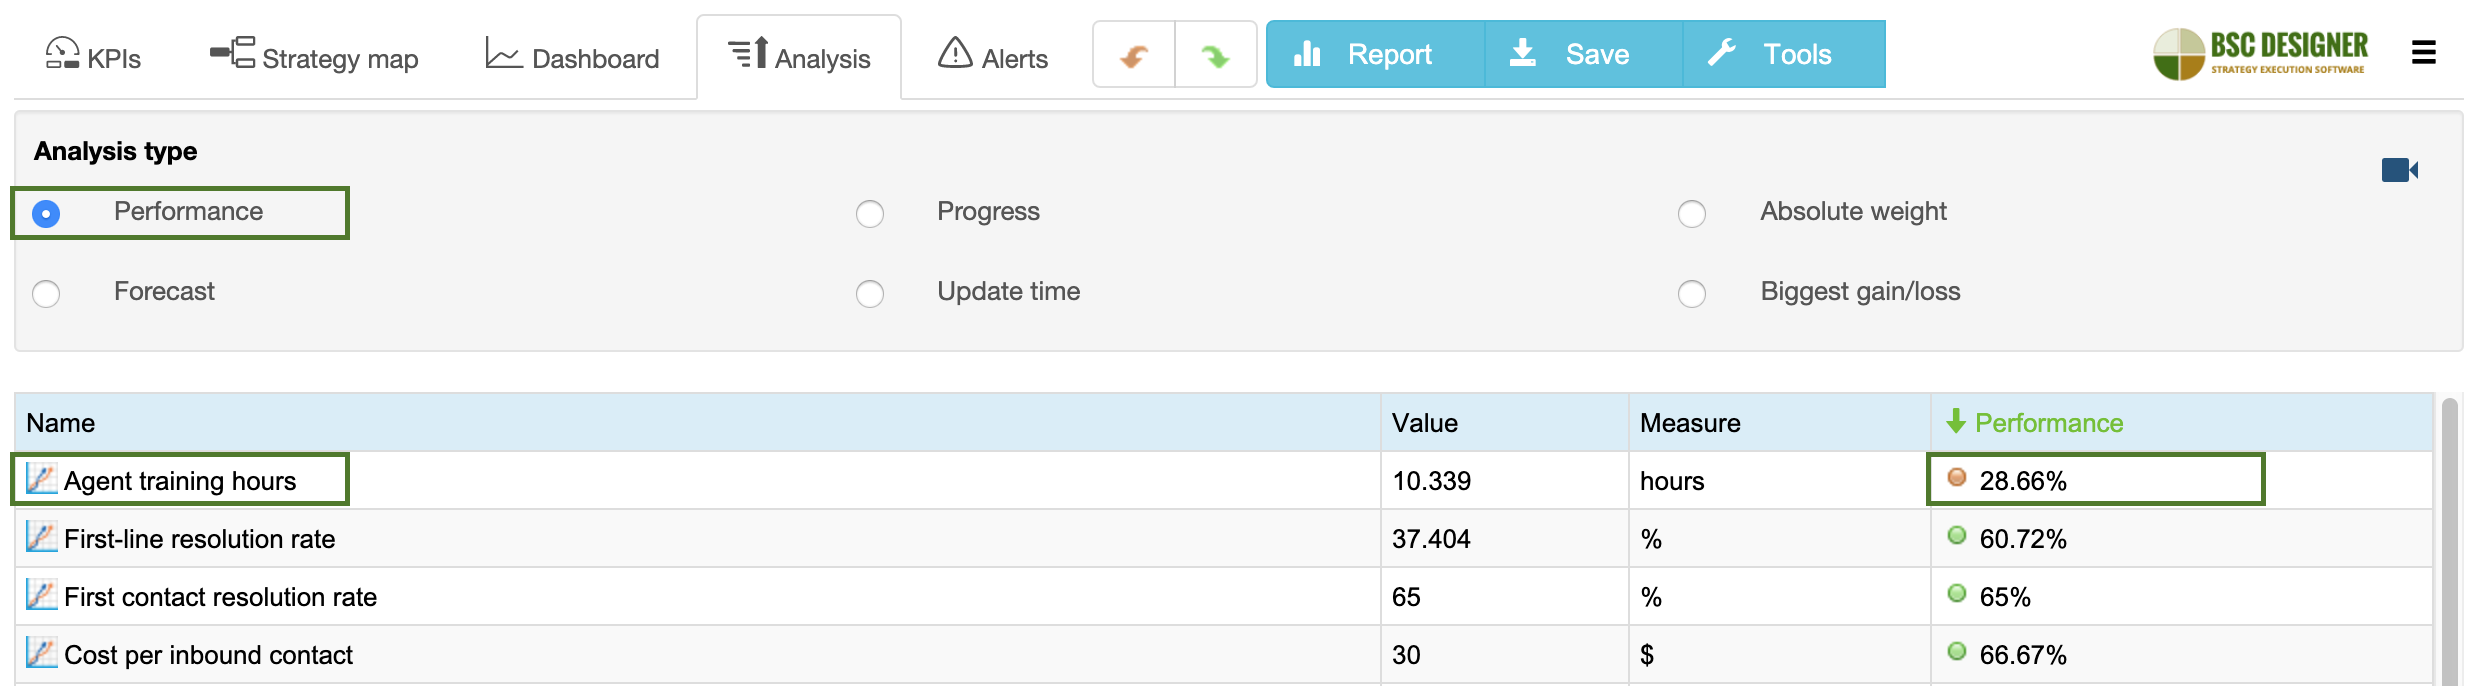
In this case, I would say that managers need to focus first on investing in agent training.
Risks and Disadvantages of Pareto Analysis
We discussed the advantages of the Pareto analysis, now let’s talk about possible risks:
Risk 1. Short-term thinking
We are at risk of developing short-term thinking.
For example, some innovations efforts require time. By applying the 20/80 rule, we might create an environment where only the innovations with short investment-results cycle will be approved. In the context of innovations, a more appropriate framework would be Three horizons.
Risk 2. Subjective Estimations
The efforts and results as subjective estimations.
We make an educated guess saying that “80% of revenue was generated by 20% of employees” – the invoicing tool doesn’t take into account a lot of nuances. Similar to the priority matrix, we can only imply what is urgent and what is important, probably it is not.
Risk 3. Subjective Root Case Analysis
We depend on the quality of the root cause analysis and the experience of our team.
For example, 20% of the product’s features that caused 80% of the complaints might be confused with a different problem on the level of the product’s architecture.
Risk 4. 80/20 won’t Help in a Gold Mine
While the 80/20 distribution might be confirmed, it doesn’t automatically mean that we know how to work with it.
Think about a gold mine, 20% of efforts might generate 80% of the results, but there is no simple way to do only the good 20%. In the business context, we might know that 80% of income was generated by 20% of high profile clients, but there might be no specific way to reach only those 20% high profile clients.
Conclusions
Pareto analysis is an easy to use prioritization tool. If you feel like your strategy has too many “priorities” or different business goals, use the “80/20” rule to focus your team’s efforts on the most promising challenges.
Use quantitative analysis of the goal/indicator weight and its performance to support your findings with hard data.
What's next?- Follow our
 Strategy Implementation System to align stakeholders, strategic ambitions, and business frameworks into a comprehensive strategy.
 - Automate strategic planning with BSC Designer by organizing goals, initiatives, risks, and KPIs into scorecards.
More About Strategic Planning


- “What is strategy?” Michael Porter, Harvard Business Review, 1996 ↩
![]() CEO | Author | Speaker
CEO | Author | Speaker
BSC Designer is strategy execution software that enhances strategy formulation and execution through tangible KPIs. Our proprietary strategy implementation system reflects our practical experience in the strategy domain.