Attending an event implies significant financial and time investments. Let’s discuss the metrics to track before, during, and after the event to maximize its positive impact on your business.
To calculate event ROI, we will analyse:
- Pre-Event Metrics. Building a scorecard for event analysis; picking the right events to attend. Learn more…
- During Event Metrics. Focusing networking and presentation skills on what matters. Learn more…
- Post-Event Metrics. Implementing findings, following up with event leads effectively. Learn more…
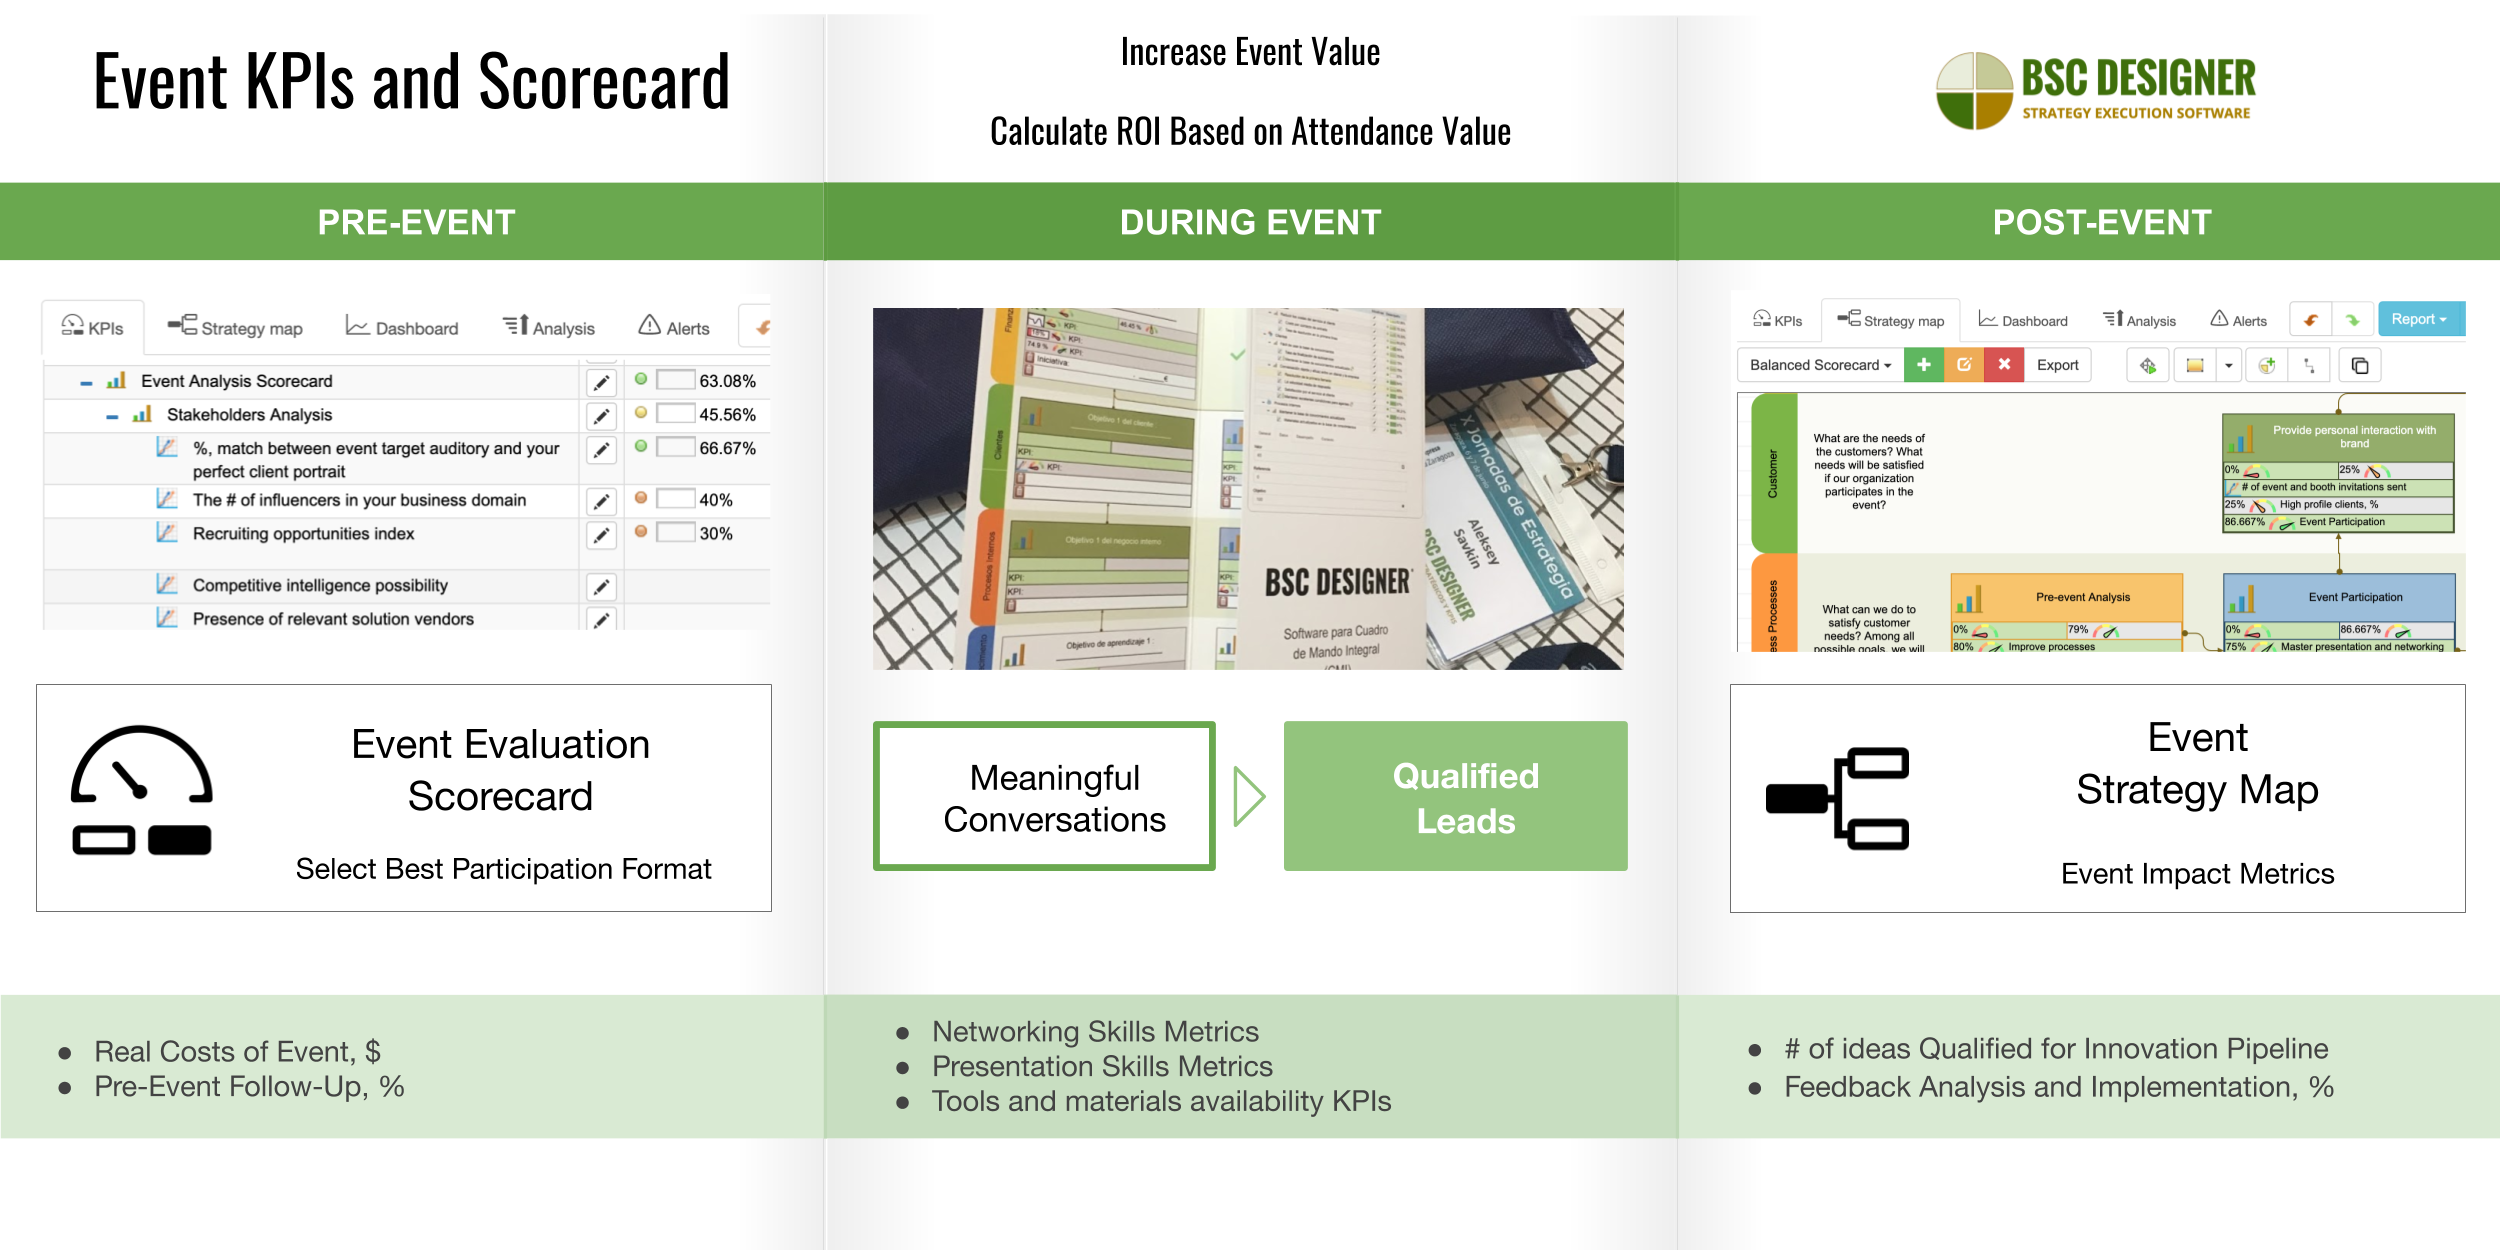
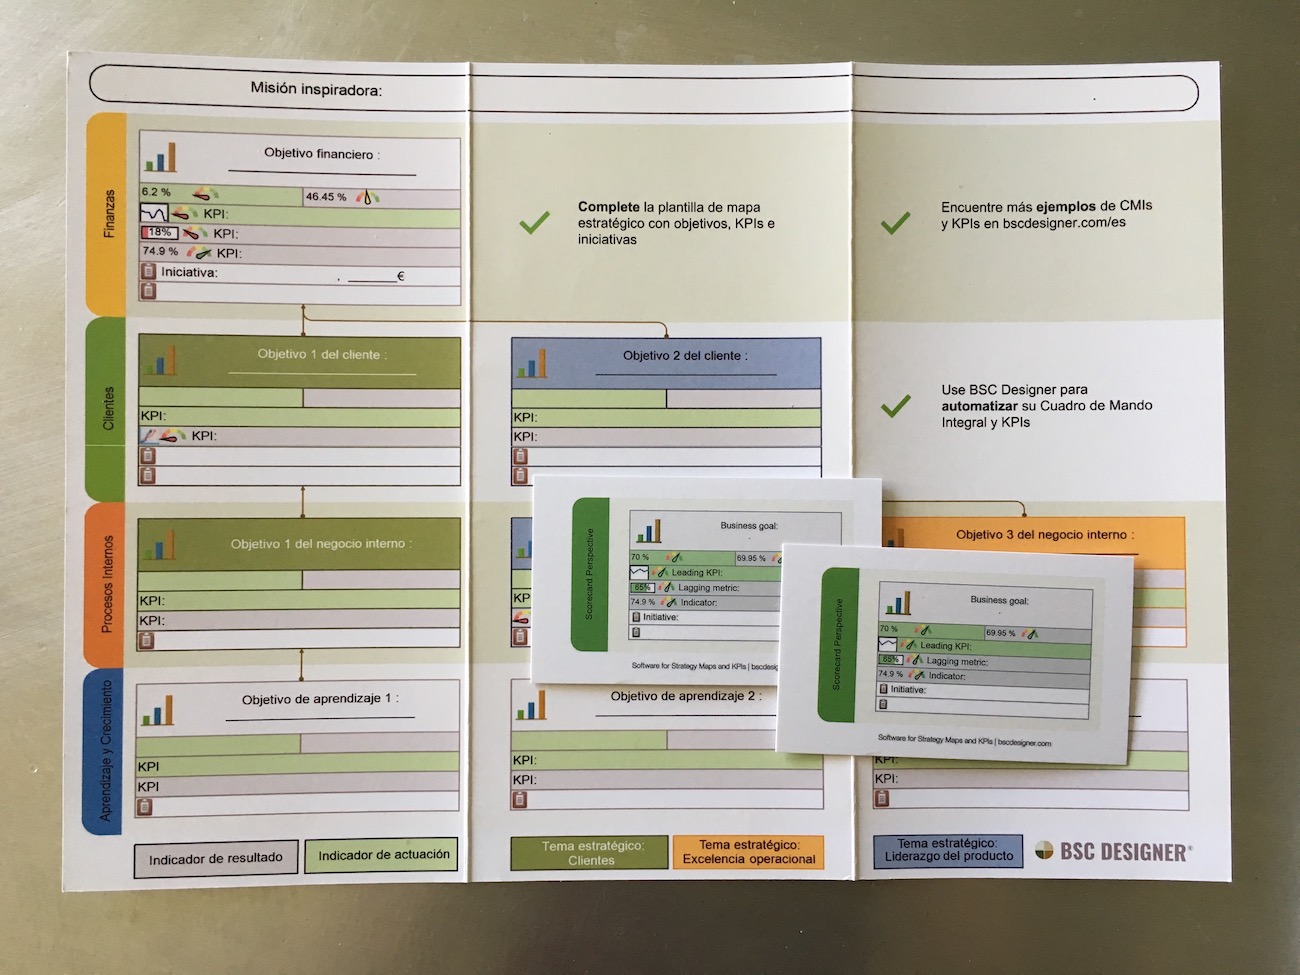
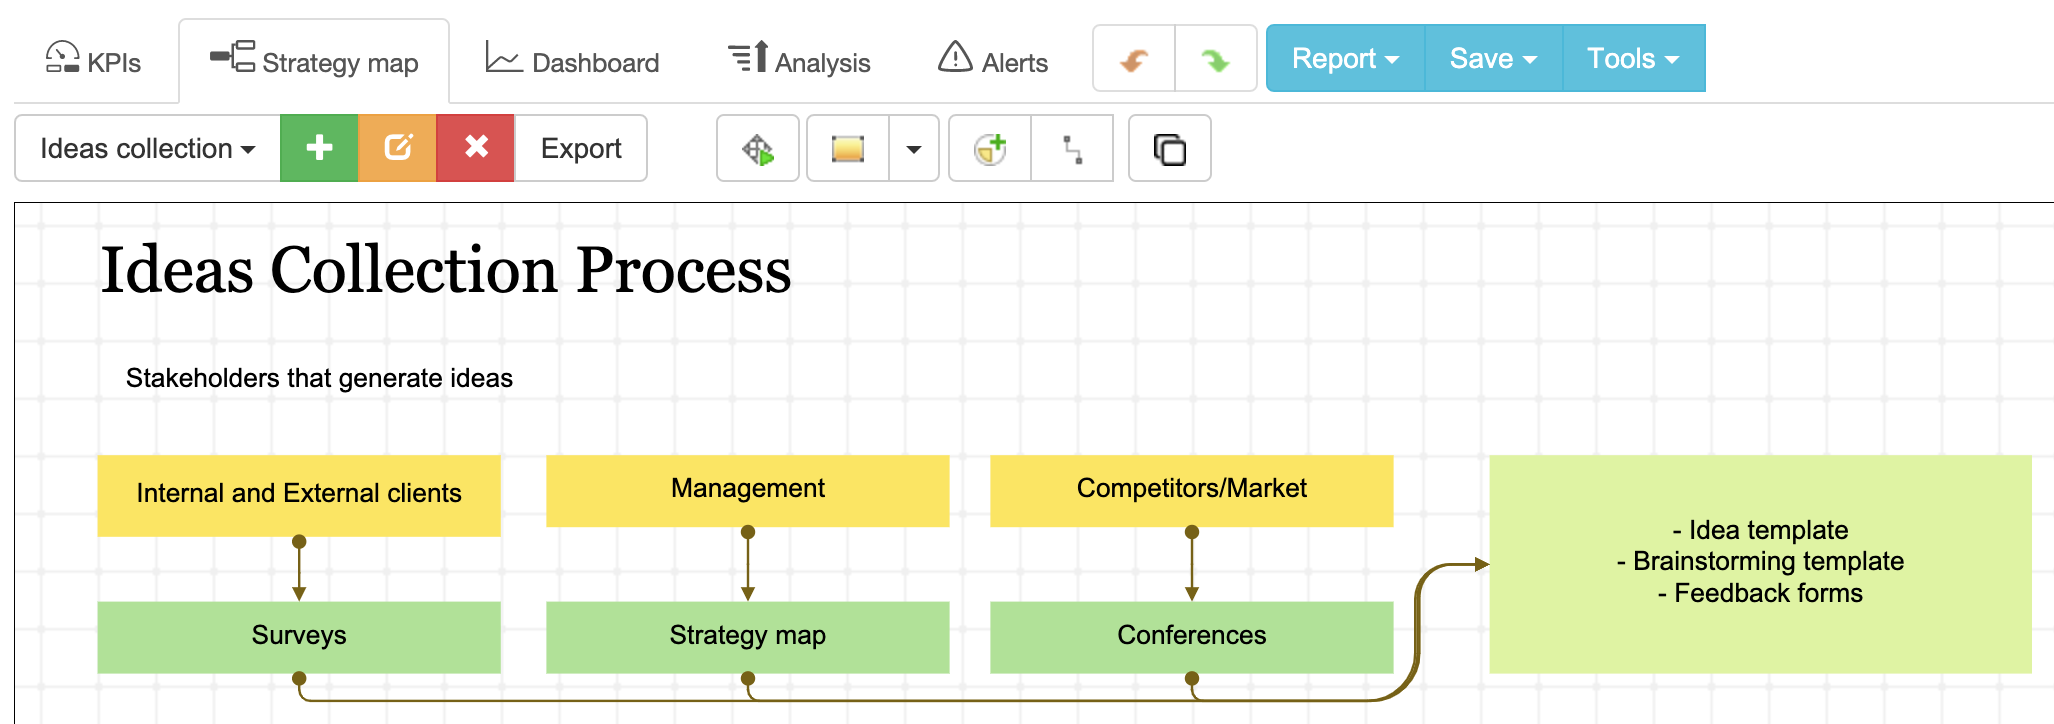
We will summarize ideas and KPIs on a one-page strategy map:
- Event Strategy. Having a coherent set of goals for the next event. Learn more…
1. Pre-Event Metrics
“Things are easier to measure when a system is measurable by design.” 10 Step KPI System book.
Instead of measuring the effectiveness of a conference or a trade show that has already passed, analyze the event participation opportunity beforehand. This approach will not only improve the estimation of the event’s effectiveness but increase our chances for success. Below are the factors to look at.
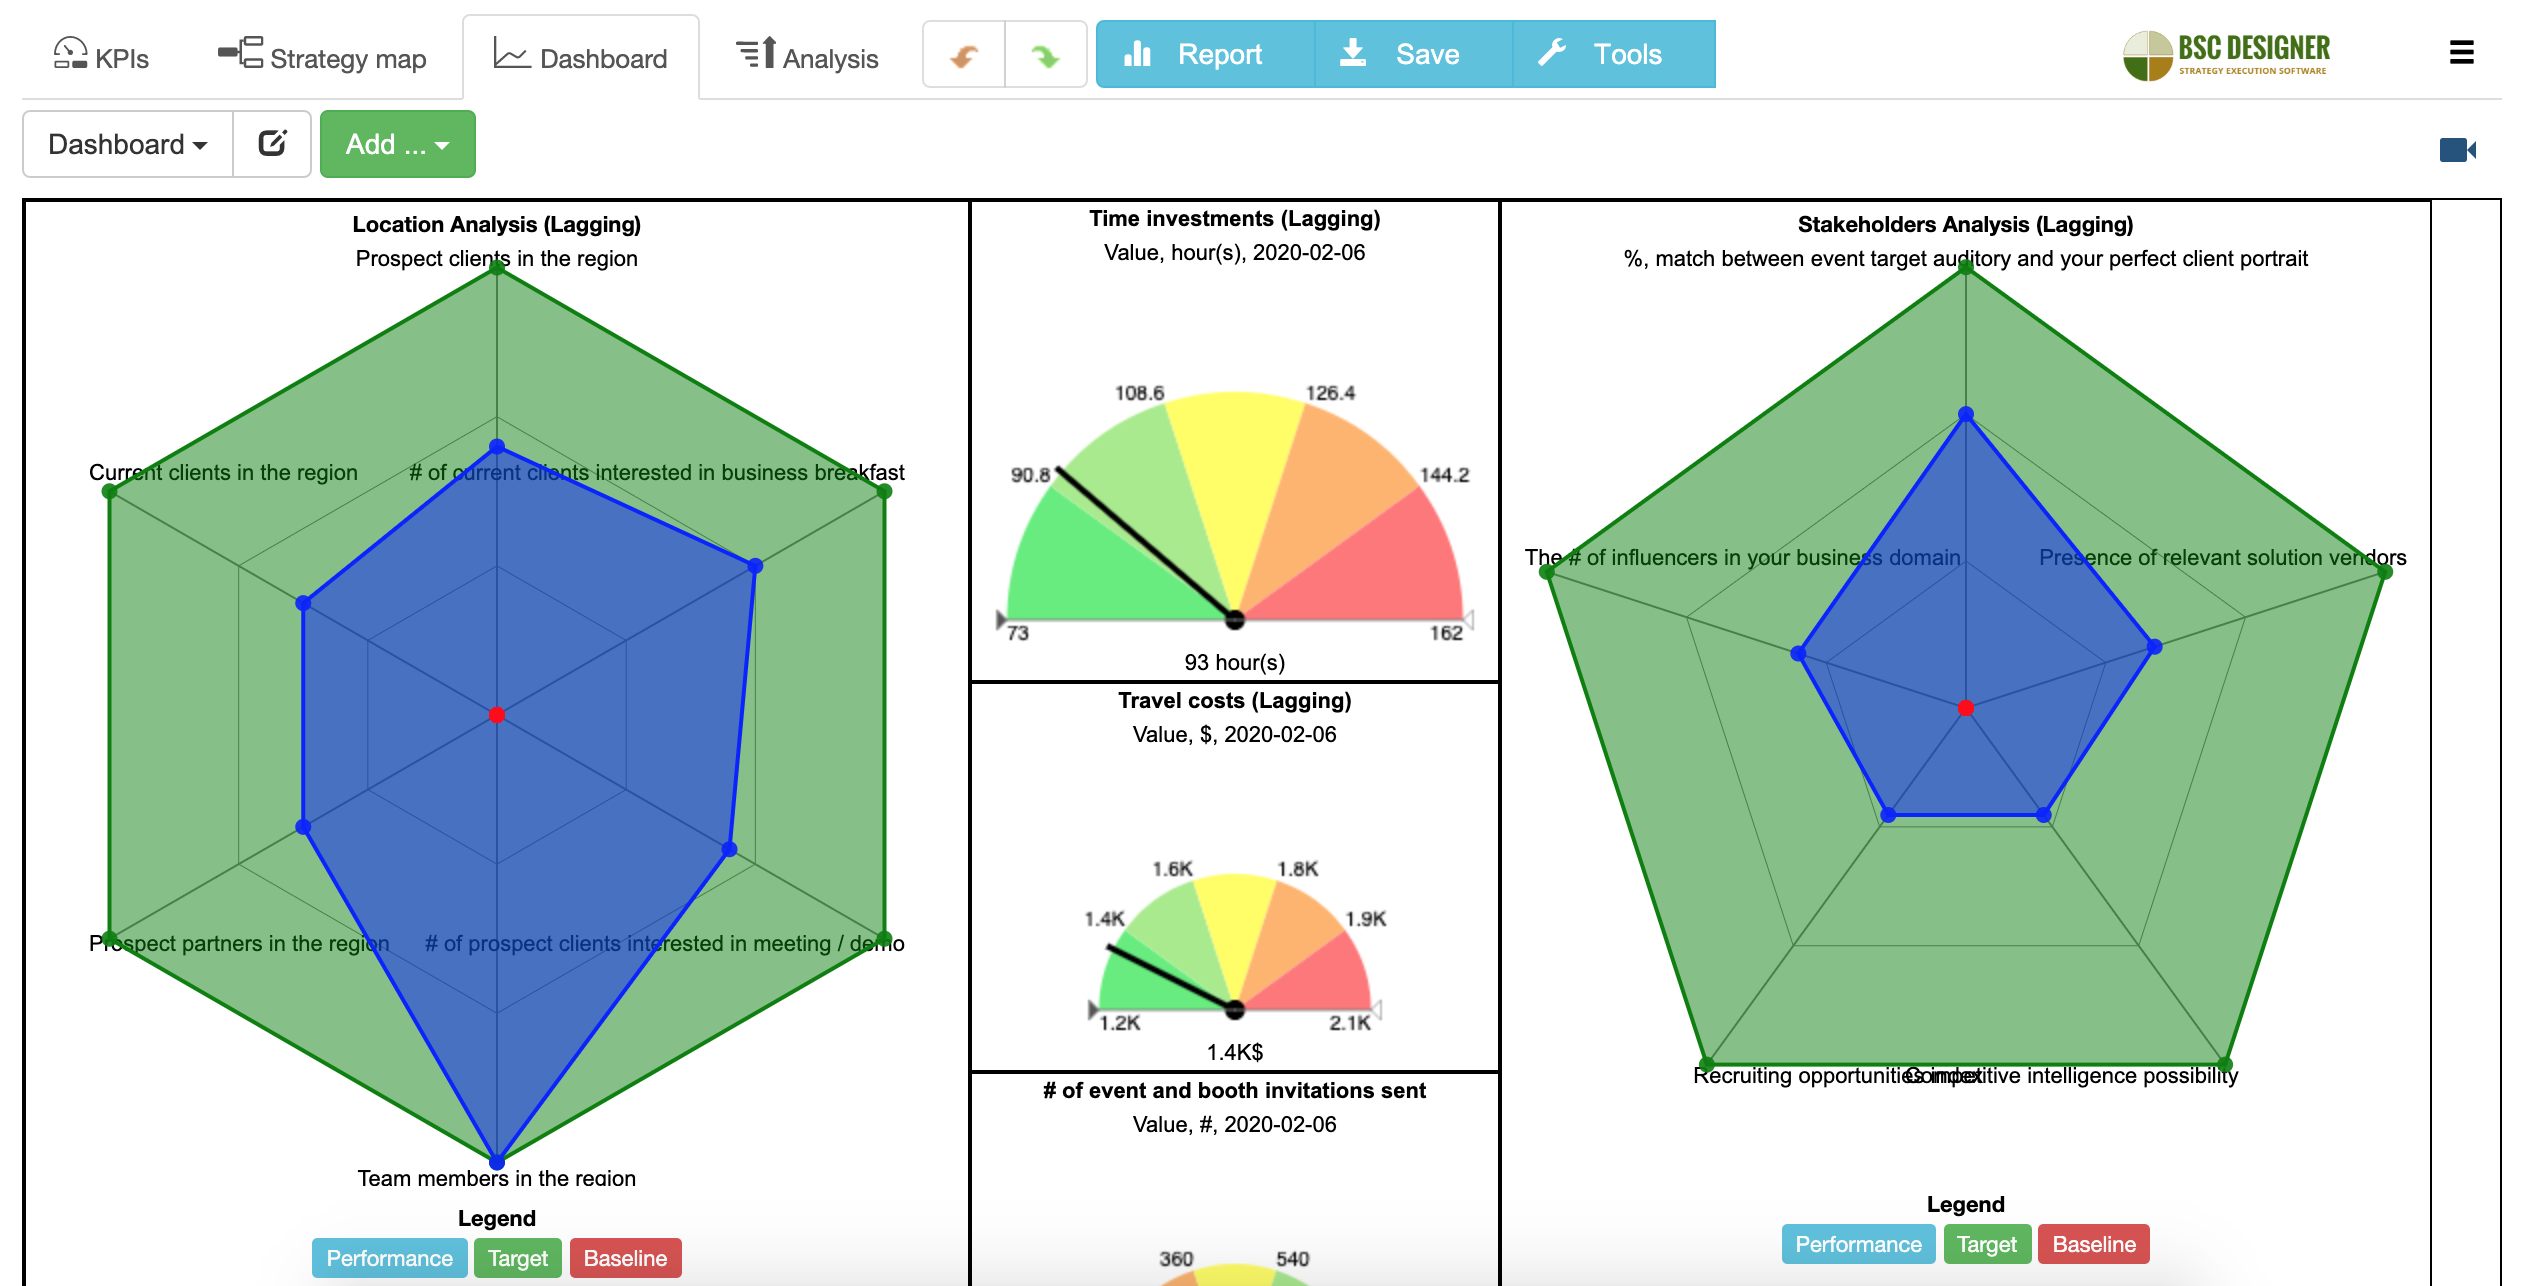
Stakeholders Analysis
- Visitors profile analysis. General demographic analysis. Will you meet your potential clients there? Look for a media/sponsor package with aggregated demographic information. Sometimes, you have access to the full list of participants (look for the event’s mobile App and event community in social networks).
- Speakers analysis. Who are they? What are their reasons to contribute (professional speakers, consultants, solution vendors)? What books/articles did they write? Do they run blogs/YouTube channel? Connect with them on LinkedIn.
- Recruiting opportunities. How do you estimate recruiting opportunities on this event? Finding talent during the event will impact your HR hiring metrics.
- Competitive intelligence opportunities. Will your competitors be there?
- Vendor sourcing. Will you meet vendors/contractors that provide solutions relevant to your challenges? Attending events can decrease the costs of procurement.
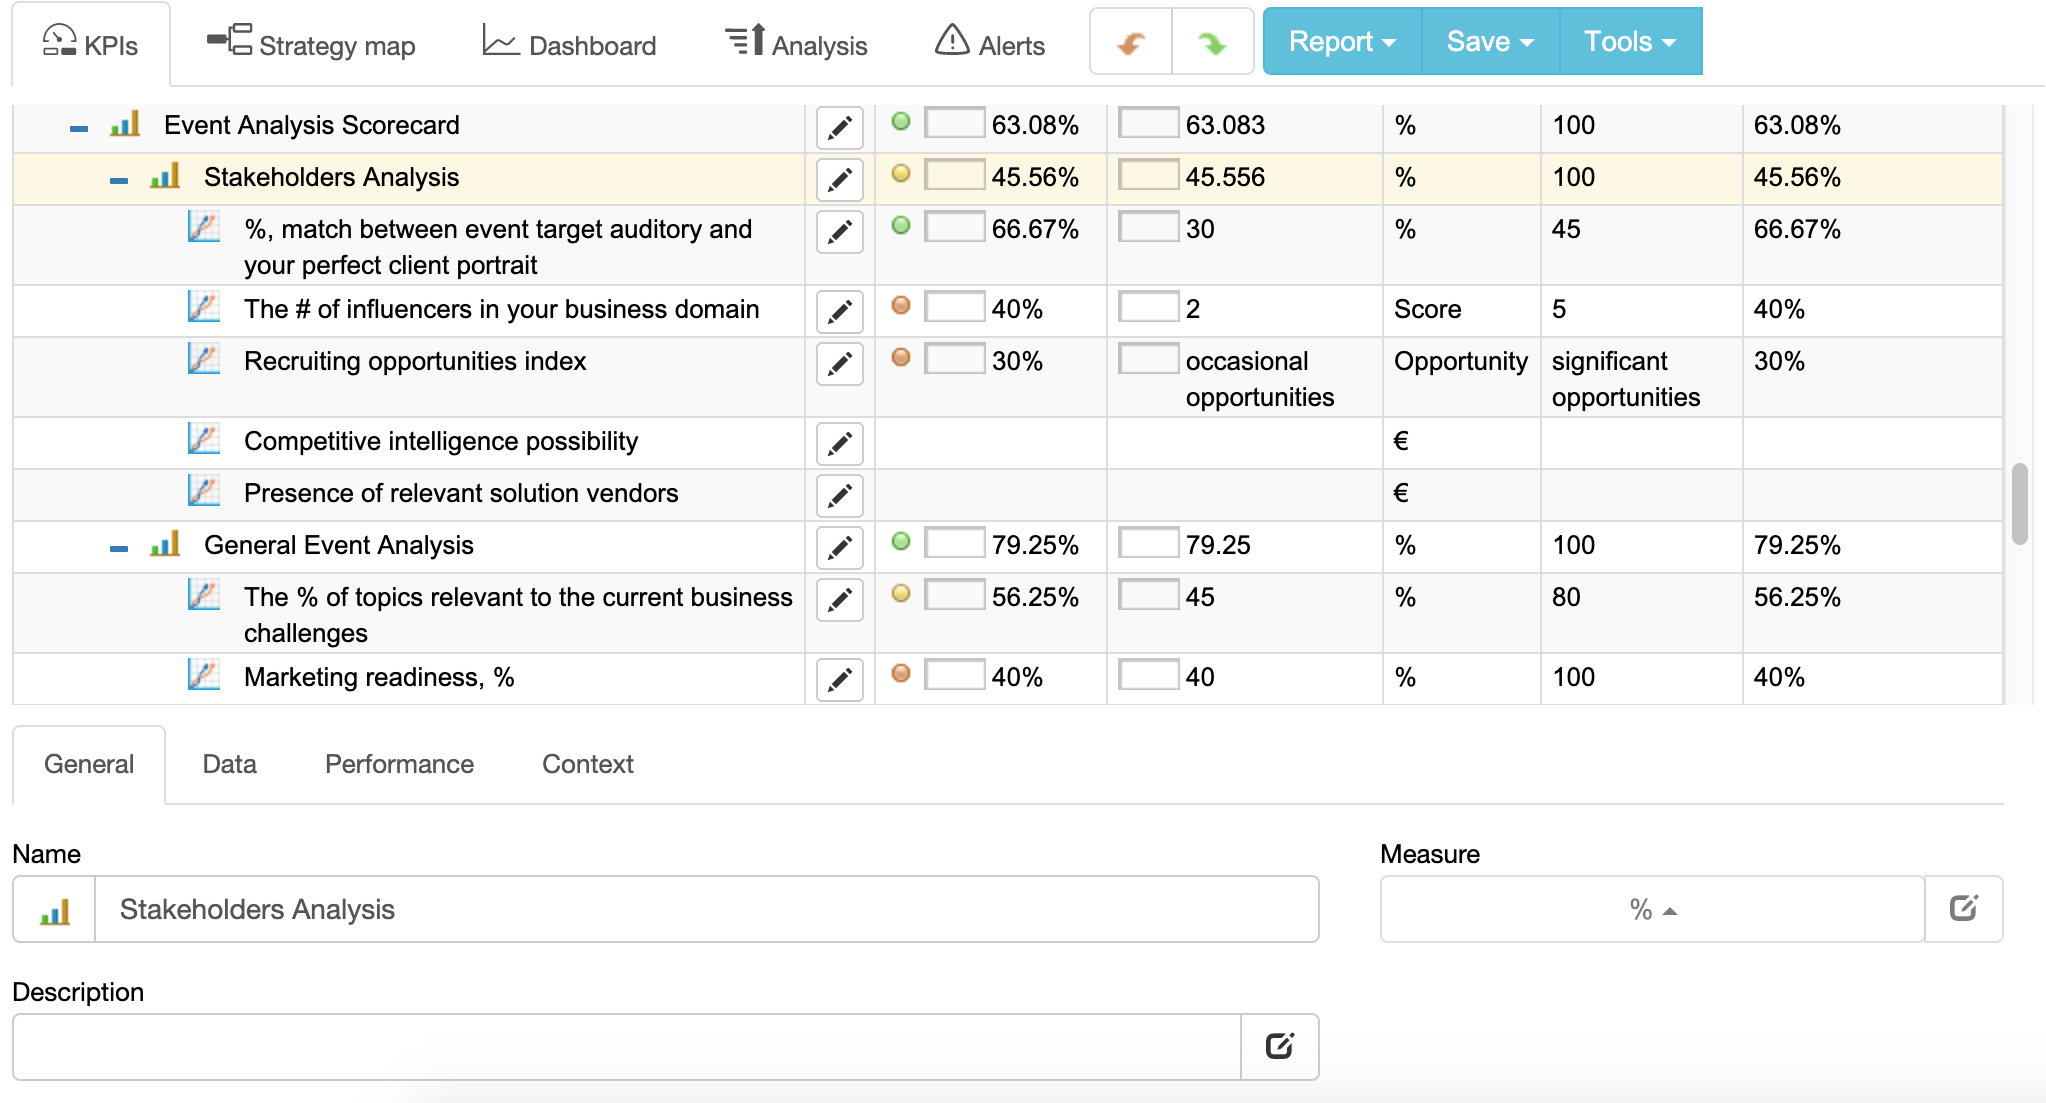
Metrics:
- %, match between event target auditory and your perfect client portrait
- The # of influencers in your business domain
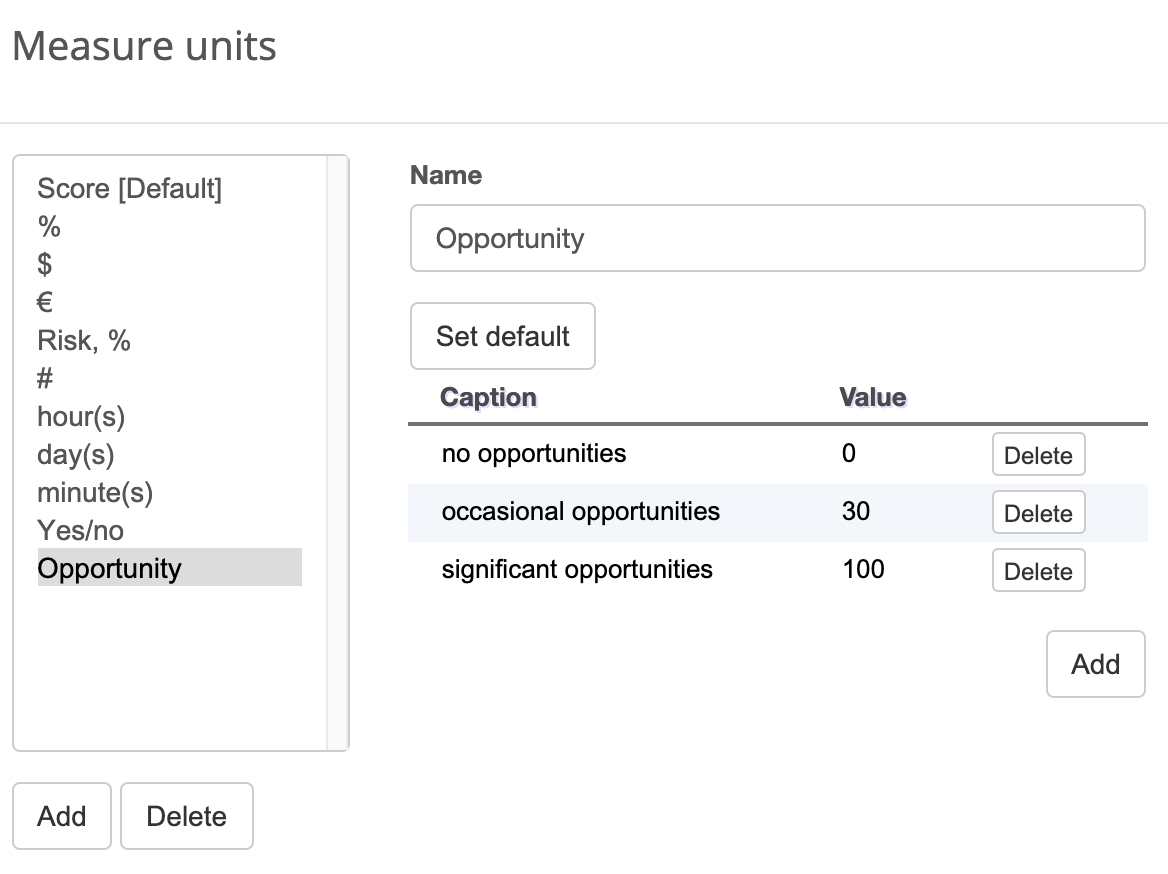
- Recruiting opportunities index (can be a qualitative metric with possible options “no opportunities” – “occasional opportunities” – “significant opportunities”)
- Competitive intelligence possibility (a binary metric with “yes” or “no” values)
- Presence of relevant solution vendors (a binary metric)
General Event Analysis
- Event program analysis. Does the event program / main theme match your business strategy? Will the program attract your potential clients, partners, hires?
- Past events analysis. What were the outcomes of past events? For example, what was the coverage in the media? Who shared the feedback about the event?
- Marketing readiness. Is there a hashtag and Twitter handle? Is there a community or a group associated with the event?
- Speaking opportunities. Speaking on the event is an excellent way to decrease participation cost and increase impact. I prefer a workshop format as it gives more opportunities to connect with the attendees.
- Expected learning outcomes. Organizers of workshops make your life easier by providing expected take-aways.
Metrics:
- The % of topics relevant to the current business challenges
- Marketing readiness, % – possibilities to spread the word about your participation/talk/workshop to event attendees
- Speaking opportunity (binary metric)
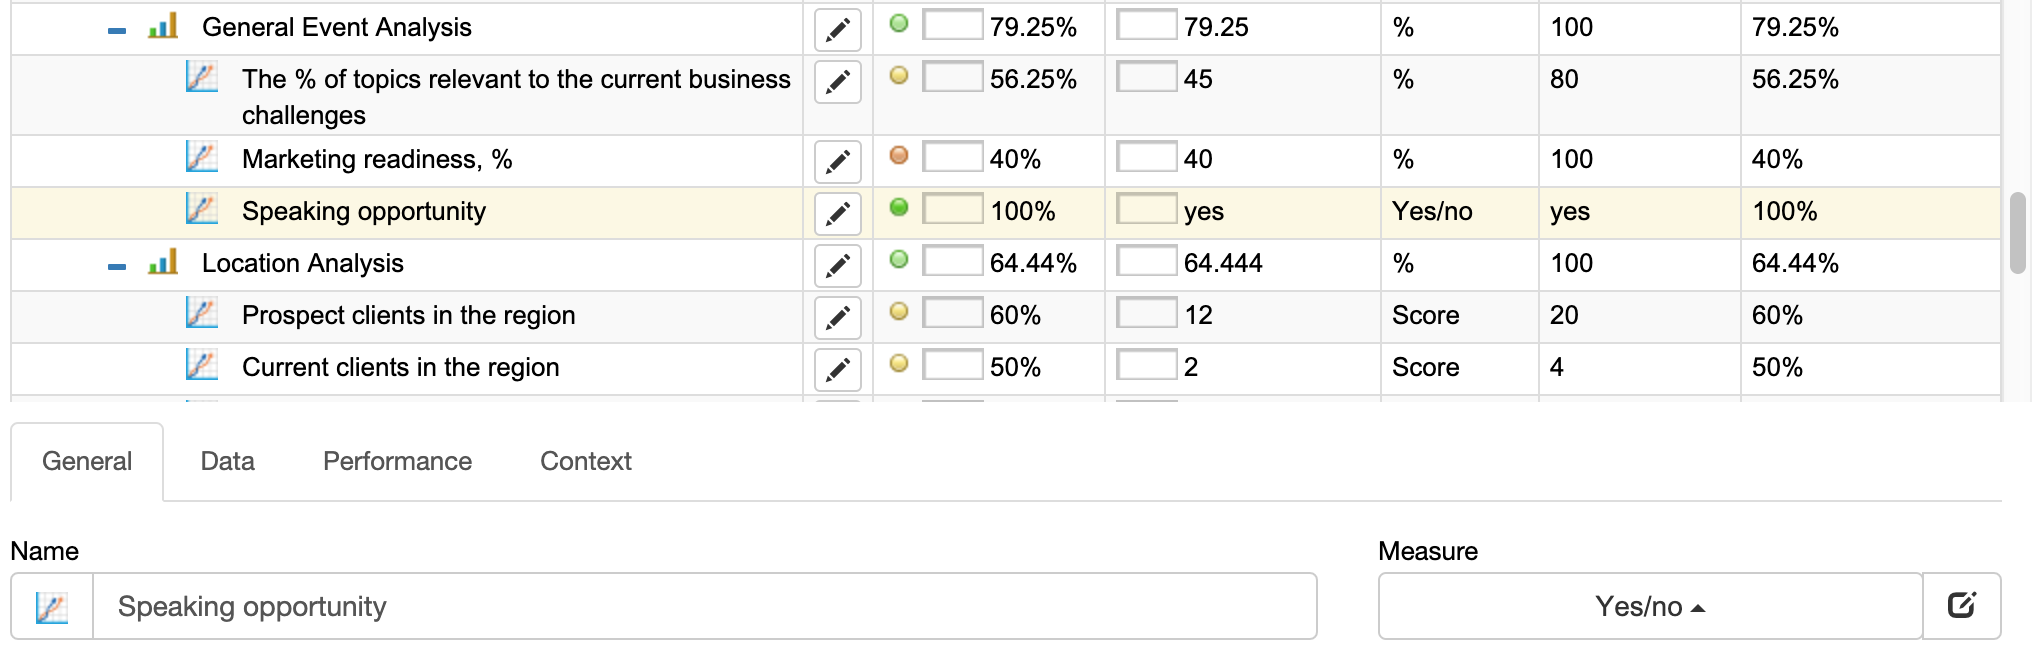
Location Analysis
- Prospect clients in the region. Were there any leads from the region?
- Current clients in the region. Do we have clients in the region?
- Prospect partners in the region. Do your prospective partners attend the event?
- Team members in the region. Are there members of our remote team living in the region?
Metrics:
- # of prospect clients interested in meeting / demo
- # of current clients interested in business breakfast
Logistics Analysis
- Estimated participation costs. Include travel cost, time investment, admission cost, indirect costs. Learn more below.
- Combine events. Check out the event calendar for other events of interest before you book your flight; in many cases, you can adjust logistics to attend two events.
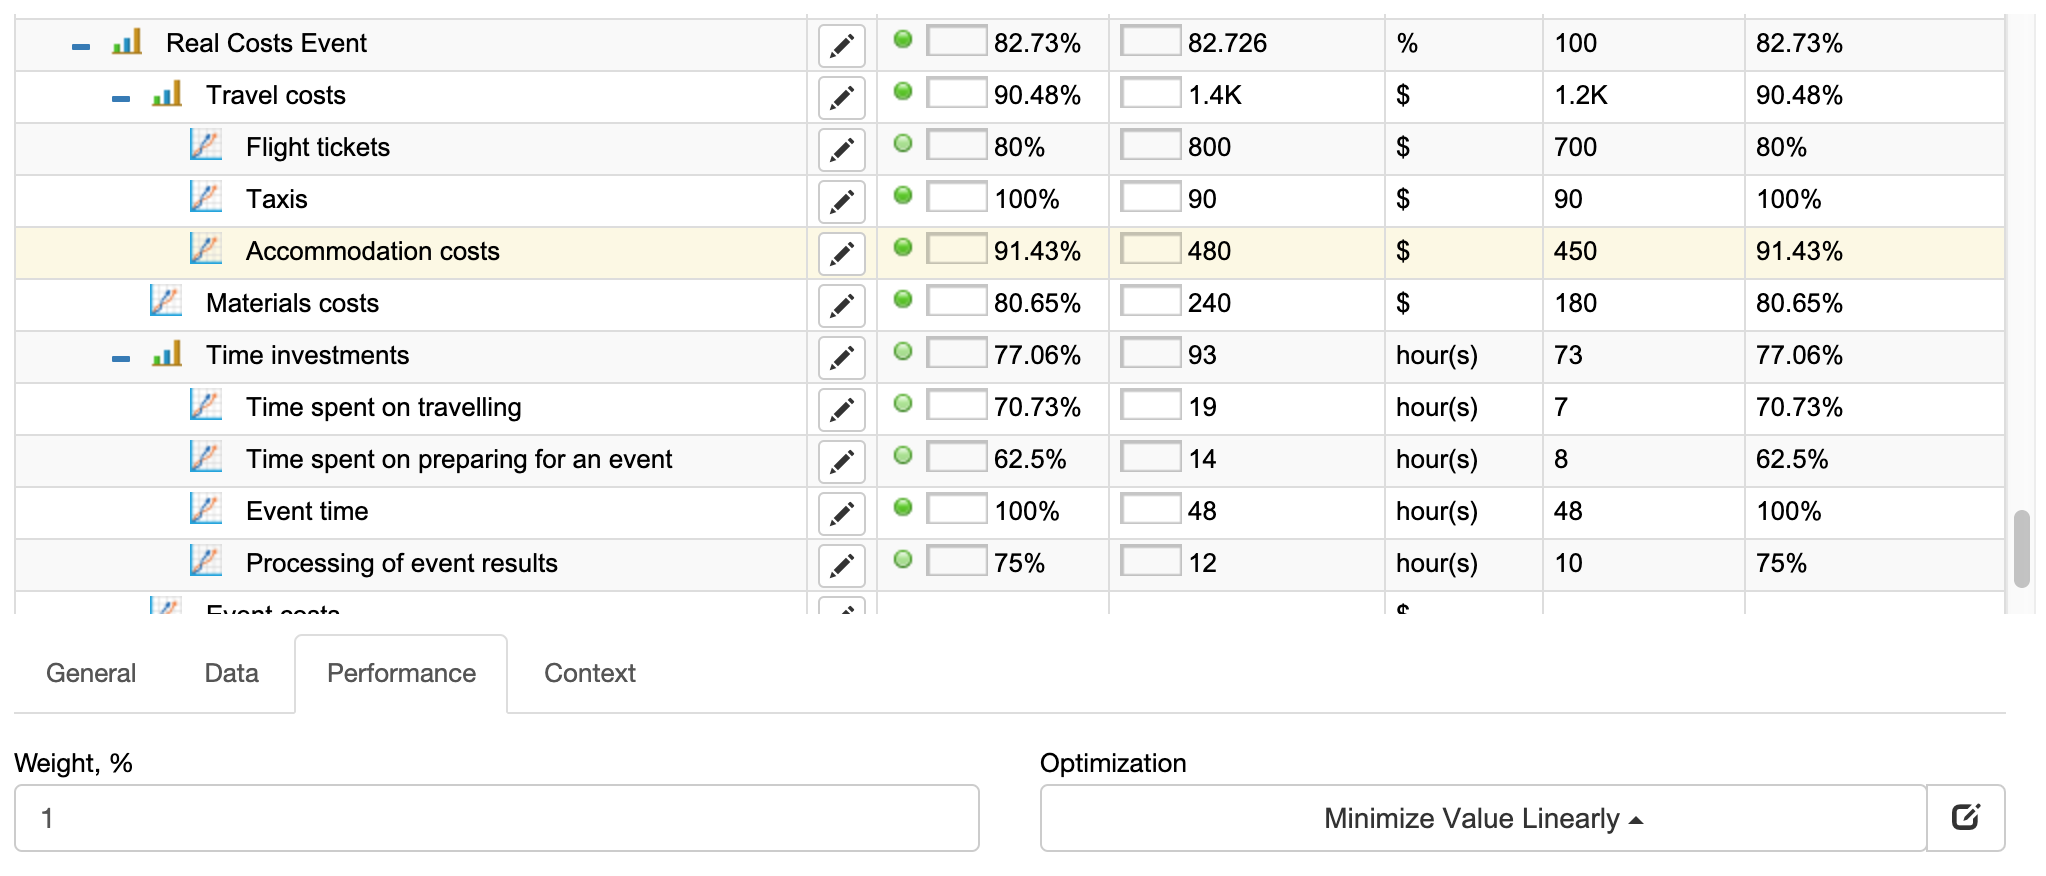
Calculating the Real Costs of the Event
The “Investment” part of the ROI formula seems to be clear, but still, less tangible costs are often missed. Here are the event-related costs to have in mind.
- Travel costs. Flight tickets, taxis, parking, car rent, gasoline, accommodation costs, meals.
- Materials costs. Business cards, brochures, banners, booth fees, booth equipment rent.
- Time investments. Dollar equivalent of time spent on travelling. Time spent on preparing for an event (travel planning, preparing slides, doing pre-event research). Event time. Processing of event results. Time attendee is not involved in the main work.
- Event costs. Admission, workshops, social events, certification, city excursions.
- Indirect costs. Jet lag impact, costs of catching an early morning flight, costs of long waiting time for connection flight. Personal costs that are caused by business travel, such as getting a pet to the animal hotel.
Multiply the total figure by the number of persons who will need to attend:
- In a case of normal attendance or a keynote talk, one person can do the job
- For a trade show, you will need at least two colleagues presented
Event Evaluation Scorecard
Once you have a set of metrics that fit your event strategy, it is a good idea to reuse them for different events.
Use the Event Scorecard Template that we discussed in this article as a template for your own evaluation scorecard.
- If you do a few events per year, then a list of indicators in an Excel spreadsheet will be enough.
- If your organization participates in many events and plans to connect your event strategy with other strategies, then a professional strategy execution software like BSC Designer will help.
Users of BSC Designer can:
- Reuse event scorecard template to calculate estimated ROI from an event
Maximize Event ROI by Selecting Right Participation Format
The effectiveness of an event depends on your participation format. In our case, these options were:
- Online events. Joining and/or hosting webinars. Works best if you are “testing waters,” need to get an idea about the needs of your audience. In a separate article, we discuss the framework we use at BSC Designer to track the performance of our online events.
- Normal attendance. Visiting a conference or tradeshow. Works fine if learning is your primary goal, and the program of the event resonates with your challenges. You’ll get an idea about the problems your target audience face.
- Speaking opportunity. Doing a keynote or a workshop. Works well if you need to engage with the audience. The workshop format is limited by the number of attendees but has the highest impact. Be sure to promote your participation to get +1 into your expert karma.
- Sponsorship opportunity. Being an official partner of the event. Gives access to the marketing channels, event handout materials, often speaking opportunities. Good for brand awareness and recognition of the company’s expertise.
- Company Booth. Participating in a conference/trade show with a booth. +1 to company’s expertise recognition, more possibilities for networking with potential clients and partners. Makes sense to try the normal attendance format before trying this one.
- Organizing your own events. For example, to educate existing clients or do community gathering. You have full control over event logistics. The main challenge is to attract enough attendees and sponsors interested in the program while keeping a positive ROI of the event.
In the case of BSC Designer:
- Webinars help us to share some quick ideas and track a pulse of emerging topics. If you participate in the event, we will ask you to submit the challenges that you are facing in the context of the event topic. This helps us to focus our content strategy.
- Normal attendance. We are a software company, so we attend professional conferences to stay tuned for new technology trends and network with colleagues. This generates many ideas for our innovation pipeline.
- Keynotes and workshops. That’s our preferred format for now. We talk about KPIs, strategies, Balanced Scorecard. The talk/workshop is vendor-neutral, but we organically use our software to illustrate some of the ideas.
Talks and workshops improve the networking as well – “Yeah, I saw your name on the conference program” or “Nice talk, by the way, I have a question…” help to start some meaningful conversations.
- Sponsorship opportunity. Works well for us when the target audience is the strategy execution specialists, like, for example, “Jornadas de Estrategia” in Spain or “Strategy Execution Master Class” in Belgium.
Pre-Event Follow-up
If the event passed the pre-screening, you could start planning and preparing for the event.
A significant part of the preparation will be following up with people before the event. The way you approach this depends on your niche; for example, here is Howard Kingston sharing what he did for this startup.
Benchmark ROI Figures
One of the ways to estimate event returns is to compare it against your marketing benchmarks.
- A key metric, in this case, is CPL (Cost per Lead).
You can make a rough comparison of the outreach for the event compared to other marketing channels you use (we did it for Google Ads). Find a good explanation of this approach in this article by Matthew Wainwright.
Meet Your Remote Team
We have discussed many value streams and how to quantify them. Let’s talk about less obvious reasons to participate in the events.
One of our values is “hire talents globally.” That’s why there are many remote employees working with BSC Designer.
We are taking advantage of some events to meet our local partners and remote employees in person.
The cost of the event remains the same, but we can get more value by getting to know our team members better. In this article, you can learn more about managing remote employees.
Visiting an Event as Employee Bonus
Most people like travelling, especially when the destination is beautiful cities like Venice or Prague.
Before, we discussed rewards and bonuses best practices. Consider event costs as a bonus you pay to the top performers. This type of bonus is proven to work well.
Again, event participation costs will remain the same, but your investments will pay back by a highly-engaged team (see the employee engagement index we discussed before).
2. Metrics to Look at During the Event
An event is just a game field – your results depend on how you play.
What are the success factors to look at during the event? Business professionals agree that networking is the most important part of any event. Here, we will deal with two groups of metrics:
- Lagging metrics that help to validate the results
- Leading metrics that help to predict success
Make sure your management team understands the difference between these two types of indicators.
Let’s start with lagging metrics.
Meaningful Conversations Metric
Simply exchanging business cards is not a sign of meaningful conversation. Actually, if someone asks me for a business card within the first few seconds of conversation, it is a red flag for me.
What are the signs of meaningful conversation? I define these four:
- [ ] Ice breaker. My opponent and I have found how our business interests overlap (that’s easy as we attend the same event). I know the area of interests of the person I talk to.
- [ ] Product. I had a chance to explain what our product does and how it can be helpful. The trick is not to behave like a salesperson but make a sales pitch to be an organic part of the conversation (see below how we do it).
- [ ] Personal. Besides discussing business topics, we had a chance to move to something more personal (travelling experience, learning foreign languages, hobbies, etc.)
- [ ] Connection. Finally, we connected on LinkedIn. When appropriate, I prefer to do it together with exchanging business cards.
Qualified Leads
The best meaningful conversations are converted into qualified leads. Here are the metrics for qualified leads:
- # of problem-solution matches. For example, lead’s company is looking for a way to move their KPIs from spreadsheet software to something more professional. It’s a good lead for us.
- # of presentations/demos we made during the event. No need to always use a laptop. That’s where the materials readiness metric helps you. In our case, we can use a paper version of a strategy map to showcase what our software does.
- # of follow-up requests – the prospective client is asking to share a specific case study or access to a fully functional test version. For example, if you consider moving your scorecard from spreadsheet software to Balanced Scorecard solution, then I will send you a link to this article.
Now the question is, what can we do to achieve those meaningful conversations and be able to convert them into qualified leads? Let’s discuss success factors and respective leading metrics.
Networking Skills Metrics
There are people who do this naturally; there are some who need to learn it (here some good points discussed). What are the success factors for good networking skills? A quick answer is – practice and certain behaviour patterns.
Here are some metrics to track:
- # of conversations initiated by you (leading metric)
- # of questions you asked the speakers (leading metric)
- % of conversation according meaningful conversation pattern (see the explanation below)
Presentation Skills Metrics
Similar to networking skills – you learn by practicing. Some metrics to look at:
- # of presentation tactics you learned from the event (the idea is to start noticing them, not just counting) (leading metric)
- # of public talks you did last year (leading metric)
- # of questions people ask after your talk
- Average after-talk feedback score, %
Tools and Materials Availability
At BSC Designer, we like experimenting with business cards. If we exchange cards on the conference this year, on one side, you will find my contact information, and on the other side, you will see this:
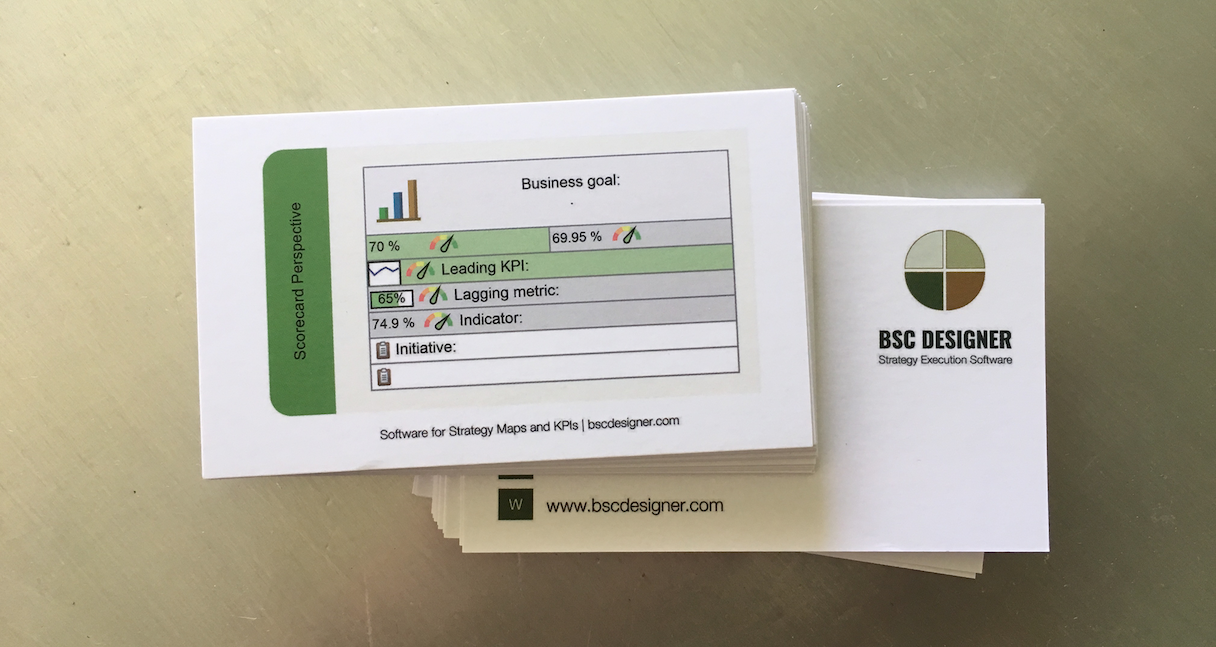
If you ask me what it means, I will say that this is a small piece of a strategy map designed by our software, that you have there a business goal, metrics, and initiatives. If we got to this stage, I’ll certainly consider this to be a meaningful conversation.
Other things to look at:
- Materials availability, %. Make sure logistics work, and your business cards, brochures, booth materials arrive on time and in full.
- Material Wow Factor, %. Will your materials end up in the rubbish bit of a hotel, or will attendees keep it? Test it – we did it for our strategy map template.
3. Post-Event KPIs
The event has finished, but we still have a lot to do. Here are some metrics to look at.
“Tangible” Event Outcomes
Something that we can easily count:
- # of business cards obtained
- # of event participants
In my opinion, these metrics deserve only a quick review:
Collecting many business cards has nothing to do with effective networking
- The number of event participants rarely correlates with obtained value
Event Impact Metrics and Their Proxies
If tangible outcomes like the number of business cards obtained don’t make sense, then what should we be looking at?
In an ideal situation, we’d look at the real impact on business:
- Networking contacts that are useful
- Deals closed – if our goal is to meet a prospective client
- Ideas implemented – if we had learning goals when attending a conference
The problem with impact metrics is that they are hard to track (need to understand the impact of different marketing channels, long purchase cycle). The solution is to look at their proxies:
- Instead of tracking impactful networking contacts, look at the “# of meaningful conversations”
- Instead of looking at deals closed, look at the “# of qualified leads”
- Instead of waiting for ideas to be fully implemented and tested, look at the “# of new suggestions qualified” for the first stage of your innovation pipeline
Operational Indicator for an Event
We can also track some operational indicators. If you do this, make sure your team aligns them with appropriate business goals.
- % of leads followed up (see below our approach to follow up)
- # of ideas added into the innovation pipeline (see our approach below)
- # of social media messages posted after the event (your thoughts, photos, take-aways) make sure you have this connected to your marketing scorecard.
- # of press mentions (helps justify attending future events like this)
- # of internal presentations made to your team (see the explanation below)
- # of content creation opportunities (see below)
Leads Follow-Up
I guess everyone hates robotized “follow-ups” when you are bombarded with emails and phone calls, making you regret that you gave your business card.
In the case of BSC Designer:
- I will send you an email with relevant links to provide promised information.
- I will connect with you on LinkedIn. You will see my future updates and get in touch with us if something resonates with your current needs.
Feedback Analysis and Implementation
If you are lucky to meet your current clients on the event, make sure you are open to the feedback (=your client is taking 90% of the time). Once you get back to the office – implement!
I was attending a software conference where three competing eCommerce companies were sponsoring the event and pitching their platforms. Two were “big guys,” and the third was a “startup.” When I visited the same conference in 2 years, there was just one eCommerce dominating the market (the “startup”).
All three did well in terms of presentation, follow-up, and networking. What was the trick? The “startup” guys did implement most of the requirements they have learnt from the attendees.
Make sure your feedback request cycle ends with implementation.
Ideas Qualified for Innovation Pipeline
Any event is an excellent way to learn something new. In my case, the ideas learnt on the conferences had a short life cycle – I’m typically enthusiastic about the idea during the event, and then it gets buried with other “we’ll try this someday” ideas because the idea is not the priority right now or requires additional resources to give it a try.
To avoid this, we have implemented an innovation pipeline:
- Interesting ideas are noted down in a text format or as a photo of an interesting slide
- Then they are reviewed (typically during the flight back home) and converted into more formal innovation candidate (title, description, rationale)
- Innovation suggestions are collected on the Kanban board and wait their turn to be processed through the innovation pipeline (discussion, prototype, test, implementation)
Intuitive Learning
I’m talking here about the ability to read between the lines.
- What topics were of high interest for the attendees? We can add these topics to our content strategy.
- Which speakers were good in connecting with the public? We can invite them to our own events or use their videos on YouTube to improve the presentation skills of our team.
- What slides got the greatest attention? Is it the pain point that can become a key feature of a new product?
Internal Presentation
It is good practice to share ideas learnt on the event with your colleagues. And by the way, this is another way to increase the value return from the event. Dollar equivalent of the learning value can be used for ROI calculation.
In our case, it is something less formal:
- “Hey, I’ve attended this event and look at what excellent tool was used to solve this problem…”
Or
- That guy was talking about Social Media Marketing; here is his checklist. Can we test something to improve our approach?
Don’t convert the after-event presentation into a formality. Try to motivate your team to present on the essence of what they have learnt, not repeat slides they saw.
Content Creation Opportunities
The BSC Designer business model relies heavily on educating clients. The best content is born out of real-life experience.
You learn by simply attending conferences and workshops, and you learn even more if you speak there. Speaking on the conference forces you to analyze the topic in detail, do experiments, double-check the sources of information.
Use these takeaways to create engagement content:
- This article is based on my experience in public speaking, doing workshops, attending conferences and being a sponsor.
- The quality scorecard article was inspired by attending the Software Quality Days conference in Vienna.
- The 10 Step KPI System book was inspired by a Pecha Kucha presentation I did at the OOP conference in Munich.
Consider repurposing the most insightful ideas you learn on the events into the evergreen content for a website.
General Effectiveness
Here are some general effectiveness metrics. They will help your team to analyze the effectiveness of different events and the effectiveness of the internal business systems:
- # of leads contacted vs. # of meetings planned
- # of meetings planned vs. # of meetings held
- # of meetings held vs. # of meaningful conversations
- # of meaningful conversations vs. # of deals closed
4. Event Strategy Map
Event strategy is a coherent set of priorities and goals for the events where your company will participate.
We have discussed many KPIs and improvement ideas. My best guess is that your next challenges will be:
- Put together all these ideas on a 1-2 page document
- Effectively communicate this strategy to your team
- Ensure that all your best practices for the event become stable behaviour patterns
A good strategy map will help you with this. Before, we have discussed a classical K&N Balanced Scorecard approach with four perspectives. Using the same approach, we can build a map for the event strategy.
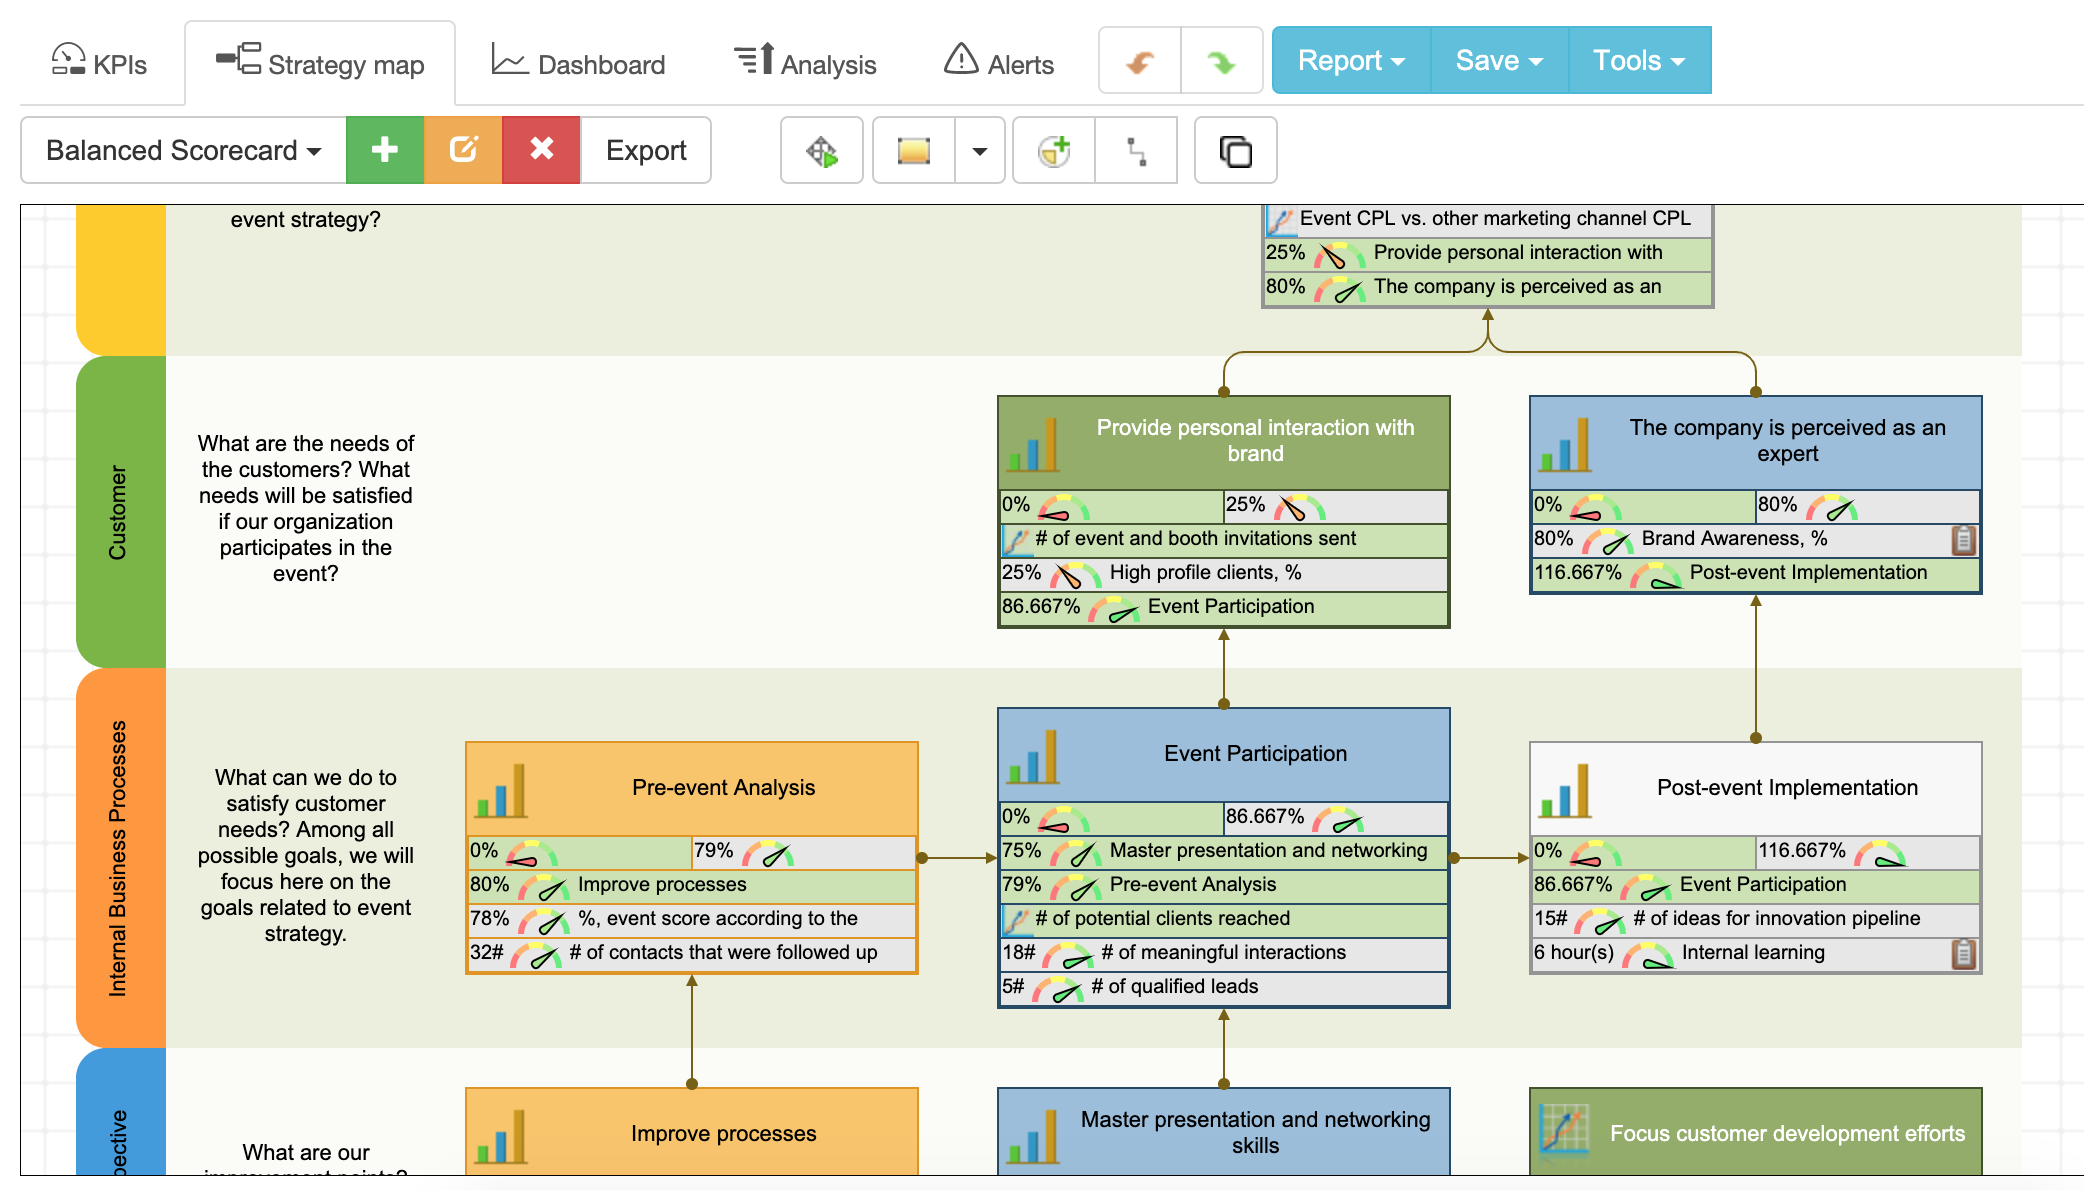
Customer Perspective
What are the needs of the customers? What needs will be satisfied if our organization participates in the event?
Business goals (customer needs):
- The company is perceived as an expert. A company is perceived as an expert in a domain when it is presented at industry events, does keynotes, participates in the trade shows.
- Provide personal interaction with brand. It’s one thing to visit your website, but you also need to talk to your team on a trade show booth. The physical presence is just the beginning, and it is important to learn from clients and implement on their feedback, as discussed above.
Metrics:
- Brand Awareness, % (as measured in brand scorecard)
- # of event and booth invitations sent (every time customer support specialists mention that client can meet our team at a certain event)
- High profile clients, % (this is an indirect indicator of how effective our event strategy is in reaching high profile clients)
Financial Perspective
What are the financial outcomes of achieving goals from the Customer perspective? What are our financial goals in the context of the event strategy?
Business goal:
- Make participation in events financially viable
Metrics:
- Real costs of event, $
- Dollar equivalent of value from event, $
- Event CPL vs. other marketing channel CPL
Initiatives:
- Control costs
- Maximize ROI
Internal Perspective
What can we do to satisfy customer needs? Among all possible goals, we will focus here on the goals related to event strategy.
The goals will repeat the pre-event, on-event and post-event factors discussed above:
- Pre-event goal. Improve event selection and preparation process.
- On-event goal. Implement effective behaviour patterns for events.
- Post-event goal. Event follow-up and continuous learning.
Pre-event metrics:
- %, event score according to the event analysis scorecard
- # of contacts that were followed up before the event
On event metrics:
- # of potential clients reached
- # of meaningful interactions
- # of qualified leads
Post-event metrics:
- # of ideas for innovation pipeline
- Internal learning presentations, hours (use the training scorecard template for a more result-oriented approach)
Innovation Perspective
What are our improvement points? What do we need to learn to do events better and satisfy client’s needs better?
This perspective is part of your innovation strategy:
- What are the improvement points of the processes? Travel optimization, using events as an opportunity to meet remote team members.
- What skills do our event team need to master? Presentation skills, networking skills, marketing materials.
- Focus customer development efforts. What conference do our potential clients actually visit? What are today’s needs of our clients?
Metrics:
- Estimated event budget vs. real event budget
- # of improvement points found
- Networking skills training, hour
- Presentation skills training, hours
- Presentation skills practice, hours
- Average presentation feedback score, %
Summary
Here are the main take-aways of this article:
- Know your real costs of event participation.
- Calculate event ROI using the quantification of the total value, not just direct sales generated.
- Your event strategy is unique – use the metrics and strategies in this article as a starting point for your internal discussions.
- The final goal is NOT to keep your team stressed by the event KPIs but to discuss the best tactics and make them more tangible.
Although we discussed a lot of metrics in this article, don’t approach events and networking as a game with a score. It’s more about making business friends than making contacts.
What's next?
- Follow our
 Strategy Implementation System to align stakeholders, strategic ambitions, and business frameworks into a comprehensive strategy.
 - Automate strategic planning with BSC Designer by organizing goals, initiatives, risks, and KPIs into scorecards.
More About Strategic Planning


![]() CEO | Author | Speaker
CEO | Author | Speaker
BSC Designer is strategy execution software that enhances strategy formulation and execution through tangible KPIs. Our proprietary strategy implementation system reflects our practical experience in the strategy domain.