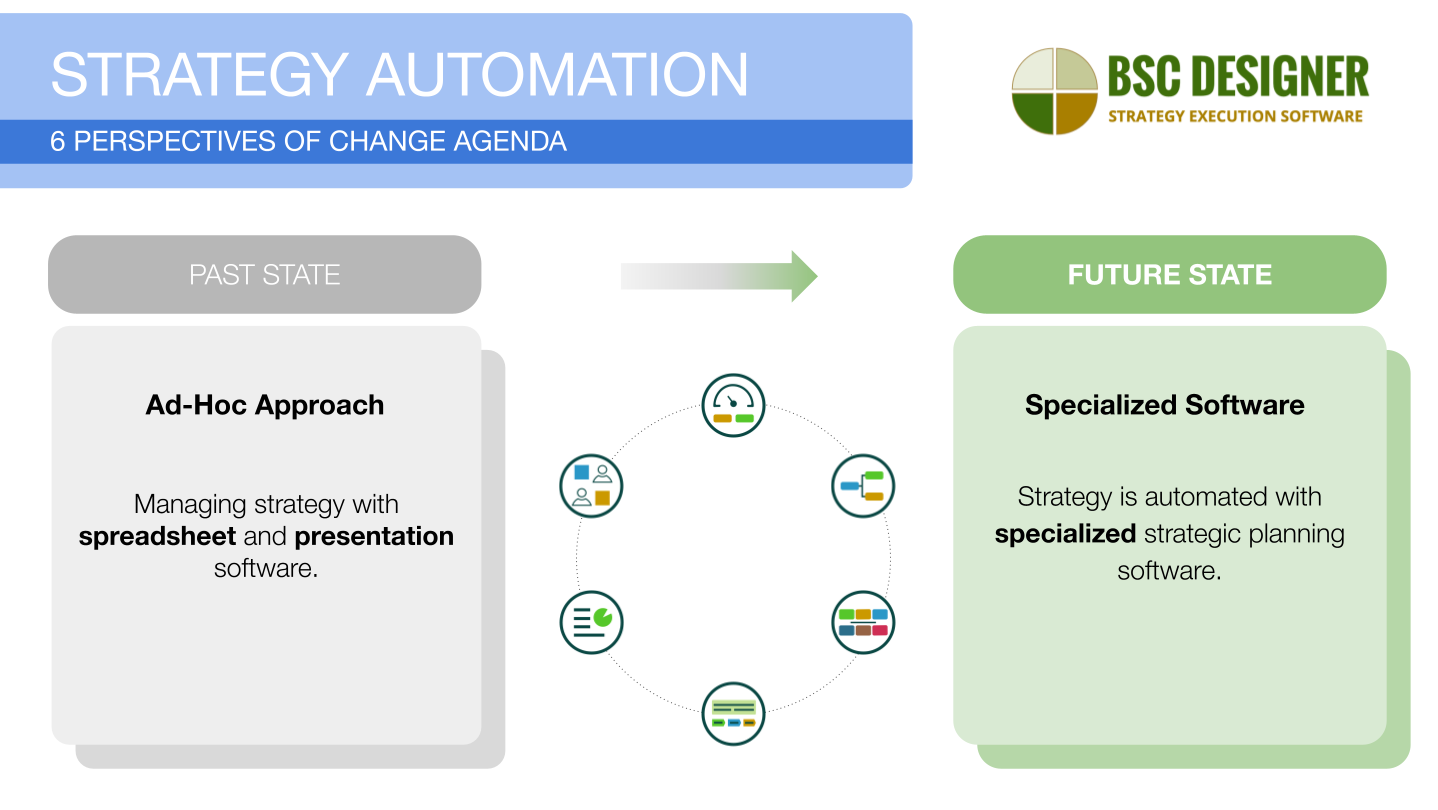
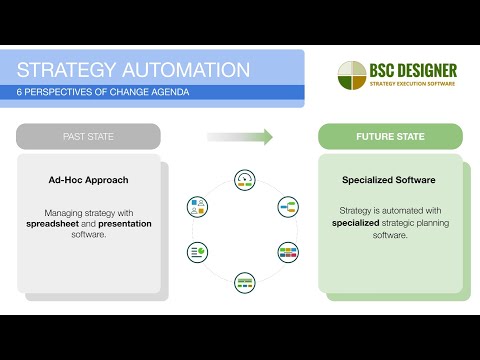
When strategy reaches a certain level of complexity, it’s no longer sustainable to manage it with spreadsheet and presentation software.
In this tutorial, we’ll outline a change agenda for strategy automation.
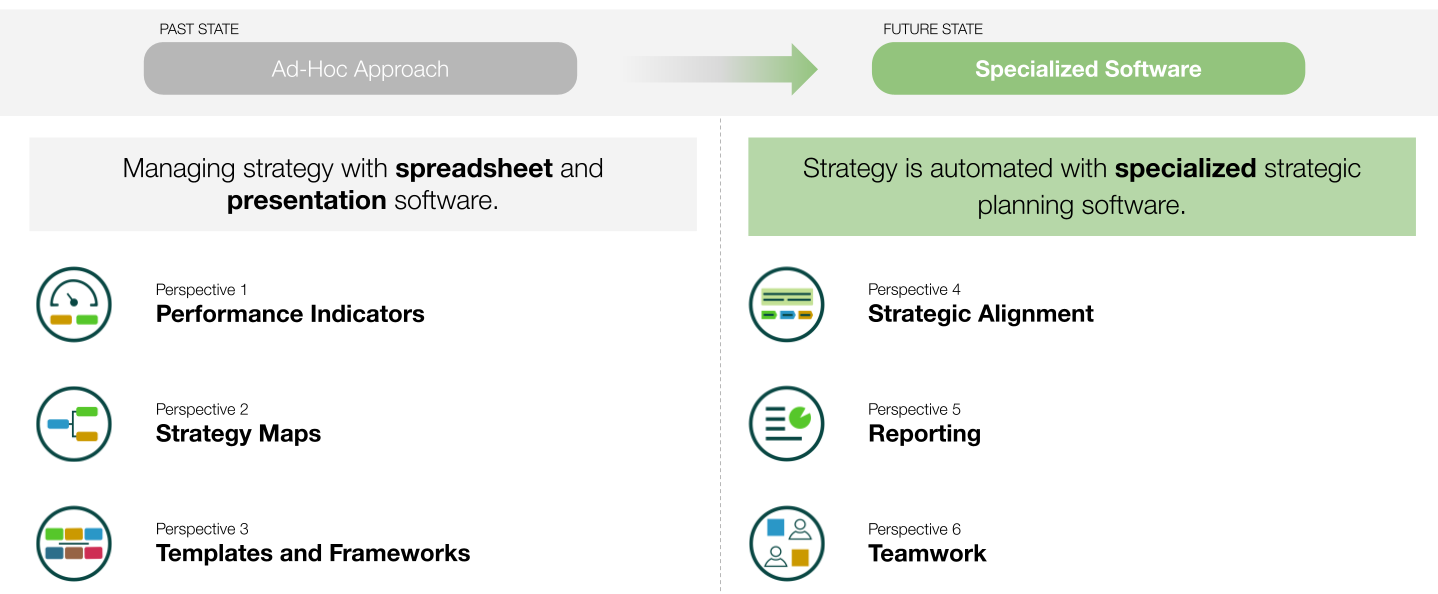
- We will use six different change perspectives to analyze the past state – the ad-hoc approach to strategy and
- We will formulate a future state where strategy is automated with specialized strategic planning software
Change perspectives:
- Perspective 1. Performance Indicators
- Perspective 2. Strategy maps
- Perspective 3. Business Frameworks and Templates
- Perspective 4. Strategic alignment
- Perspective 5. Reporting
- Perspective 6. Teamwork
- Download slides
- Video tutorial
Perspective 1. Performance Indicators
Spreadsheets work well on a prototype stage, but maintaining such scorecards becomes more challenging as the scale and complexity of the strategy grow.
- A minor error in a formula can lead to broken calculations.
- Because of maintenance difficulties, typical spreadsheet-based strategies are limited to 2-3 levels of goals.
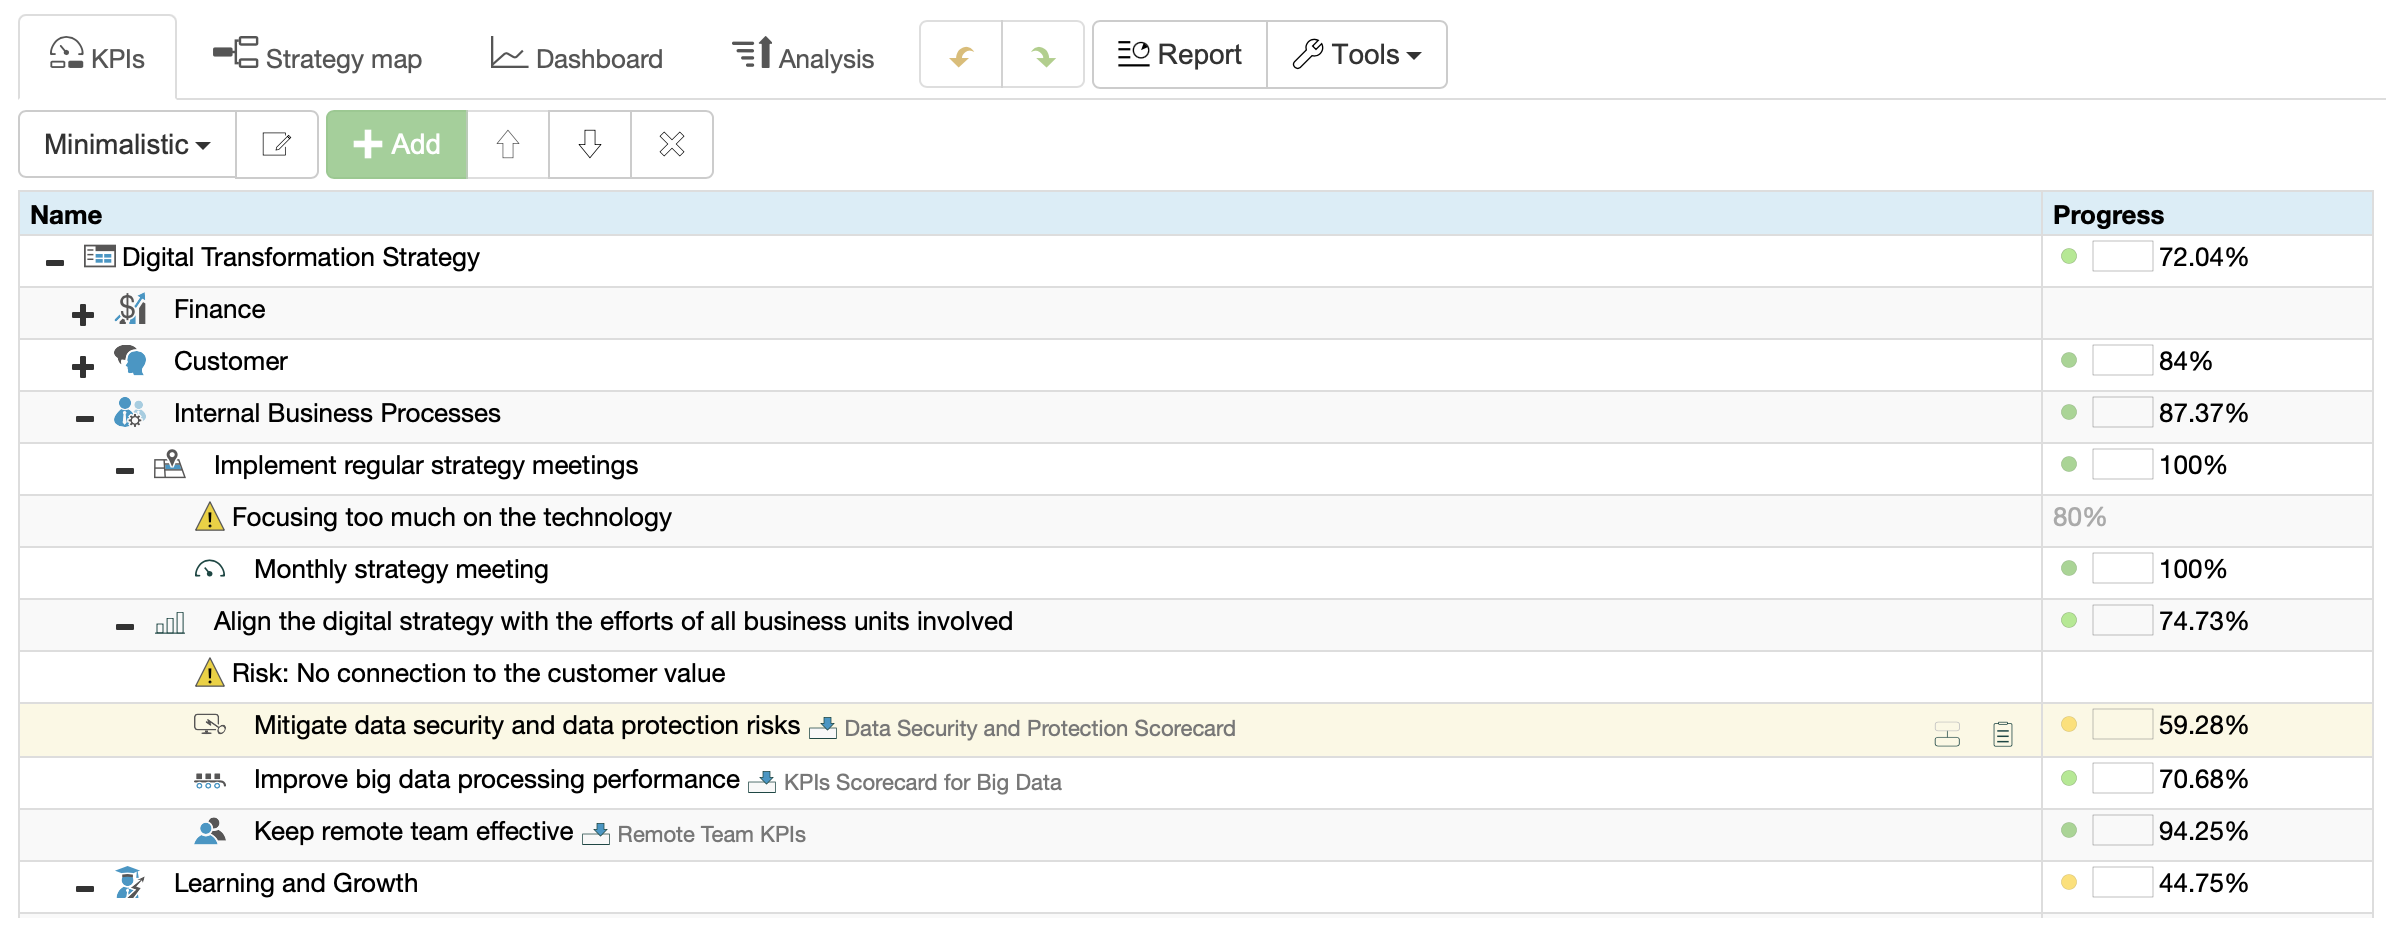
In contrast, specialized software makes strategic planning more organized out of the box:
- Users can add new indicators without the risk of breaking the scorecard, and all the calculations are managed by the tool.
- Specialized software supports limitless strategy decomposition.
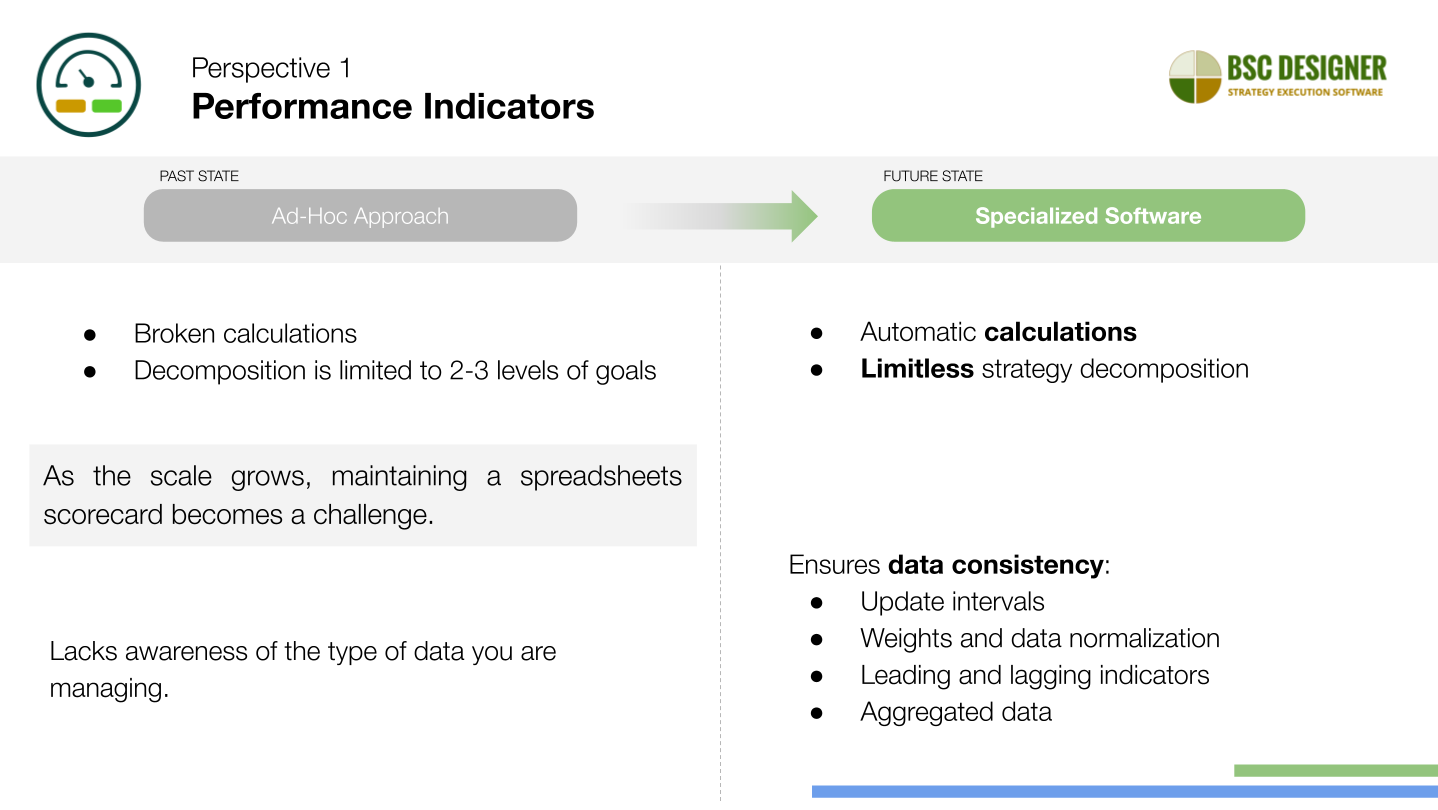
Furthermore, general-purpose software lacks awareness of the type of data you are managing.
In contrast, specialized software understands the process and ensures data consistency:
- It tracks KPIs according to defined update intervals.
- It manages the weights and normalizes data to make indicators comparable.
- It knows how to track the impact of both leading and lagging indicators.
- It calculates aggregated data based on indicator grouping and inheritance settings.
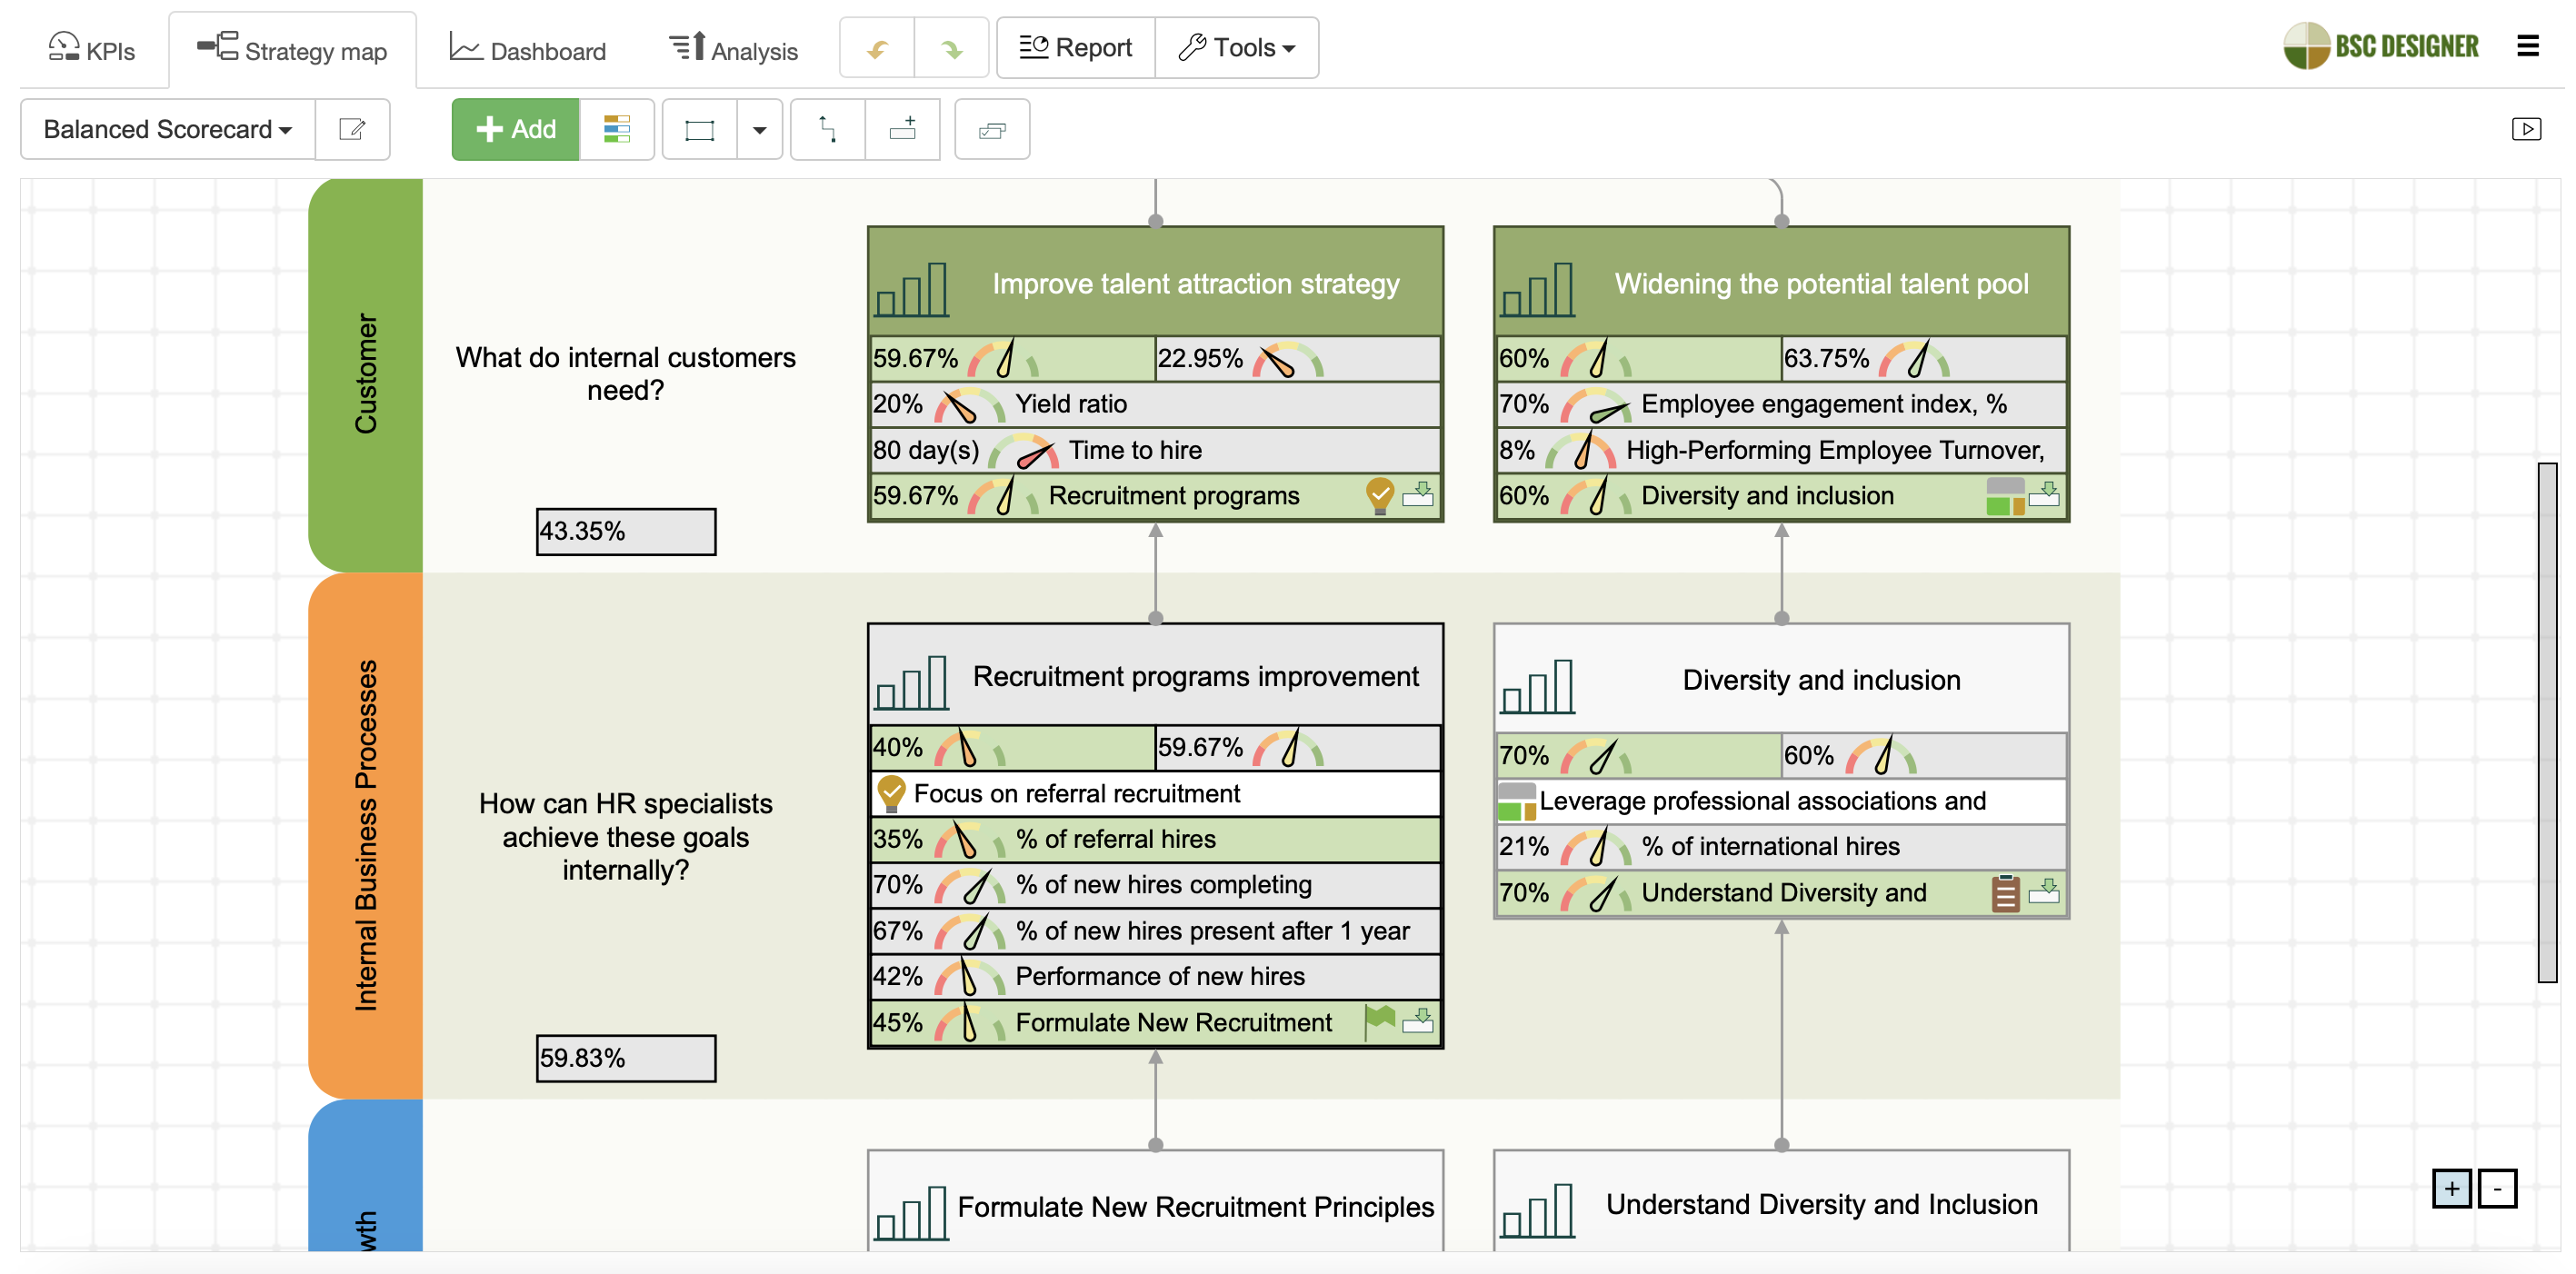
Perspective 2. Strategy maps
Strategy maps are another pain point…
A map diagram created in presentation software is a static image that is difficult to update with new insights and lacks up-to-date data. For this reason, it contributes little value to strategy discussions or presentations.
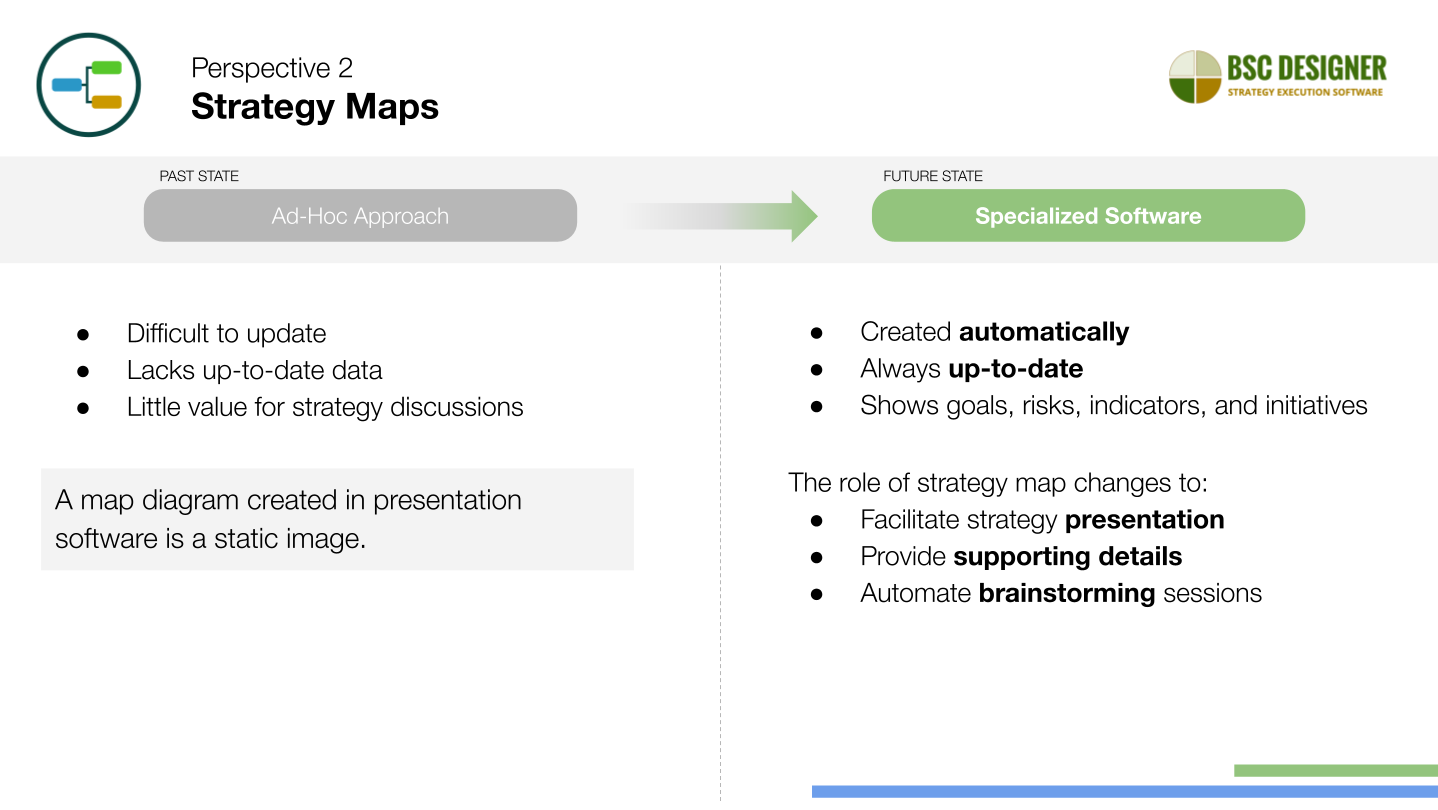
In contrast, specialized software like BSC Designer uses the data from your scorecard to automatically generate a strategy map:
- There is no need for manual drawing,
- It is always up-to-date.
- It shows a detailed image of the strategy, including goals, risks, indicators, and initiatives.
This changes the role of strategy map:
- It is used more actively for strategy discussions and presentations.
- Supporting details are just few clicks away, and
- Team members can add their insights directly to the strategy map during brainstorming sessions.
Perspective 3. Business Frameworks and Templates
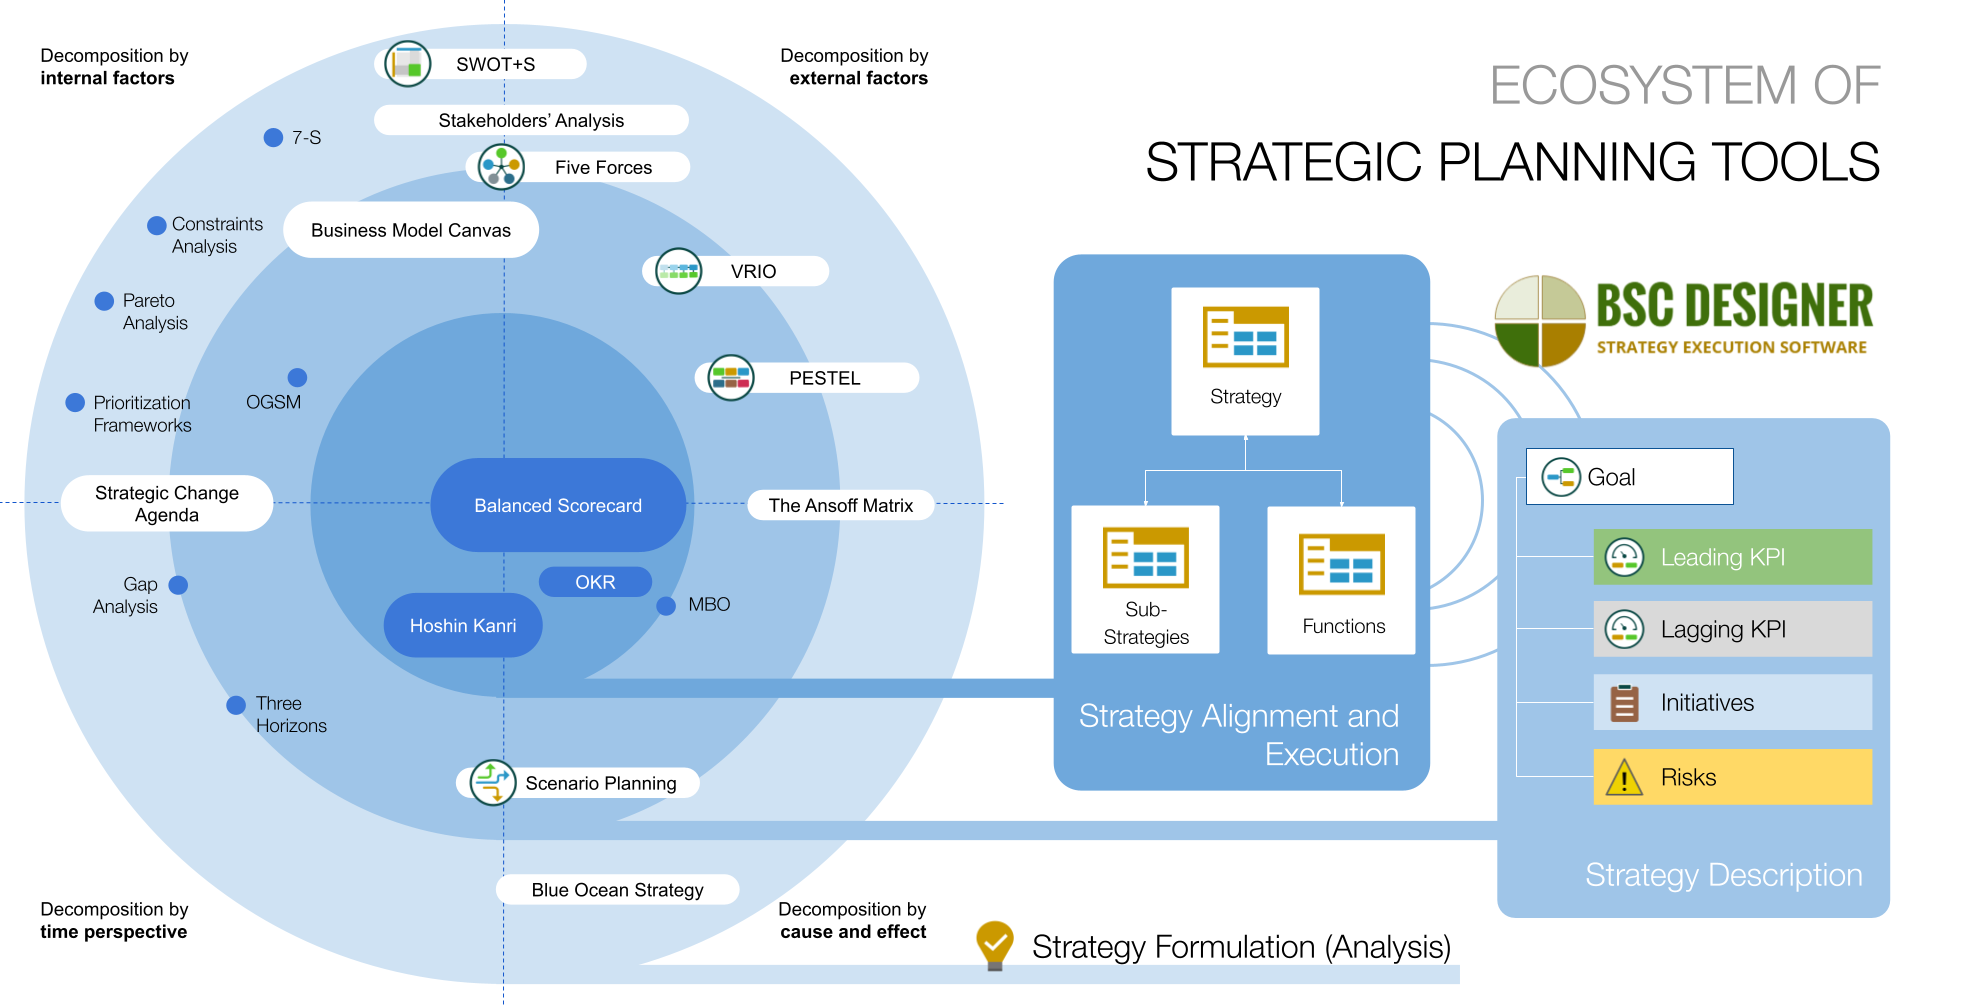
In strategic planning, we combine various business tools to gain a detailed picture of the operating environment.
For instance, we use Five Forces analysis to better understand the competitive landscape, PESTEL for assessing external factors, or Ansoff Matrix for planning growth strategies.
It’s easy to find some visually appealing templates for these business frameworks on the Internet. The problem is that they remain disconnected from each other and the overall strategy.
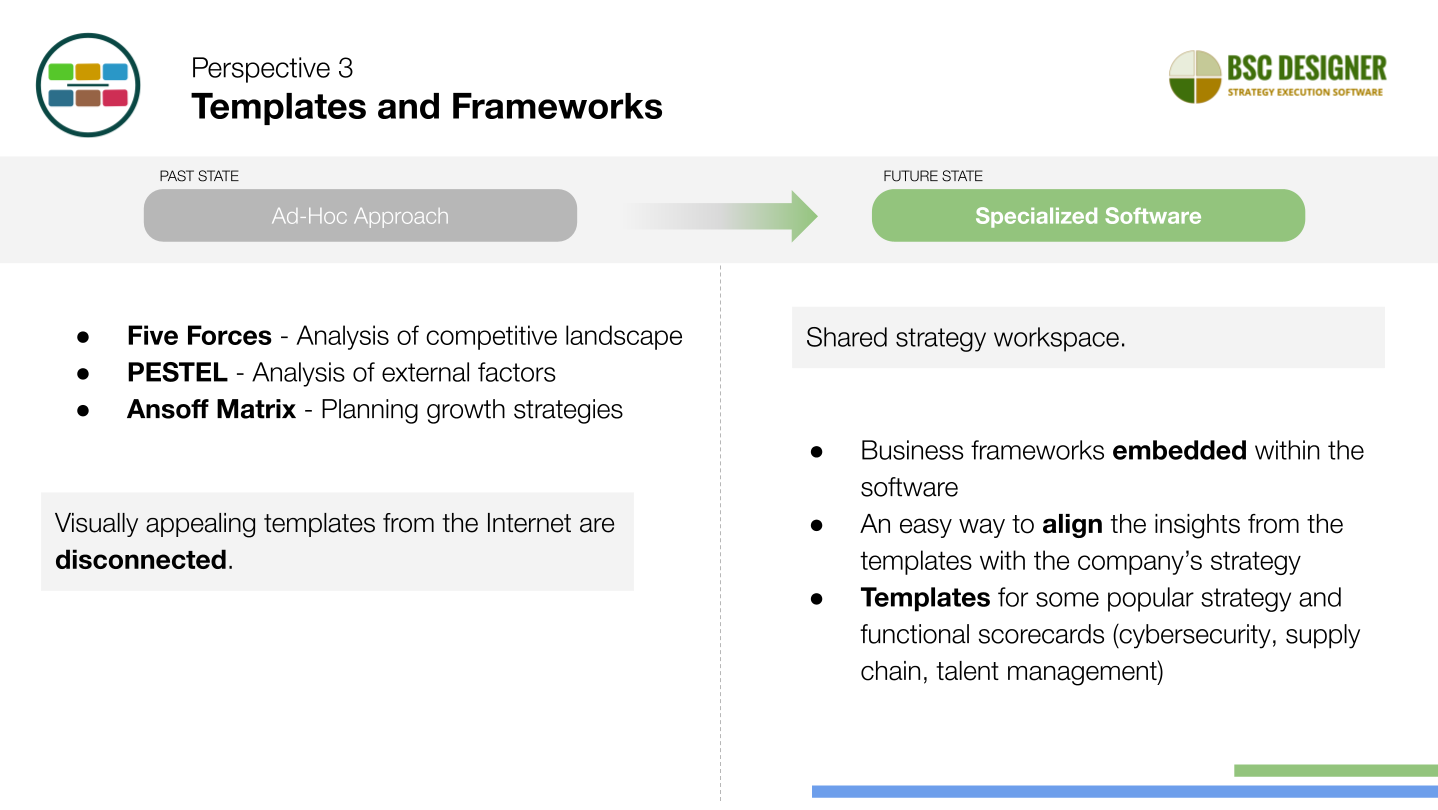
For effective strategy execution, the business framework and strategy scorecards should be available in the shared strategy workspace.
With BSC Designer, you have access to the most popular business tools right within the software.
- Your team can organize these templates in their strategy workspace and align the insights generated by the frameworks directly with strategy.
- We also have templates for some popular strategy and functional scorecards, such as cybersecurity, supply chain, talent management that will save you time when focusing on new challenges.
Perspective 4. Strategic alignment
Strategic alignment is probably the most important challenge for spreadsheets software.
It is solved on a low level when we align goals with KPIs and initiatives, but when it comes to aligning strategy scorecards, functional scorecards, insights from the frameworks, scenarios, alternative growth strategies… the general purpose tools fail.
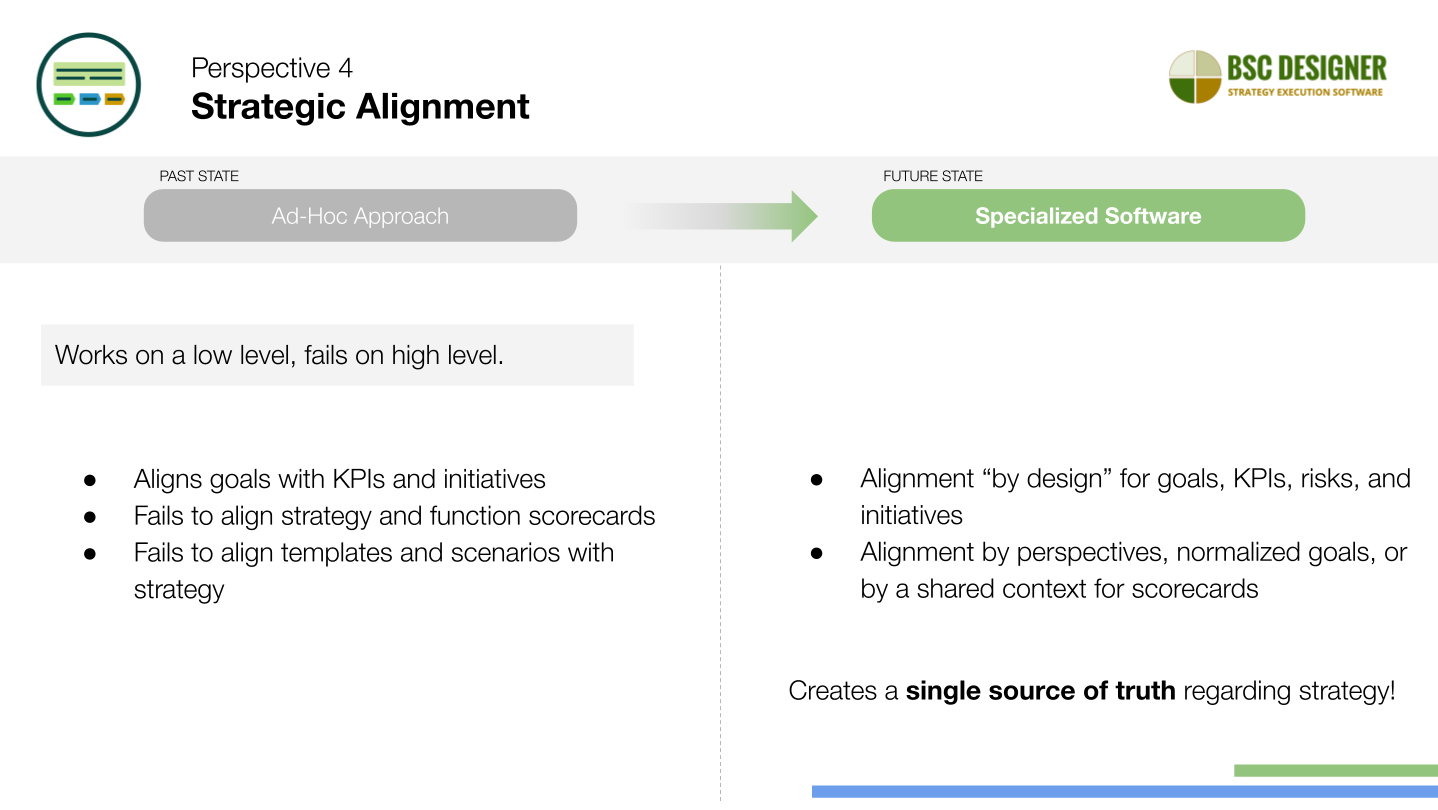
With BSC Designer, alignment is straightforward…
- On a low level, the goals, KPIs, risks, and initiatives are aligned by design inside the scorecard.
- On a high level, the scorecards can be aligned between each other by perspectives, normalized goals, or simply by a shared context.
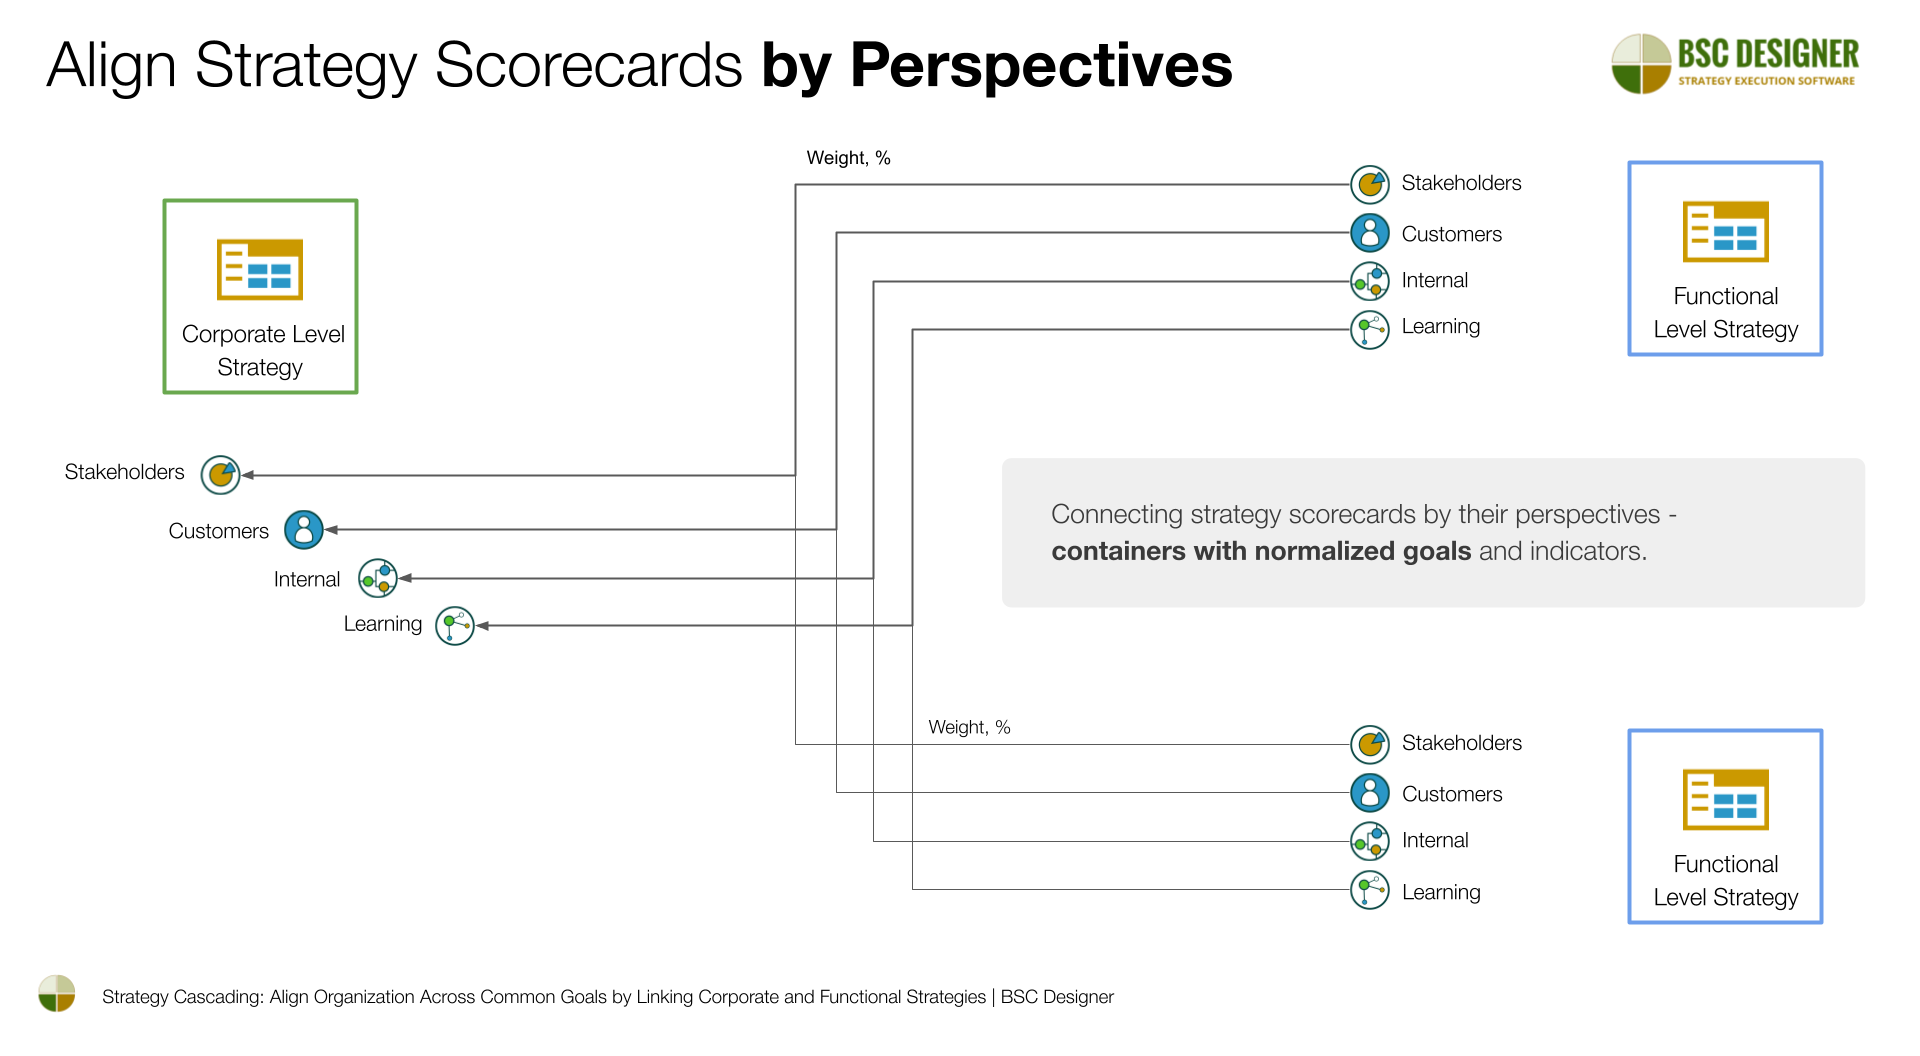
Altogether, those strategy and functional scorecards create a single source of truth regarding strategy.
Perspective 5. Reporting
Automatic reporting is another reason why companies are migrating to specialized strategic planning software.
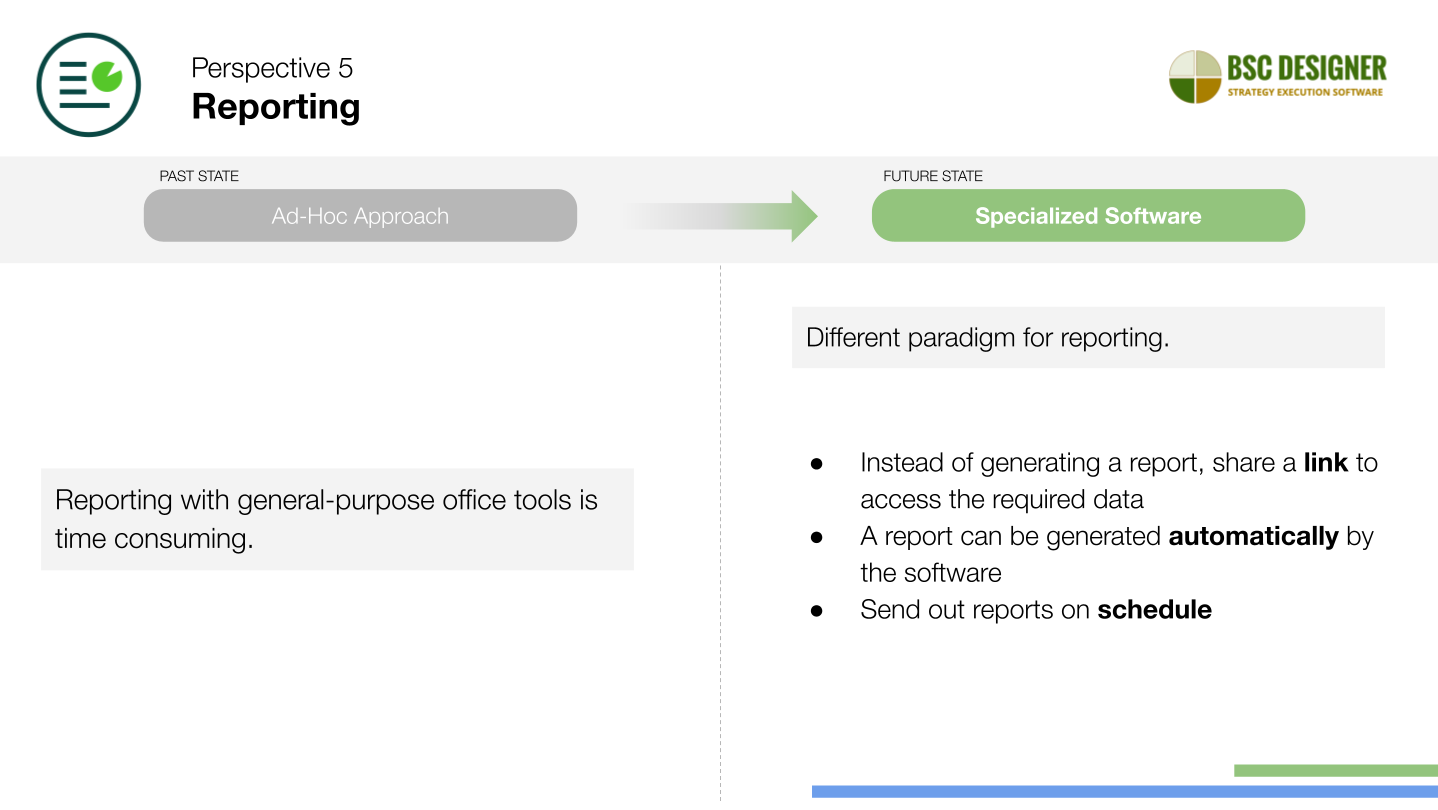
The specialized software provides a different paradigm for reporting.
- Firstly, the idea of reporting changes with the use of the tool. For many cases, there is no need to generate PDFs at all. Instead, one can simply share a link to the required data.
- Secondly, if there is a need for a report, it can be generated automatically by the software with the user-defined reporting profile.
- Thirdly, the software can send out those reports to the key stakeholders on schedule.
Perspective 6. Teamwork
Finally, lack of accountability is another problem for general-purpose software.
For example, there is no way to track who introduced the changes and why they were made.
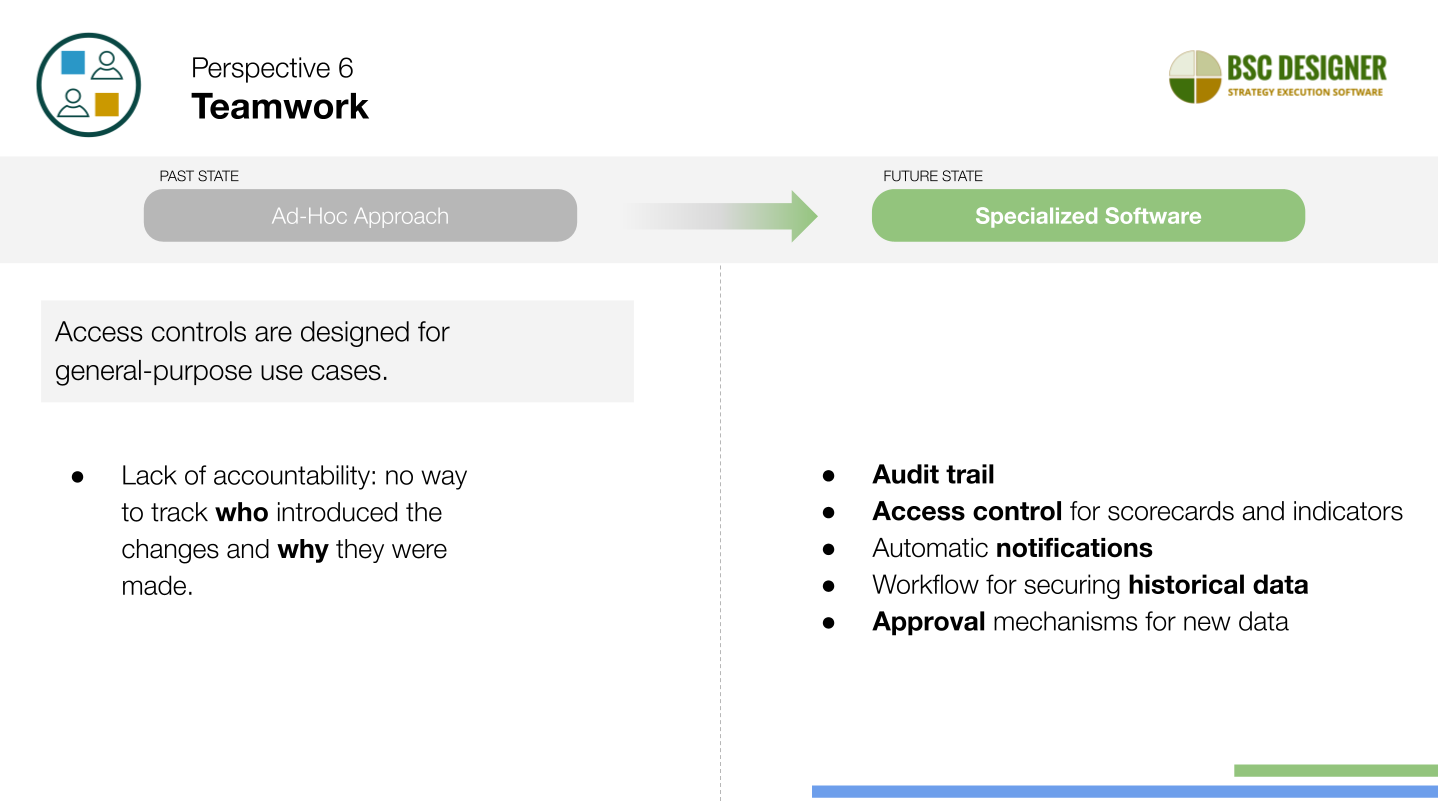
The specialized strategic planning tool is better equipped for strategy-related teamwork.
- There is an audit trail adapted for strategy workflow.
- Administrators can grant “modify” or “view” access for a group of scorecards, individual scorecards, or even specific indicators.
- The owners of the goals, KPIs, and initiatives receive automatic notifications.
- Targets and historical data can be locked for editing, and
- All the new data may be passed through the approval workflow.
Slides
- Access the slides for the ‘Change Agenda for Strategy Automation’
Video Tutorial
What Experts Say
We have interviewed some practitioners of the strategy scorecards, and among other questions, we asked their opinion about automation tools. Here you have some quotes:
From the interview with James Creelman:
Start with office tools, etc. After a year or so, migrate to a scorecard automation tool. Automation enables a company to get the best out of the scorecard – progress tracking and reporting, best practice sharing, etc.
From the interview with Jeroen De Flander:
I would suggest you either choose a standard software solution and change your process or postpone automation until you are 100 percent happy with the underlying process.
From the interview with Dan Montgomery:
Good visualization is necessary to create a shared strategic perspective amongst your team…
You need a common database of valid information, with a customizable front end that makes it actually useful to an individual, and good presentation tools to support conversation and decision-making.
Spreadsheets, by design, don’t do a good job of this.
From the interview with Gavin Lawrie (2GC):
In our view, a well designed Balanced Scorecard comprises a selection of about 20 financial and non financial measures, reported quarterly. The idea that you might need specialist software to support this activity for a single Balanced Scorecard is laughable. Our view is that specialist software is not required (and is sometimes a distraction) for reporting a single Balanced Scorecard – the software is typically expensive compared to the alternatives (e.g. Excel) and usual not much more functional.
However if you have to report many Balanced Scorecards in a period (more than five is our current thinking), automated reporting solutions become more attractive. It really depends on your organisation though, and there are no reliable hard-fast rules you can follow. What is clear however, is that none of the (about 100) available software solutions will help you design a Balanced Scorecard – they are simply automata that make reporting a Balanced Scorecard design easier (regardless of what the vendor might say).
What Users Say
Some users of BSC Designer shared their experience related to moving from scorecards created in spreadsheet software to BSC Designer.
We find BSC Designer a very ergonomic and intuitive tool. It quickly adapts to your way to carry out the information analysis. It is simple, fast and effective. BSC Designer helps to avoid using and maintaining home-made Excel sheets and produces professional results. Read more…
![]() Emmanuel Jaunart, founder of Mielabelo, Belgium
Emmanuel Jaunart, founder of Mielabelo, Belgium
We have a very good experience with BSC Designer, as this instrument can facilitate the implementation of the Balanced Scorecard in our unit. We have been trying to design a MS Excel spreadsheet but this approach proved to be more difficult than anticipated. BSC Designer, therefore, is very welcome attempt at an electronic version of the Balanced Scorecard. Read more…
![]() Pierre de Montfort, SA Army ADA School, Kimberley, South Africa
Pierre de Montfort, SA Army ADA School, Kimberley, South Africa
I was searching for a tool, which would help me to build an overall index for Supply Chain department performance. BSC Designer seems to be the right tool – easy to use and also to share with others. So far, I was trying to prepare something similar in MS Excel, however it was too complicated to update with new data. I will see if your BSC Designer will satisfy all of my needs. Read more…
Jiri Kratochvil, Manager Supply Chain Projects, PMI, Czech Republic
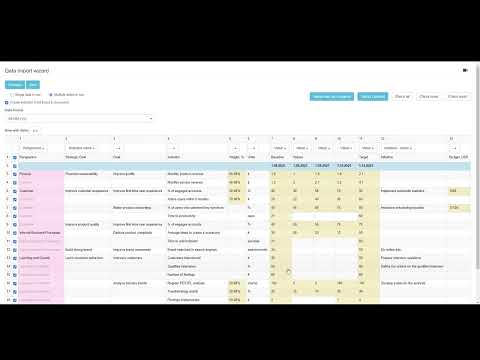
How to Migrate From Excel-based Scorecard to Specialized Software
We discussed the PROs and CONs of having a strategy or KPI scorecard in Excel. Let’s discuss how to migrate from such scorecards to the scorecard maintained in a specialized software.
Conclusions
As you can see, transitioning to specialized strategic planning software, such as BSC Designer, is a key success factor in effective strategy management.
- Recommended article: procurement for strategy planning software.
We invite you to sign-up with a free BSC Designer plan and put discussed ideas into practice. Feel free to contact our customer support team with any questions.
BSC Designer is strategy execution software that enhances strategy formulation and execution through KPIs, strategy maps, and dashboards. Our proprietary strategy implementation system guides companies in practical application of strategic planning.