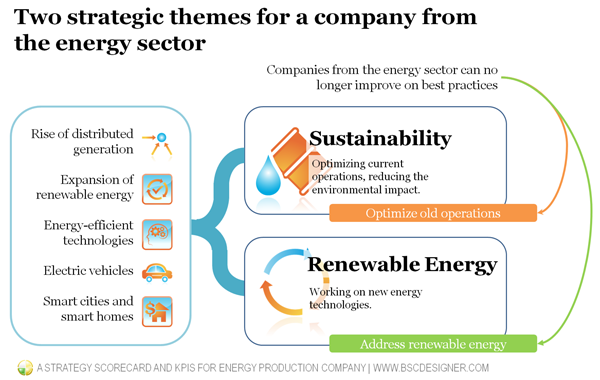
Companies from the energy sector can no longer improve on best practices. There is a strong need for a new sustainable strategy that will optimize old operations and address the challenges from the renewable energy.
In this article we will discuss:
- The threats and opportunities that the energy sector faces,
- Strategies that can be used to address those challenges, and
- Examples of the Key Performance Indicators that can be used.
Main threats and opportunities for the energy industry
PwC in their Global Power & Utilities Survey 20151 interviewed 70 senior executives from power and utility companies all over the world. Most of them (97%) agree about the significant market disruption by 2020 and anticipate (73% of the interviewed executives) major business model transformation.
Climate changes, resource scarcity, and technological breakthroughs will lead to reshaping the energy industry. We already see this in the form of:
- Rise of distributed generation
- Expansion of renewable energy
- Energy-efficient technologies
- Electric vehicles
- Smart cities and smart homes
Companies like IKEA, Walmart, and Apple have switched to the renewable electricity and are focused on reducing their carbon footprint. And there are even more ambitious projects, like powering Munich2, a city with over 1.3 million population with green electricity by 2025.
A strategy for a company from the energy sector
Regardless of the current market position, any company from the energy sector needs to prepare for the changes happening today. Obviously these changes cannot be made overnight, that’s why the updated strategy should take into account two themes:
- Sustainability.3 Optimizing current operations, where the main trend will be about reducing the environmental impact, particularly focusing on the low-carbon energy systems.
- Renewable Energy. Working on new energy technologies that are more sustainable from the environmental and economic points of view.
A good example of such an approach is Pacific Gas and Electric Company (PG&E), which recognizes a fast changing environment (a wide spread of solar power and electric vehicles in California) and sees their role in investing in the underlying infrastructure. This is an excellent way to address the distributed generation challenge.

Another example is India’s largest power company, Tata Power. While optimizing their coal-based production, they are investing in4 distributed energy resource systems and various technologies for a generation of renewable energy.
Major oil companies including Shell, Total, Chevron are focused on expanding their clear energy portfolio (solar, wind, biofuel)5.
New players, in some sense, are in a better position, as they have an opportunity to build their strategies from scratch with no need to support legacy technologies. For example, Tesla Energy6 sets an ambitious goal to enable a zero emission power generation.
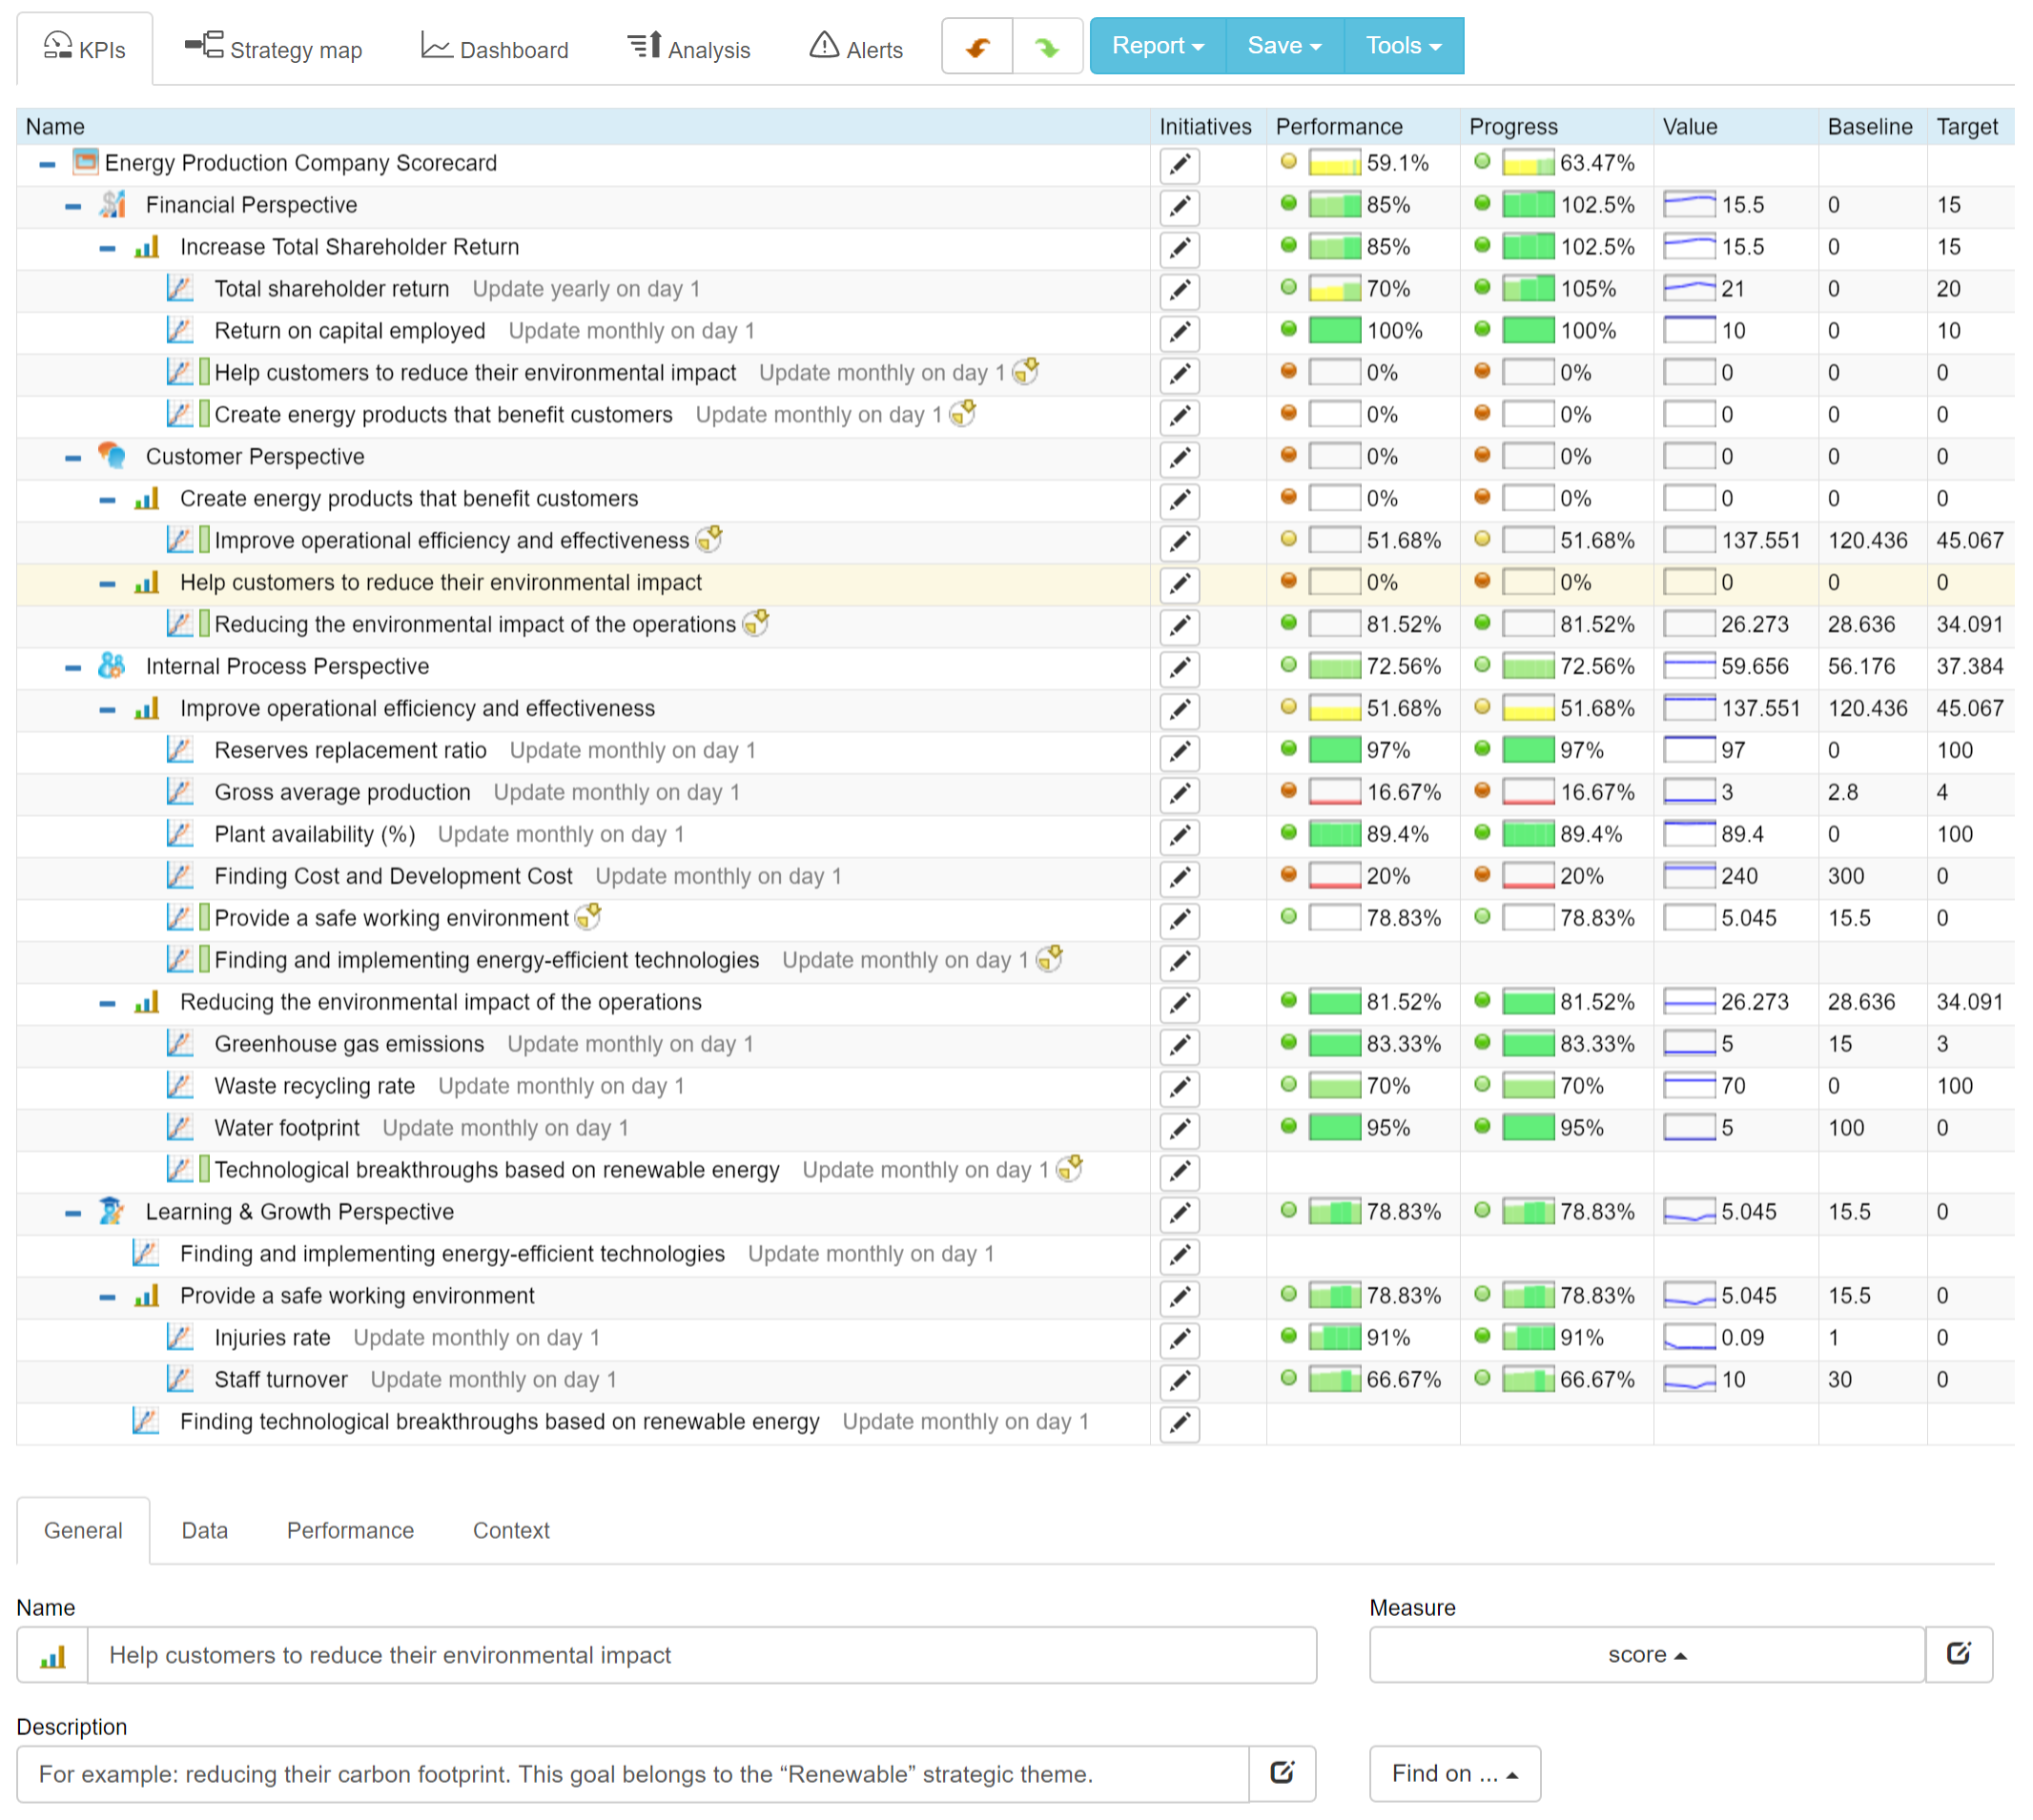
A Strategy Scorecard for the energy production company
Thinking about these changes in the format of the Balanced Scorecard strategy execution framework, we can focus on these directions.
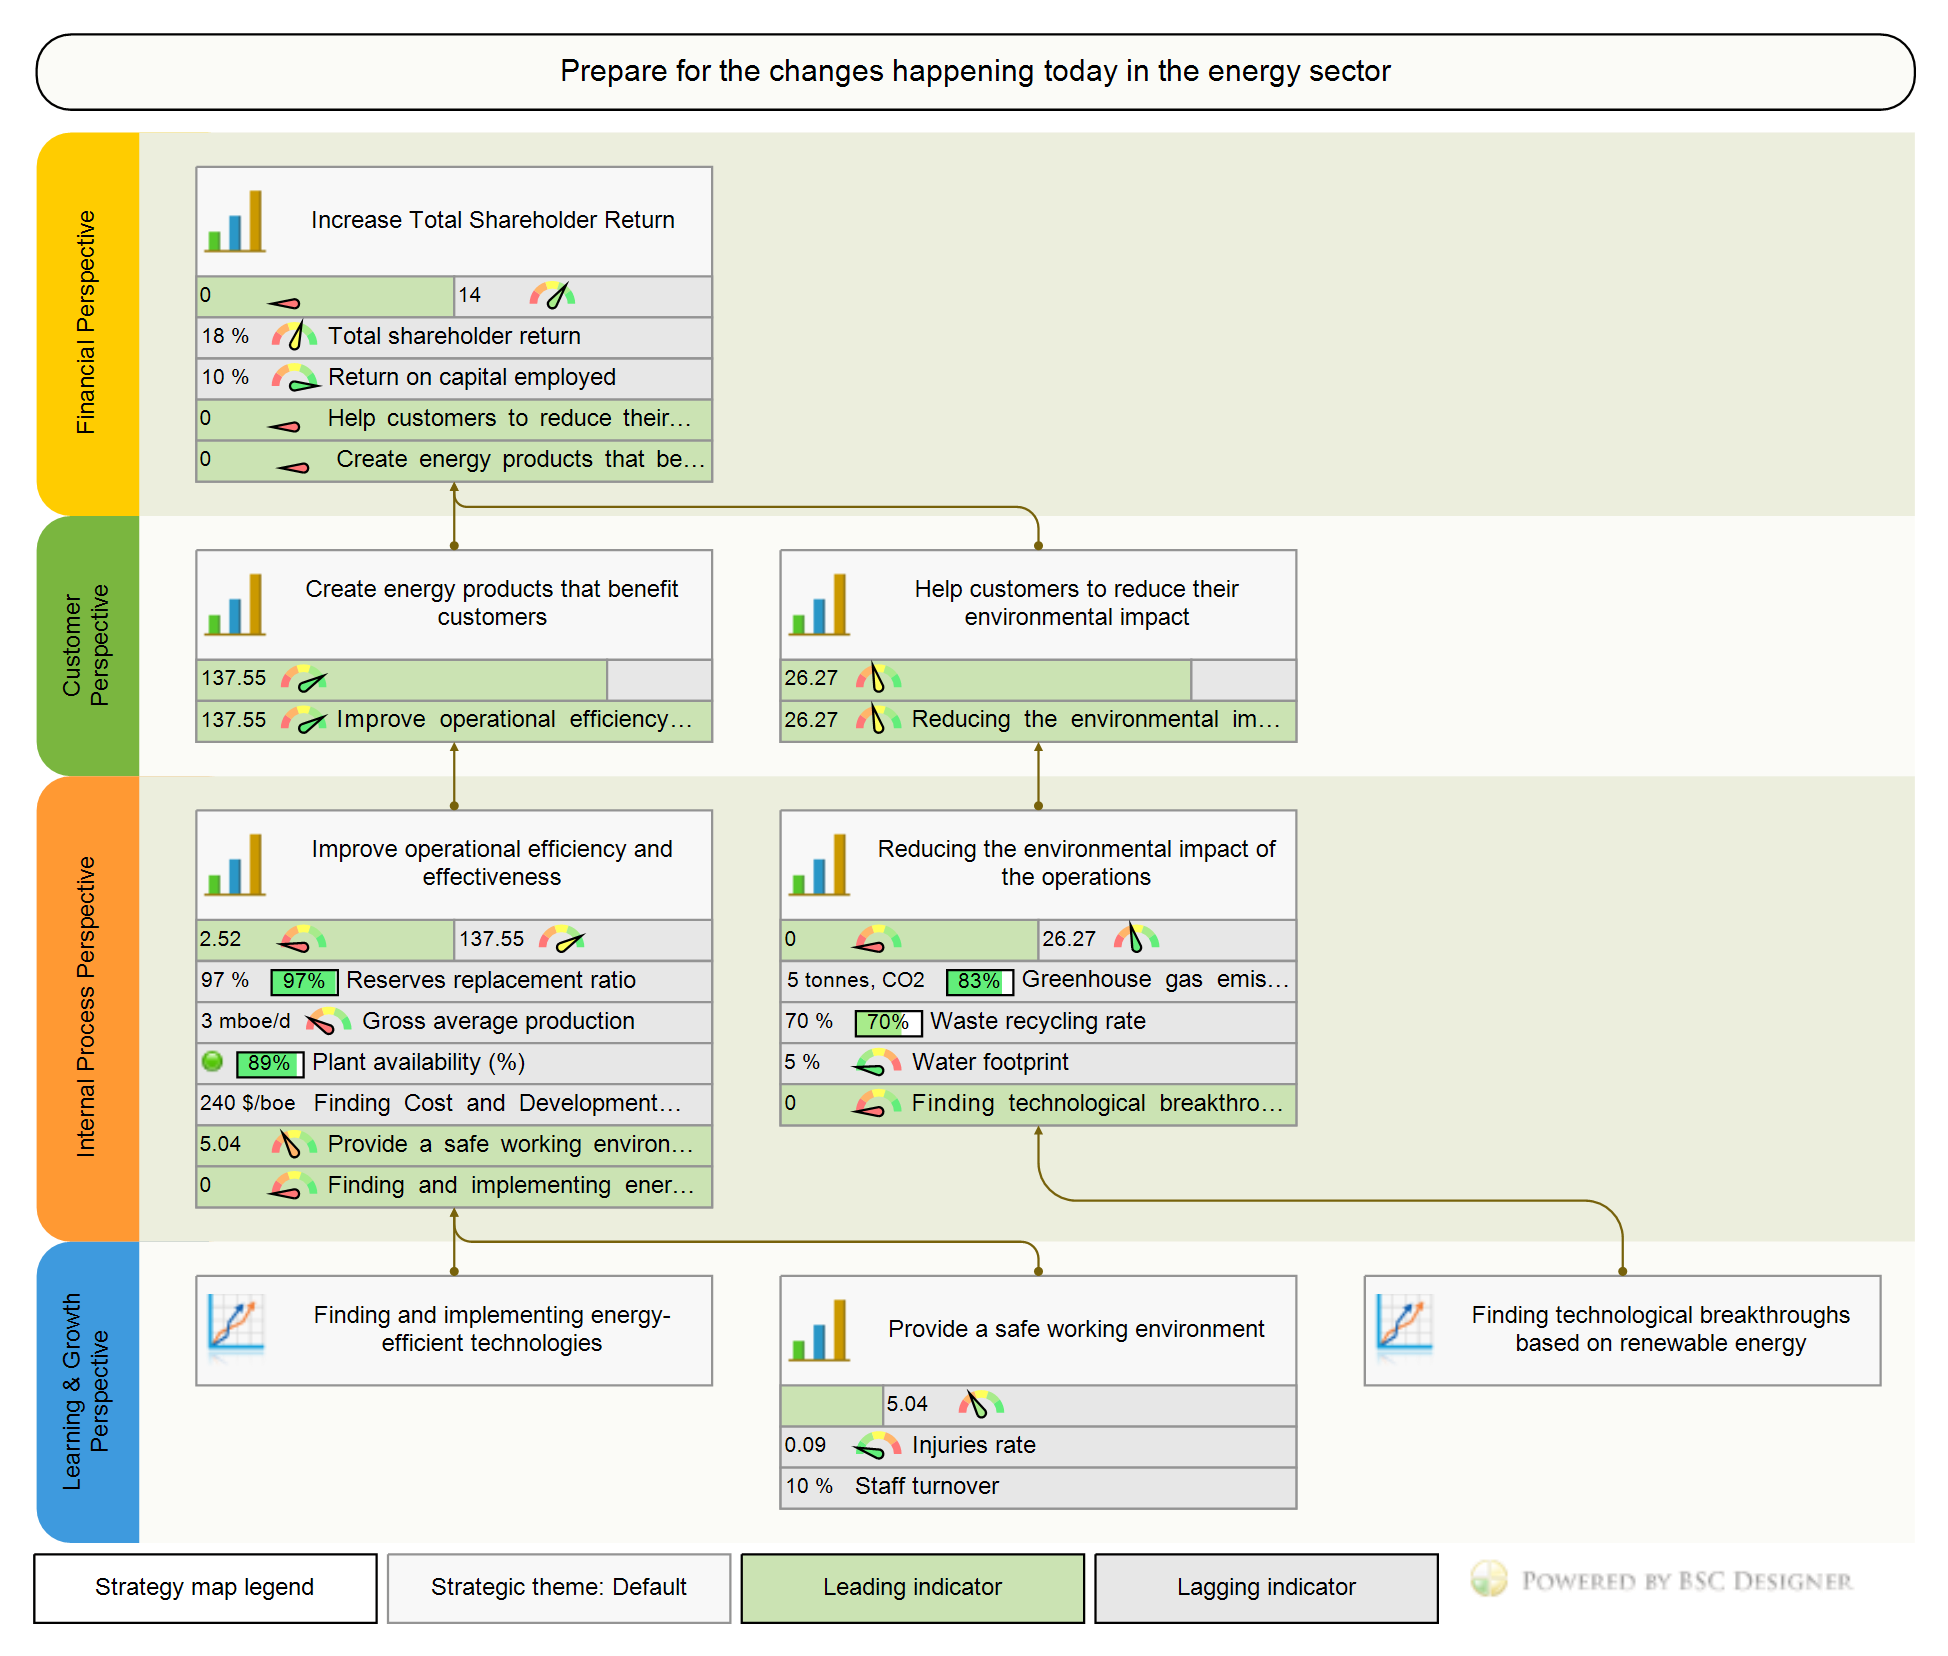
Finance
Here, we can map the expectations of the business’s shareholders.
Goal: Increase Total Shareholder Return
Possible indicators:
- Total shareholder return
- Return on capital employed
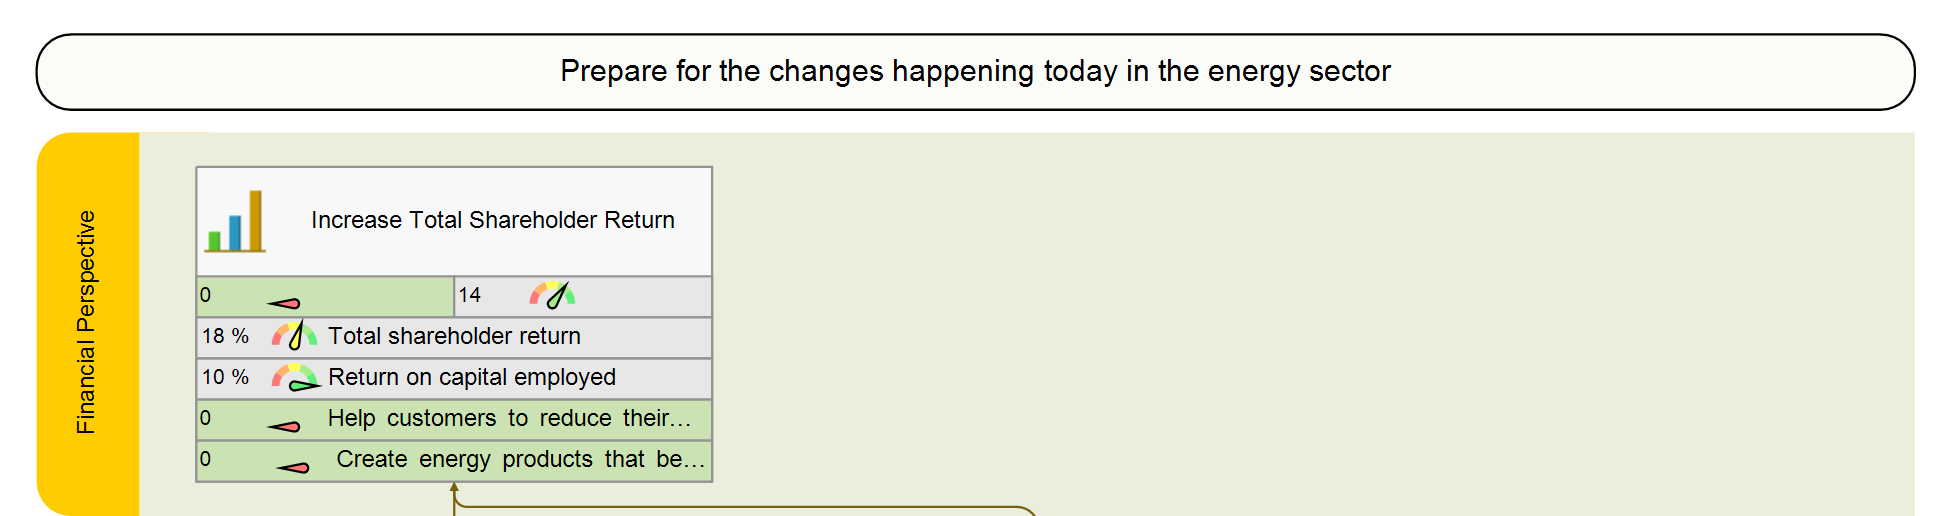
You might also want to track revenue that is generated by energy produced from fossil fuel and renewable sources.
Customers
In this perspective we need to map the customers’ expectation from the company. These might be:
Goal: Create energy products that benefit customers
For example: create a product that reduce energy costs. This goal belongs to the “Sustainability” theme as it was described above.
Goal: Help customers to reduce their environmental impact
For example: reducing their carbon footprint. This goal belongs to the “Renewable” strategic theme.

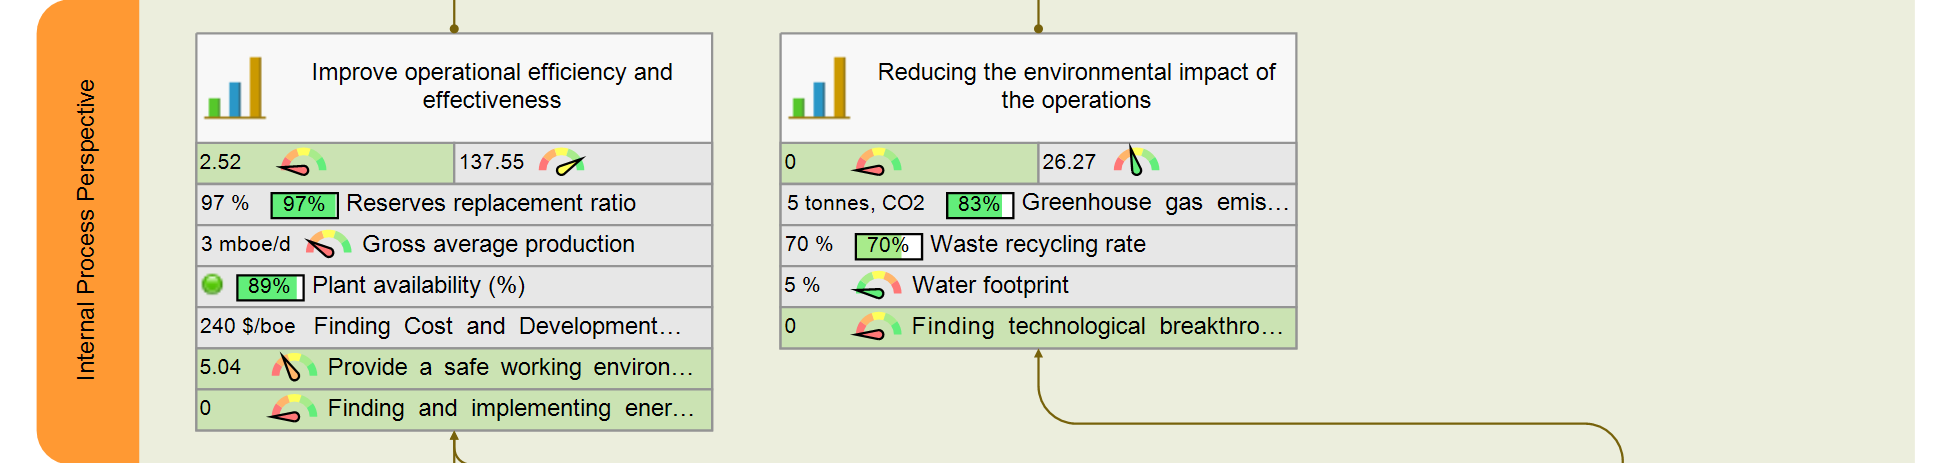
Internal
In the “Internal process” perspective we need to map the goals that will ensure achieving the goals specified in the Customer perspective above.
For the “Sustainability” theme there can be 2 goals:
Goal: Improve operational efficiency and effectiveness
Aligned leading indicators:
- Reserves replacement ratio (%)
- Gross average production (mboe/d)
- Plant availability (%)
- Finding Cost and Development Cost (per boe)
and
Goal: Reducing the environmental impact of the operations
Aligned indicators:
- Greenhouse gas emissions
- Waste recycling rate, %
- Water footprint
As for the “Renewable” theme, the goal might be formulated as broad as:
Goal: Implementing green energy technologies
Aligned indicators:
- % of energy produced by renewable sources
- Infrastructure reliability, %
If you need to have more process-oriented metrics, it helps to focus on two segments:
- Upstream (exploration, development, production, and storage) and
- Downstream (manufacturing, transportation, and supply).
In a case of major companies, a good idea would be to separate venture funds related to the green investments from existing business, as Andreas de Vries argues 7, otherwise, innovative impact of those funds will be limited.
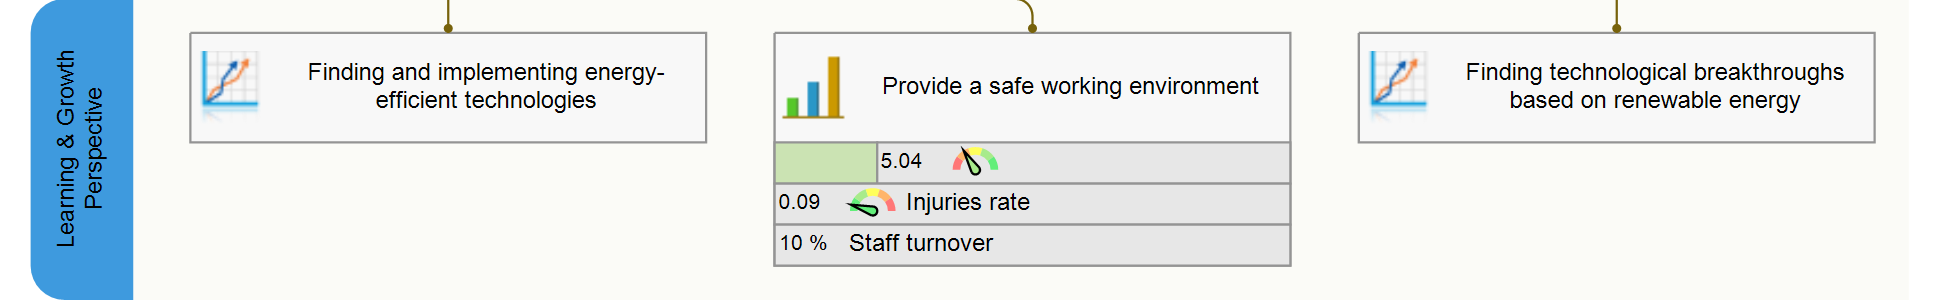
Learning and growth
Finally, in the “Learning and Growth” perspective an organization needs to shape their learning directions.
Goal: Finding and implementing energy-efficient technologies (belongs to the sustainability theme)
Goal: Finding technological breakthroughs based on renewable energy (belongs to the renewable energy theme)
Goal: Provide a safe working environment
Aligned indicators:
- Injuries rate, or its equivalent Lost Time Injury Frequency (LTIF)
- Staff turnover, %
The mentioned learning goals can be further detailed on the scorecard for innovations that helps to formalize and track the innovation funnel.
Finding more specific indicators
As you can see, not all of the goals have indicators aligned with them. You can use our KPI system to find more specific indicators that will be tailor-made for your organization.
If you need some sources of inspiration or benchmarks, you can check out the KPIs used by other companies from the energy sector:
- BP Global – Our key performance indicators
- Shell KPIs
- Statoil KPIs (see page 12)
- Tullow Oil KPIs
Software automation
The strategy map that we showed in this article was produced with BSC Designer software. You can use this template and customize it for your own needs. It is available in the cloud-based BSC Designer Online (check it out online now).
Conclusions
The landscape of the energy industry is changing rapidly. The energy companies are now in a transitional period and have an opportunity to become more sustainable with old operations and also add new renewable technologies in their service portfolio. Having a well-designed strategy map is an excellent way to communicate a new sustainable strategy to the employees, customers, and shareholders.
What do you think about sustainability as a strategy for energy companies? Do you have some positive or negative examples? Feel free to share your thoughts in the comments.
What's next?- Follow our
 Strategy Implementation System to align stakeholders, strategic ambitions, and business frameworks into a comprehensive strategy.
 - Automate strategic planning with BSC Designer by organizing goals, initiatives, risks, and KPIs into scorecards.
More About Strategic Planning


- PwC Global Power & Utilities Survey 2015 ↩
- SWM Renewable Energies expansion campaign ↩
- Sustainability Balanced Scorecard, Aleksey Savkin, 2019, bscdesigner.com, ↩
- TATA POWER: Lighting up Lives! ↩
- Shell Leads Big Oil in the Race to Invest in Clean Energy, Timothy Abington, Kelly Gilblom, Bloomberg LP, 2019 ↩
- Tesla Energy ↩
- Thinking the Unthinkable: Strategy Options for an Age of Disruption in the Energy Industry, Andreas de Vries, Elektor Magazine, 2015 ↩
![]() CEO | Author | Speaker
CEO | Author | Speaker
BSC Designer is strategy execution software that enhances strategy formulation and execution through tangible KPIs. Our proprietary strategy implementation system reflects our practical experience in the strategy domain.
Well designed Score Card! just wondering what developments have so far taken place in the development of more KPIs for the renewable energy sector since then.
I believe the main trend is still the same as described in the article. As for the more specific KPIs, they can certainly be defined in the more specific business context. Like, for example, renewable energy applied to the automotive sector or smart houses. Or, taking example from “10 Step KPI System” book, we can apply metrics used for innovations to the renewable energy domain.