The way the complexity is perceived by customers defines whether your product or service will be a success or not. In this article, we’ll discuss how to find indicators of complexity and align them with business context.
The “Complexity” Term
Let’s start with the term itself. The definition of complexity depends on the domain and language used1.
- For this article, let’s agree that a system is complex when it has many components interconnected in some way that is perceived as something difficult to understand (or difficult to separate2 if you prefer).
We might also define a complex system as one that can generate unexpected results. Complexity can also be defined as an antonym of simplicity, as a smart way to say, “it doesn’t look simple!”
Don’t we reinvent “quality” or “usability” terms? Those concepts overlap. I see complexity as an umbrella term that (depending on the stakeholder) covers usability, architecture, maintainability, quality, etc.
Getting back to the business reality:
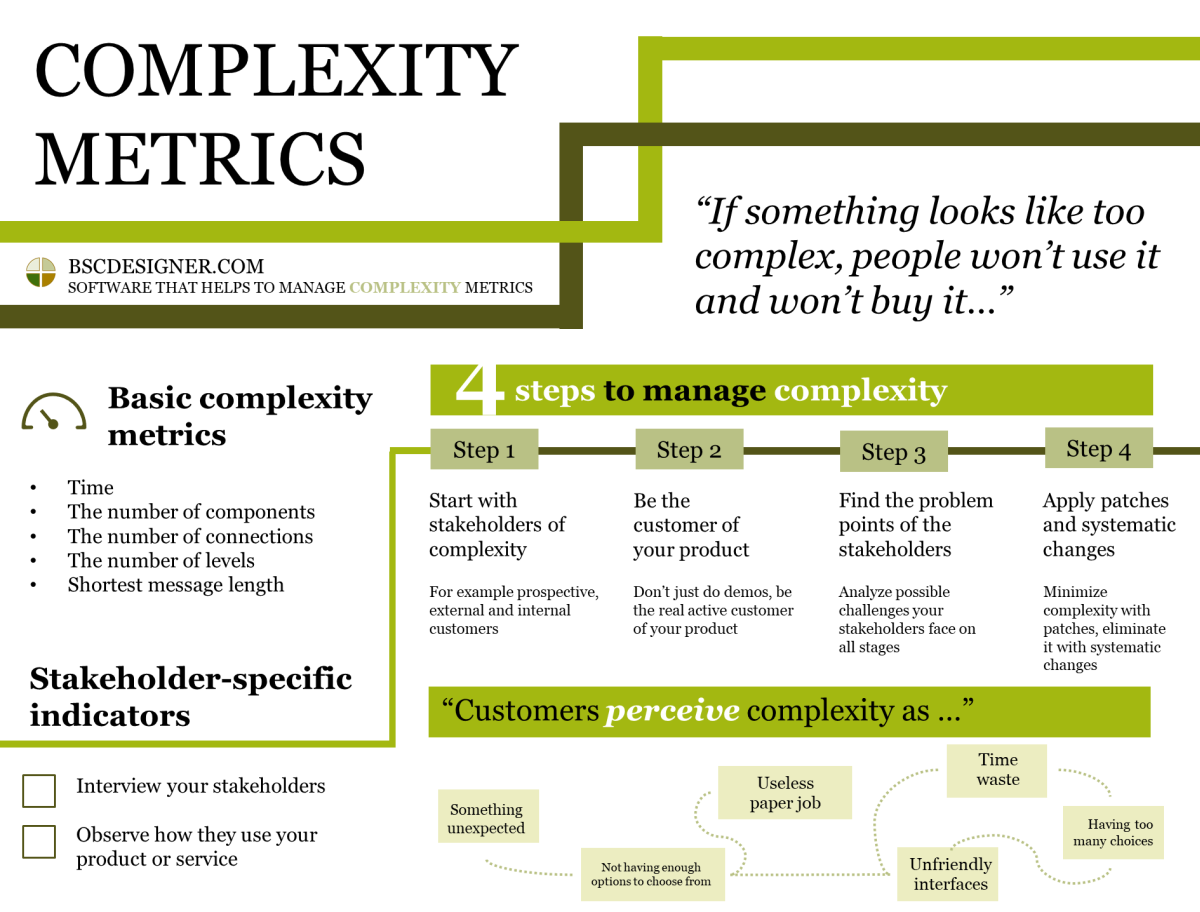
If something looks like too complex, people won’t use it and won’t buy it.
Why Does “Complexity” Matter for Business?
Does complexity matter for your clients? Obviously, customers of your product or service won’t use a “complexity” term, but they deal with complexity every day. They perceive complexity by:
- Time waste,
- Useless paper job,
- Unfriendly interfaces,
- A painful feeling that something is not working as expected,
- Having too many choices, and
- Not having enough options to choose from…
Supermarket Example
For example, there is a supermarket next to the place I live. They are good at dealing with complexity. If you buy fruit, there you don’t need to weigh them yourself, the cashier will do it for you. Compare this to other supermarkets where you need to find the electronic weights that are working and pick the right number (with a variety of available fruits and vegetables, it’s a tricky task). In a traditional supermarket, the choice of products is identical, but the whole experience feels more complex.
The perception of complexity becomes an important factor in the choices people make every day. If you want your business to compete better, learn to find and manage unnecessary complexities.
Four Steps to Manage Complexity
OK, complexity might be an issue for any business. What’s next? How do we manage it? Here are some ideas to try.
Step 1. Define Stakeholders of Complexity
The word “Perceived” in the previous paragraph is a keyword. When we say the product or service is too complex, we mean it is too complex for someone…
- Have a look at the website of your organization. Does it look like a complex one for you? Probably not, if you have been using it for a long time. What about someone who just came from a search engine and has 2-3 seconds to find the right information?
Start thinking about complexity from the viewpoint of the most important stakeholders. Those can be your customers, prospective customers, or your high-performing employees. For example, in this article, we discuss the complexity from the viewpoint of two stakeholders – your clients and your customer service.
Step 2. Be the Customer of Your Product
Your goal is to understand how customers feel about complexity. The basic thing to do is what the business books teach us – put yourself in the customer’s shoes!
Probably the “eating your own dog food” slang expression describes better how aggressive you should be about trying to play the role of the customer…
For example, in my account at webbsc.com a second name of my profile is “Savkín” (with the i-acute).
Thanks to this small adjustment, we were able to detect a rare problem with encoding early on.
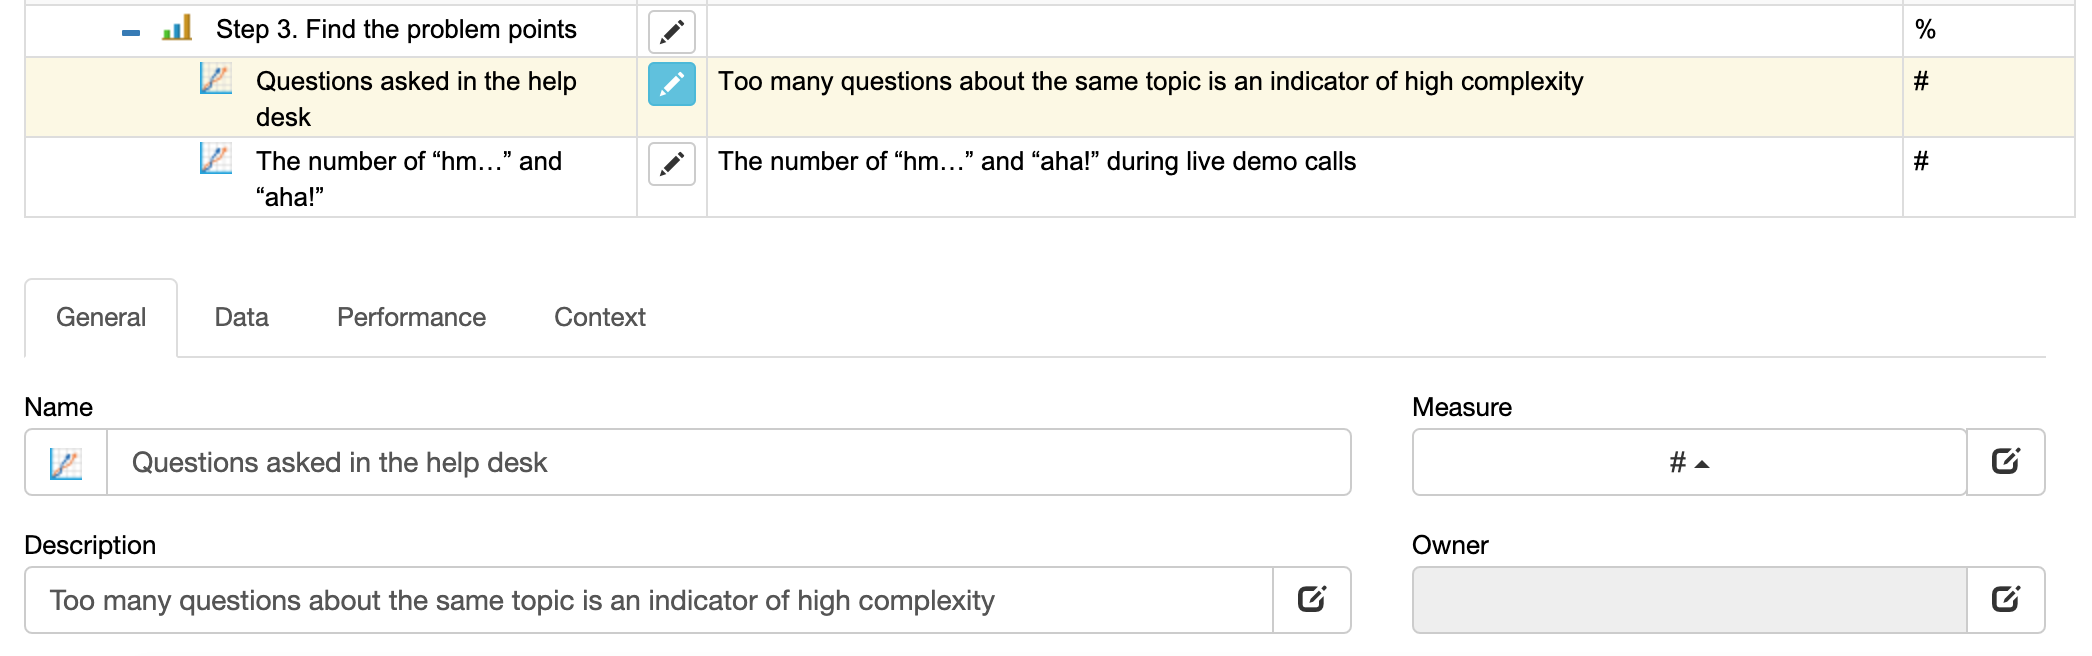
Step 3. Find the Problem Points
Looking at the painting of Salvador Dali, it seems like human imagination has no limits. Still, we cannot imagine all possible variations of the challenges that our customers face when…
- Searching for
- Trying
- Buying
- Integrating
- Using, and
- Maintaining
our products.
The solution is to take a close look at the possible problematic points:
- What are the top 10 questions customers ask by phone?
- What queries are searched the most on your website?
- What pages of the knowledge base have the highest “time on page?”
- How do people talk about your product in official testimonials and social media? (find some insights in the article about social media metrics)
- What questions do people normally ask during sales presentation?
Customer surveys is also a viable option, if you do it in the right way3.
Step 4. Apply Patches and Systematic Changes
Implement a culture of systematic approach to problem solving in your team. Let’s say you found out that there is a feature in your product that makes your customers unhappy. Here are two possible solutions:
- Creating another explanatory video would be a patch,
- Apply a systematic approach, e.g. reworking your product so that there is no need to use this feature or it is used in a completely different way.
Sometimes, we need quick patches, ad hoc solutions, etc., but think about how they will change the complexity for other customers (=will things be easier for other customers after implementing it?).
Let’s discuss some examples to illustrate this 4-step approach.
Example from Our Practice: Complexity in BSC Designer Software
If you were using BSC Designer before September 2018, you would know that there were two tabs in the software – “Business Goals” and “KPIs.”
- Back in 2011, this structure looked like a logical one – users had their goals on one tab, and then they aligned KPIs with those goals.
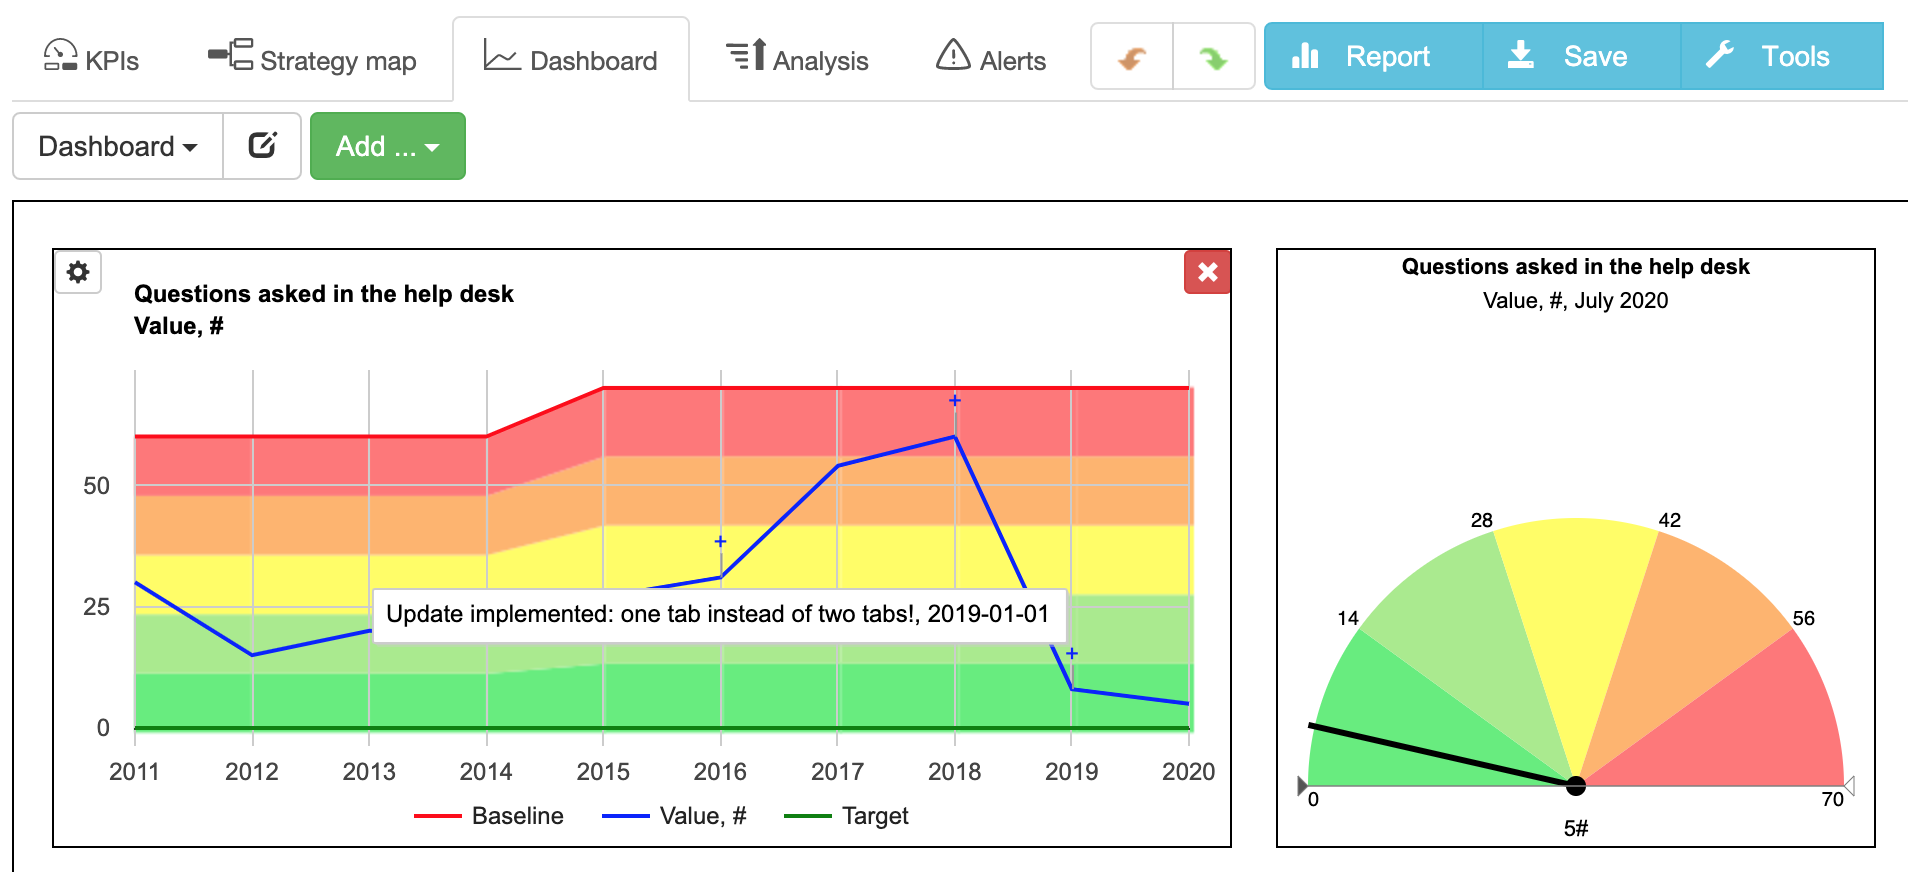
- By the end of 2017 the needs of the market had changed, and we were completely sure that having two tabs made things too complex for our users.

How did we get to this conclusion?
- Metric 1. We counted the number of “hm…” and “aha!” during live demo calls
- Metric 2. We looked at the questions people asked in the help desk
- Metric 3. We analyzed our own experience, as we created many scorecards with our software (including those free examples)
People had to duplicate their goals on both “Business goals” and “KPIs” tab, and it was not the best user experience.
All those findings led us to some patches:
- We added more information to the user manual.
- Implemented some additional dialogs that helped customers to manage goals and KPIs easier.
It helped to solve the complexity problem temporarily. The strategic goal was to update software with several conditions:
- Have one tab, not two (no duplication of KPIs)
- Keep the same functions
- Make the transition easy for old users
Did we eliminate the complexity? Absolutely!
Restaurant Example: There is No “One Size Fits All” Solution to the Complexity Challenge
A popular “El Rancho de Nino” restaurant, 10 minutes’ drive from Tenerife South Airport, eliminated some complexities for their clients. They thought about the possible questions that a customer might have, and they put the solutions right on the walls:
- The menu with the prices
- The way to the WC
- The way to pay
- The way to give the feedback

Probably, the way to ask for the feedback is not the most effective one, but the rest seemed to be working like a charm (impressive number of positive reviews on Google is the proof).
By the way, how could we quantify complexity in this case? What metric could we use? How about this one:
- The number of “how do I ….?” or “Where is … ?” questions guests asked.
The owner of another restaurant might reasonably argue: “That’s great idea, but I cannot put a huge WC sign, it simply won’t fit the elegant design of our restaurant!” That’s true, and that’s what makes managing complexity such a challenge.
Need more case studies of measuring and managing complexity? Check out this article, where we talk about complexity in the context of customer service.
Example: Eliminating Complexity vs. Moving Complexity to Another Stakeholder
Let’s have a look at the example with the supermarket above. The complexity (the need to weigh fruits) was not eliminated, but it was moved from one stakeholder (the customer) to another (the cashier).
- Was it a good move?
Probably yes, the cashiers have additional responsibility, but obviously, they will do it faster and more accurately.
What would be a better option? A better option would be to eliminate this complexity completely. For example, all fruits could be sold in sealed packages with a price tag. While this sounds like a good idea, we have to be careful:
- Eliminating one complexity normally results in adding more complexities or changing the stakeholder of complexity
Following the fruit example, the sealed package reduces the ability to choose the fruit in the right quality and buy the needed amount. It also affects the way fruit should be stored, both in the supermarket and in your fridge (adding more complexities). It’s easier for a shopper to pick a package of fruit in plastic with a price tag, but this will complicate the life of the person who will have to recycle plastic more often.
Measuring Complexity
If we want to deal with complexity seriously, then we need to support the discussed ideas with some data.
To improve complexity figures, we need to measure them first.
Is Complexity Measurable?
Can you measure a complexity of something? For example, a complexity of your product or service? Let’s do a quick test:
- Can you say that your product is less (or more) complex than, for example, the product of the competitors?
If the answer is affirmative, then we can measure complexity.
Basic Complexity Metrics
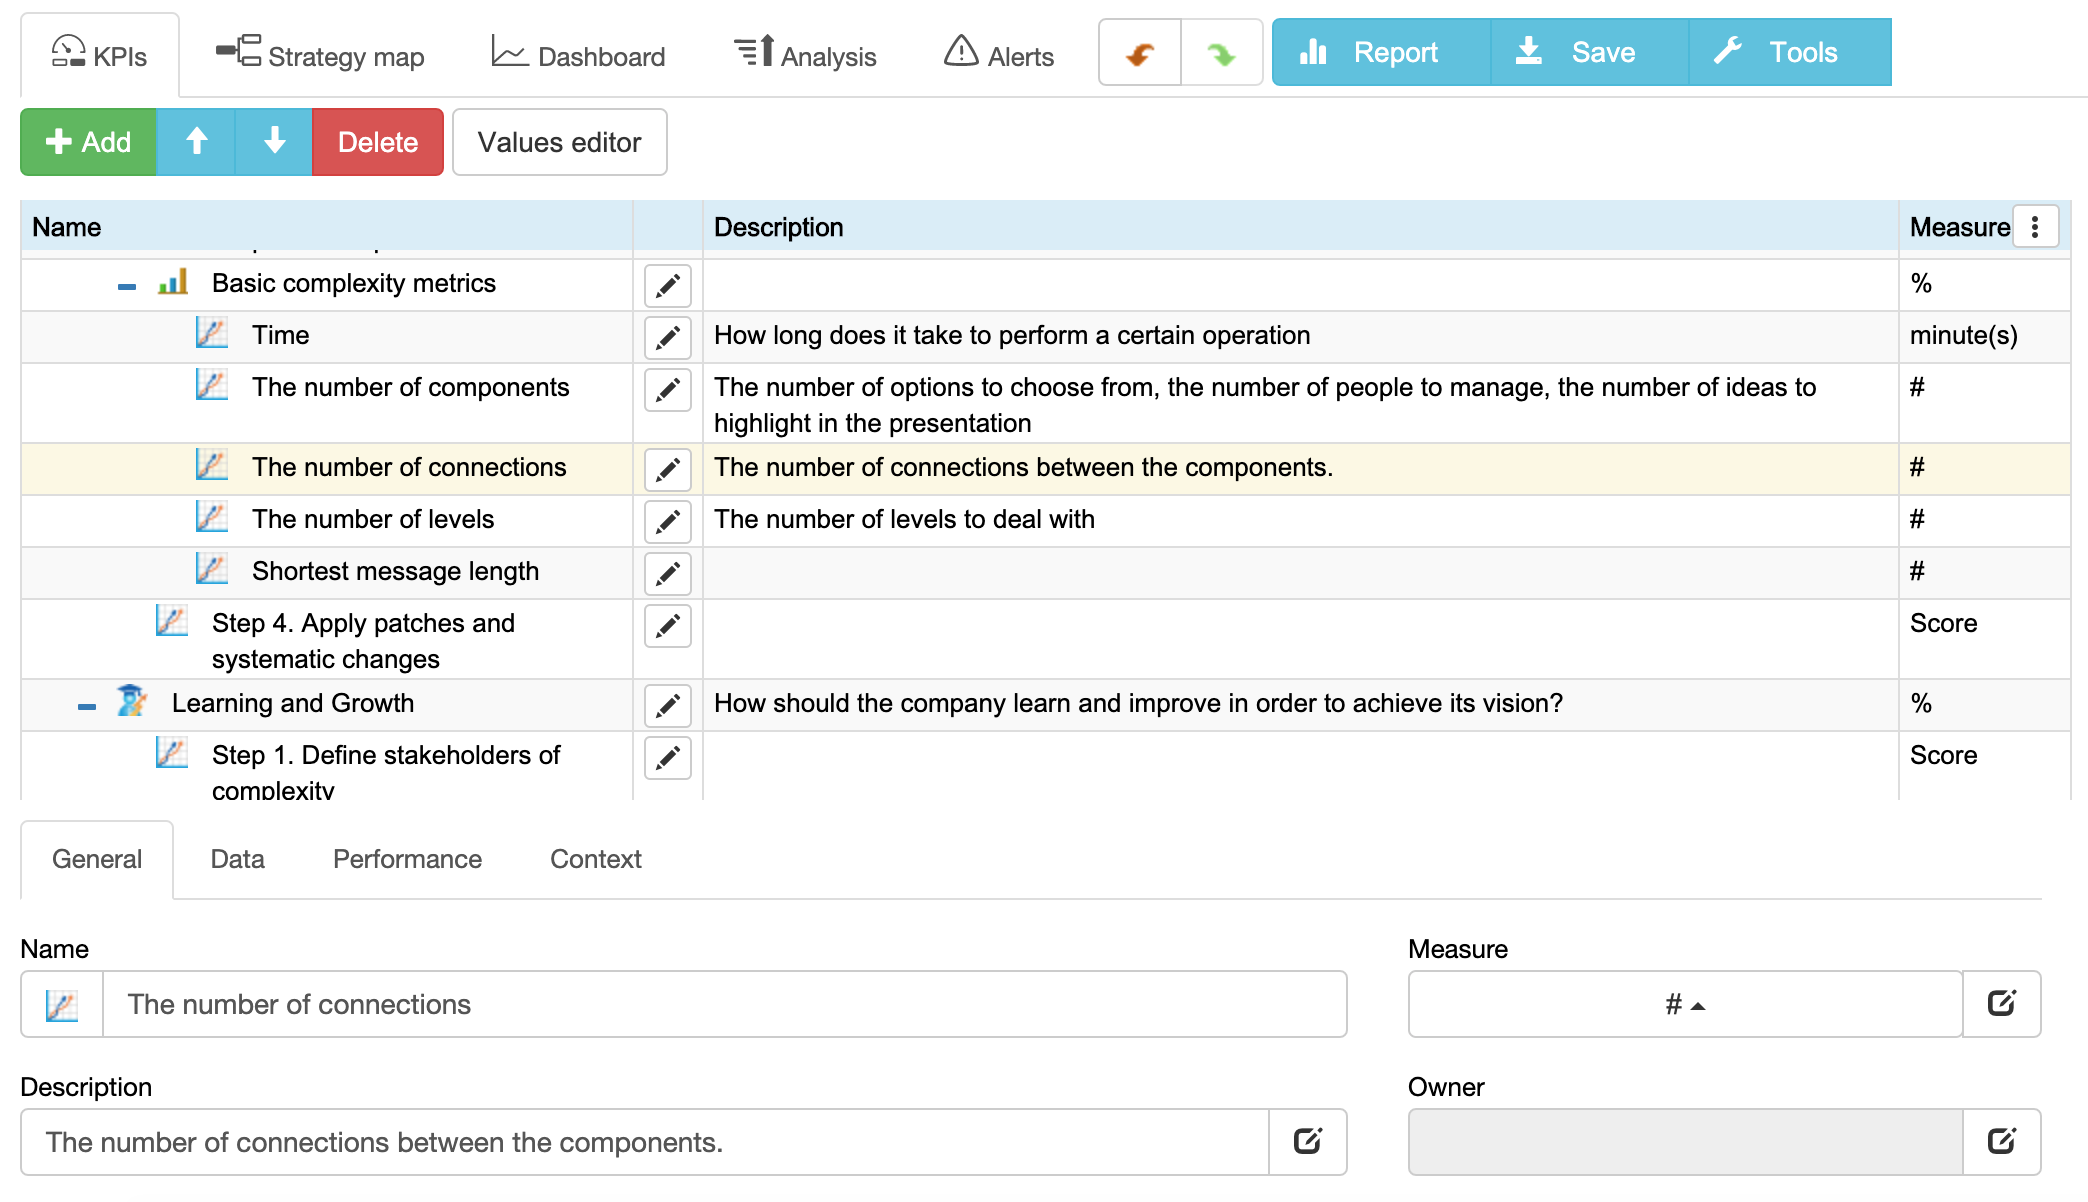
Complexity is domain- and language-specific, but still there are some typical complexity metrics that one can start with:
- Time (how long does it take to perform a certain operation?)
- The number of components to deal with (the number of options to choose from, the number of people to manage, the number of ideas to highlight in the presentation)
- The number of connections between the components. 5 ideas with 4 connections and 5 ideas connected in a spaghetti style are perceived differently.
- The number of levels to deal with (if you have a presentation with 3 key ideas, each supported by 3 arguments, it is perceived better than a list of 9 ideas).
- Shortest message length. Any product has a kind of user manual, this derivative of time and number metrics is useful. Think about the length of the shortest message to convey certain information.
I remember a ferry trip from Huelva to Tenerife. Upon arrival, there was an announcement repeated three times. A translation to English can be something like this: “Passengers with cabins on board have the availability to leave them free as soon as possible.” It’s pretty clear what message polite Spanish people were trying to deliver, but it is definitely way too complex.
My recommendation is to test the messages in your manual and interface for the shortest message length. Probably, there is an easier way to explain the same information. This approach will pay you back, especially if you localize your texts in many languages (we experienced this when localizing BSC Designer).
Quick Estimation of Product Complexity
In the 10 Step KPI System book, I underlined the importance of quick estimations.
What can be a quick estimation for product complexity? Have a look at this metric:
- Number of support specialists per number of clients, or
- Number of support specialist per product implementations
Products with bad complexities require more maintenance efforts. Reducing product complexities (for the customer stakeholder) can be validated by two mentioned metrics.
Stakeholder-Specific Indicators
After reviewing basic complexity metrics, focus on the stakeholder-specific indicators. How can you get them? Interview your stakeholders and/or observe how they use your product or service.
In the example with the supermarket, one did not need advanced techniques to find out that people were confused when weighing the fruit. It could be observed directly in the fruit section of the supermarket.
The findings from the interviews and observations can be quantified and converted into complexity metrics. We discussed how to do this, the possible pitfalls and the best practices in the 10 Step KPI System book.
Takeaways
Let’s summarize some ideas from the article:
- The definition of complexity is domain- and language- specific.
- Complexity is an important factor for stakeholders (even if they don’t use the term).
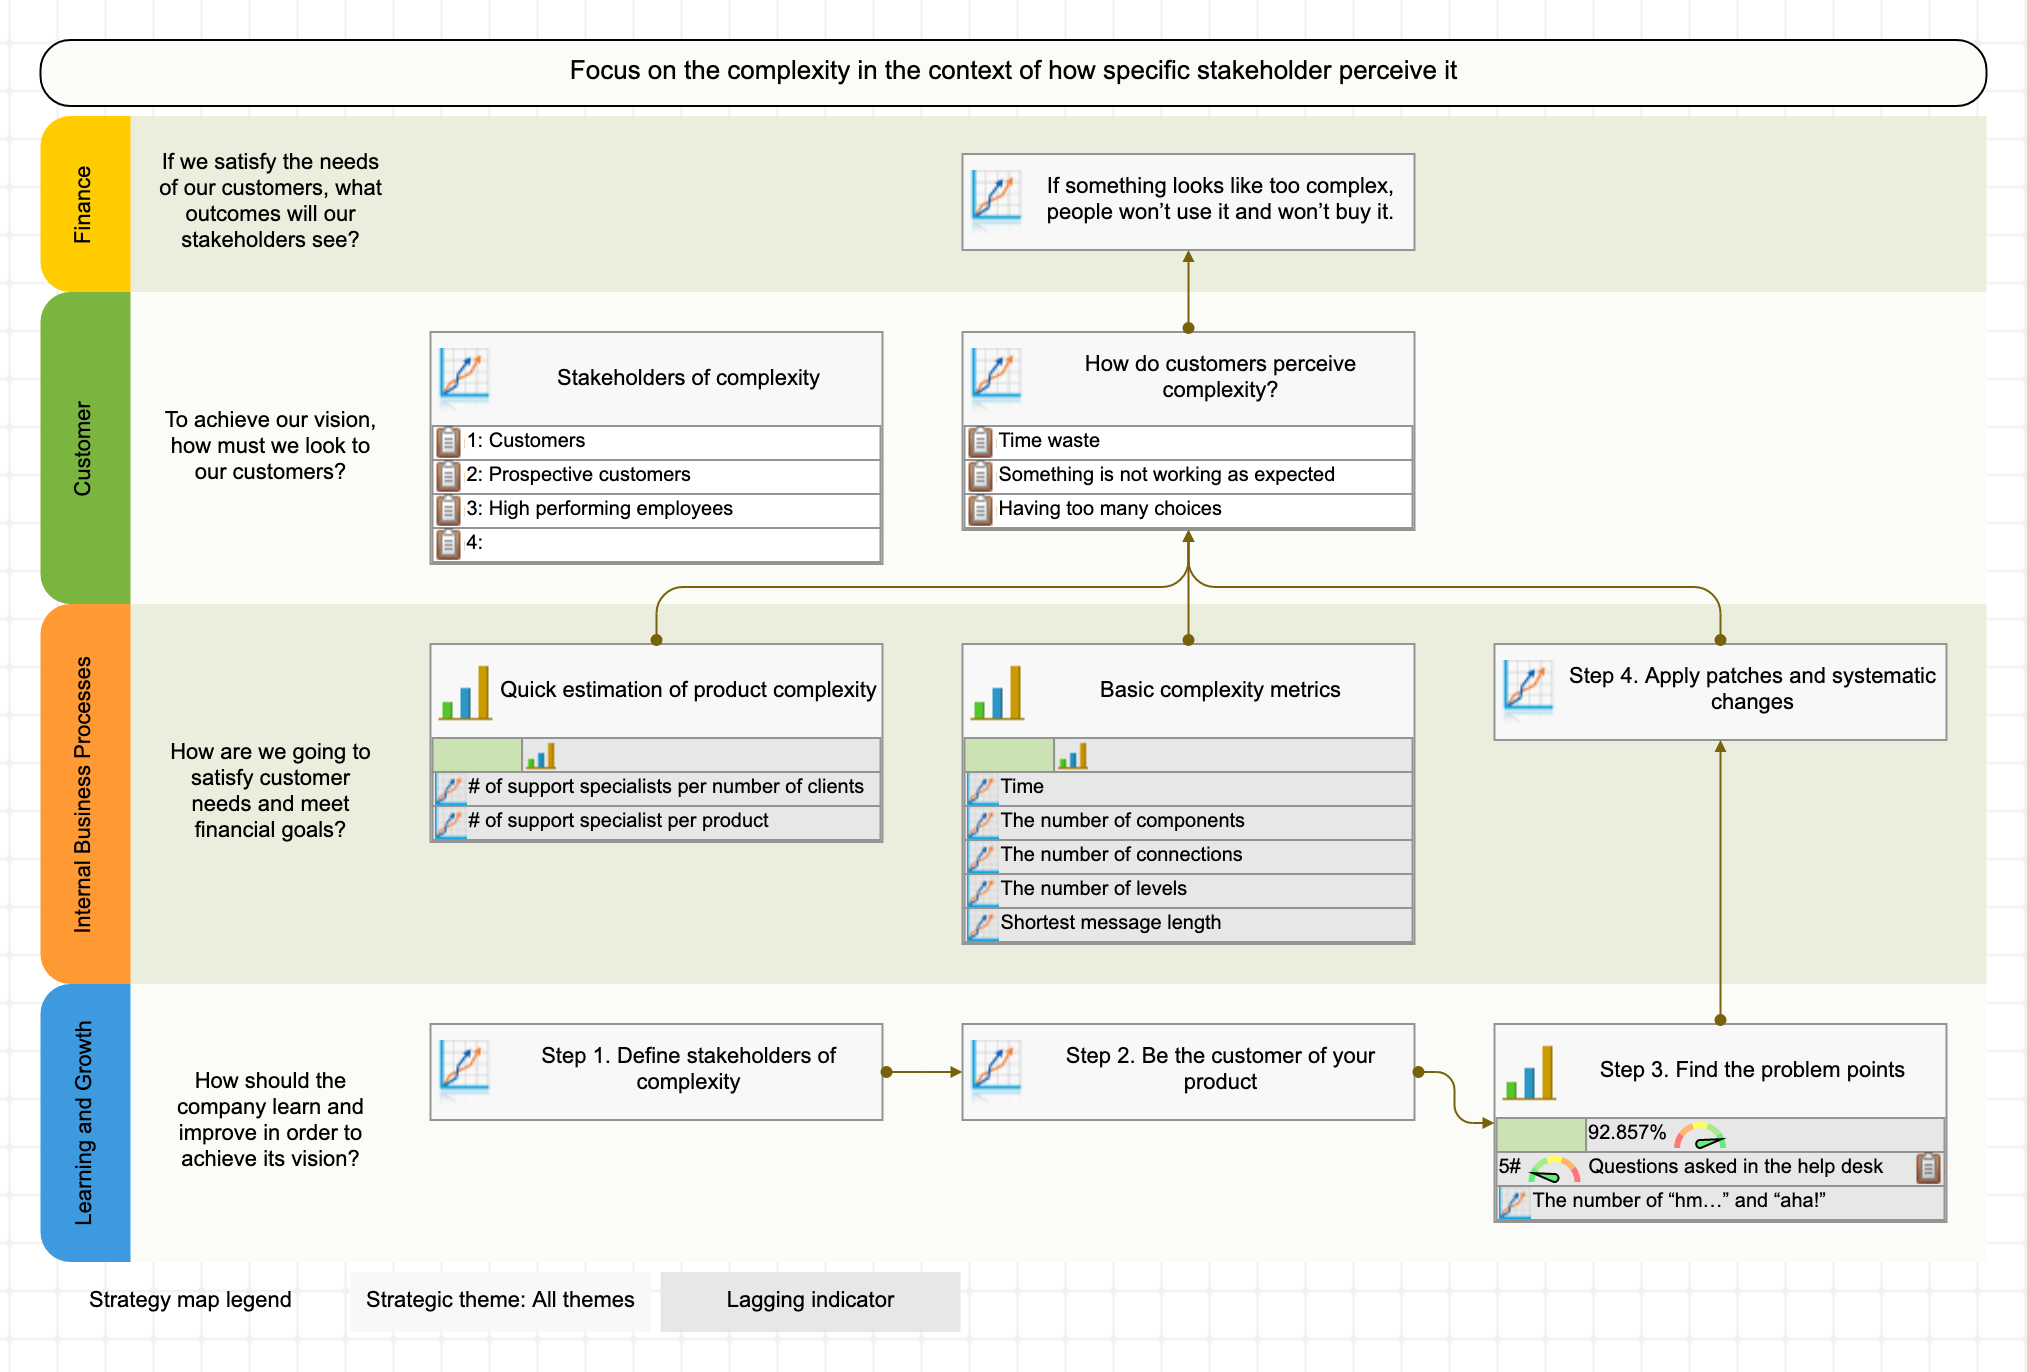
- Focus on the complexity in the context of how specific stakeholders perceive it.
- Be the customer of your product and adjust your radar to detect possible complexity issues (typically, points that slow down stakeholders or make them contact customer support too often).
- If you can say that something is “more complex,” then you can quantify and measure complexity. Do it to support your decisions with data.
- Use basic complexity metrics; interview/observe your stakeholders to find more specific indicators.
Any feedback and follow-up questions are welcome in the comment box below.
What's next?- Follow our
 Strategy Implementation System to align stakeholders, strategic ambitions, and business frameworks into a comprehensive strategy.
 - Automate strategic planning with BSC Designer by organizing goals, initiatives, risks, and KPIs into scorecards.
More About Strategic Planning


- What is Complexity? Murray Gell-Mann, 1995, John Wiley & Sons, Inc. ↩
- What is complexity? F. Heylighen, 1996, Principia Cybernetica Web ↩
- 8 Ways to Get More Insights from Customer Surveys, Aleksey Savkin, 2017, BSC Designer ↩
![]() CEO | Author | Speaker
CEO | Author | Speaker
BSC Designer is strategy execution software that enhances strategy formulation and execution through tangible KPIs. Our proprietary strategy implementation system reflects our practical experience in the strategy domain.