Below is the version history for the BSC Designer.
April 2024 updates:
Some major improvements have been introduced to the reports:
- Each report profile is now composed of fragments, with each fragment being individually configurable.
- Fragments can now be configured to display charts (Time and Gauge).
- A fragment can present a view of indicators aggregated in a table or display each indicator individually.
- Fragments can be combined, allowing for one fragment to display general properties of an indicator, another its update status, another its data, and another its charts.
- Any set of fields can be configured for a fragment, including all properties of a goal, KPI, initiatives, as well as custom properties configured by the user.
March 2024 updates:
- Readiness for AI – a new strategy template added to BSC Designer
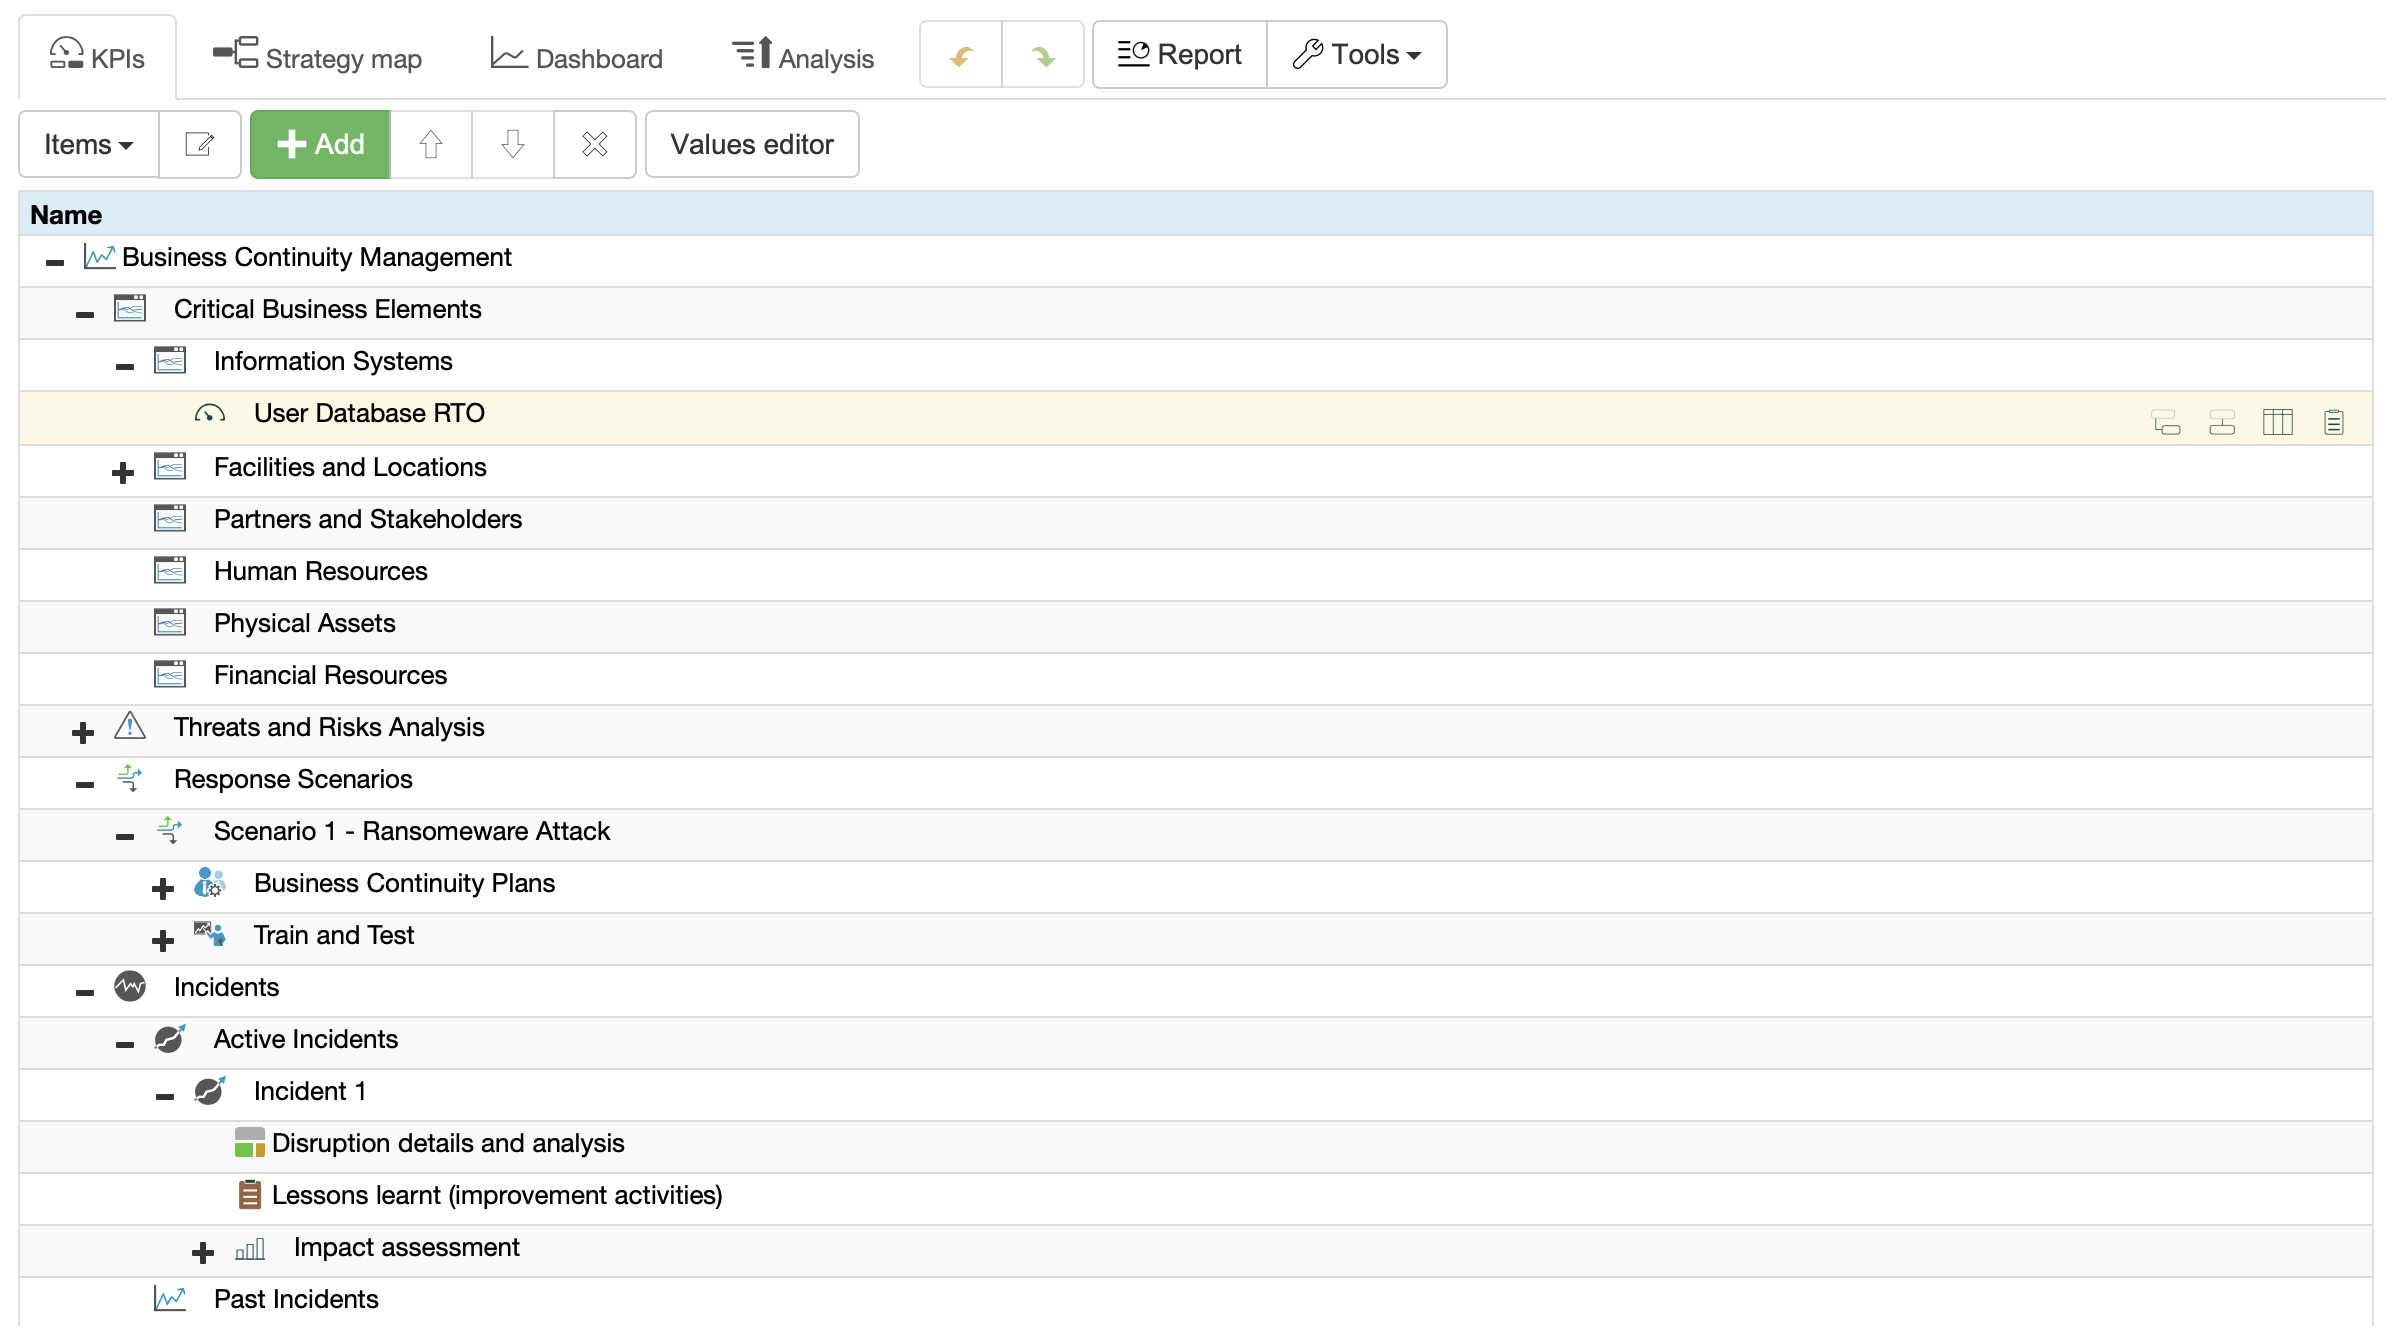
- Business Continuity Management Template added
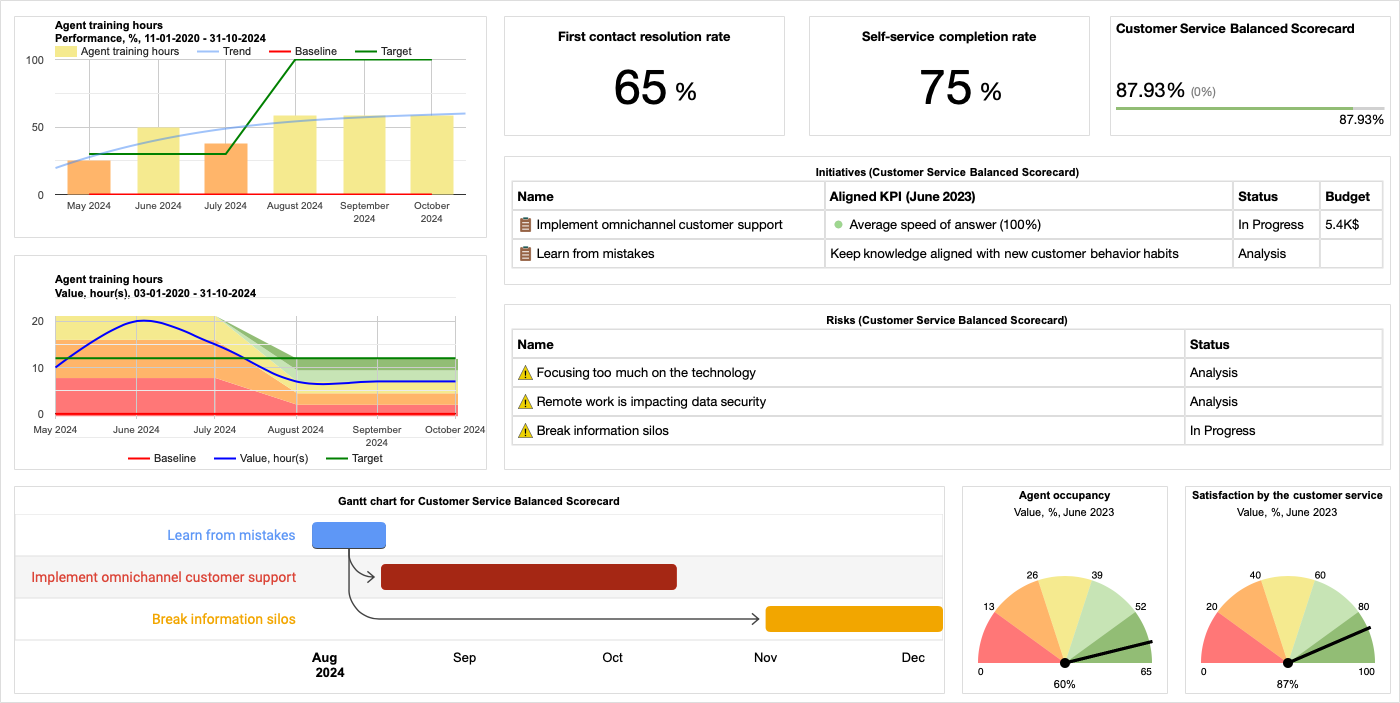
- New diagram ‘Key Metric’ added to show key indicators (refer to the screenshot for ‘First Call Resolution Rate’ and ‘Self-Service Completion Rate’):
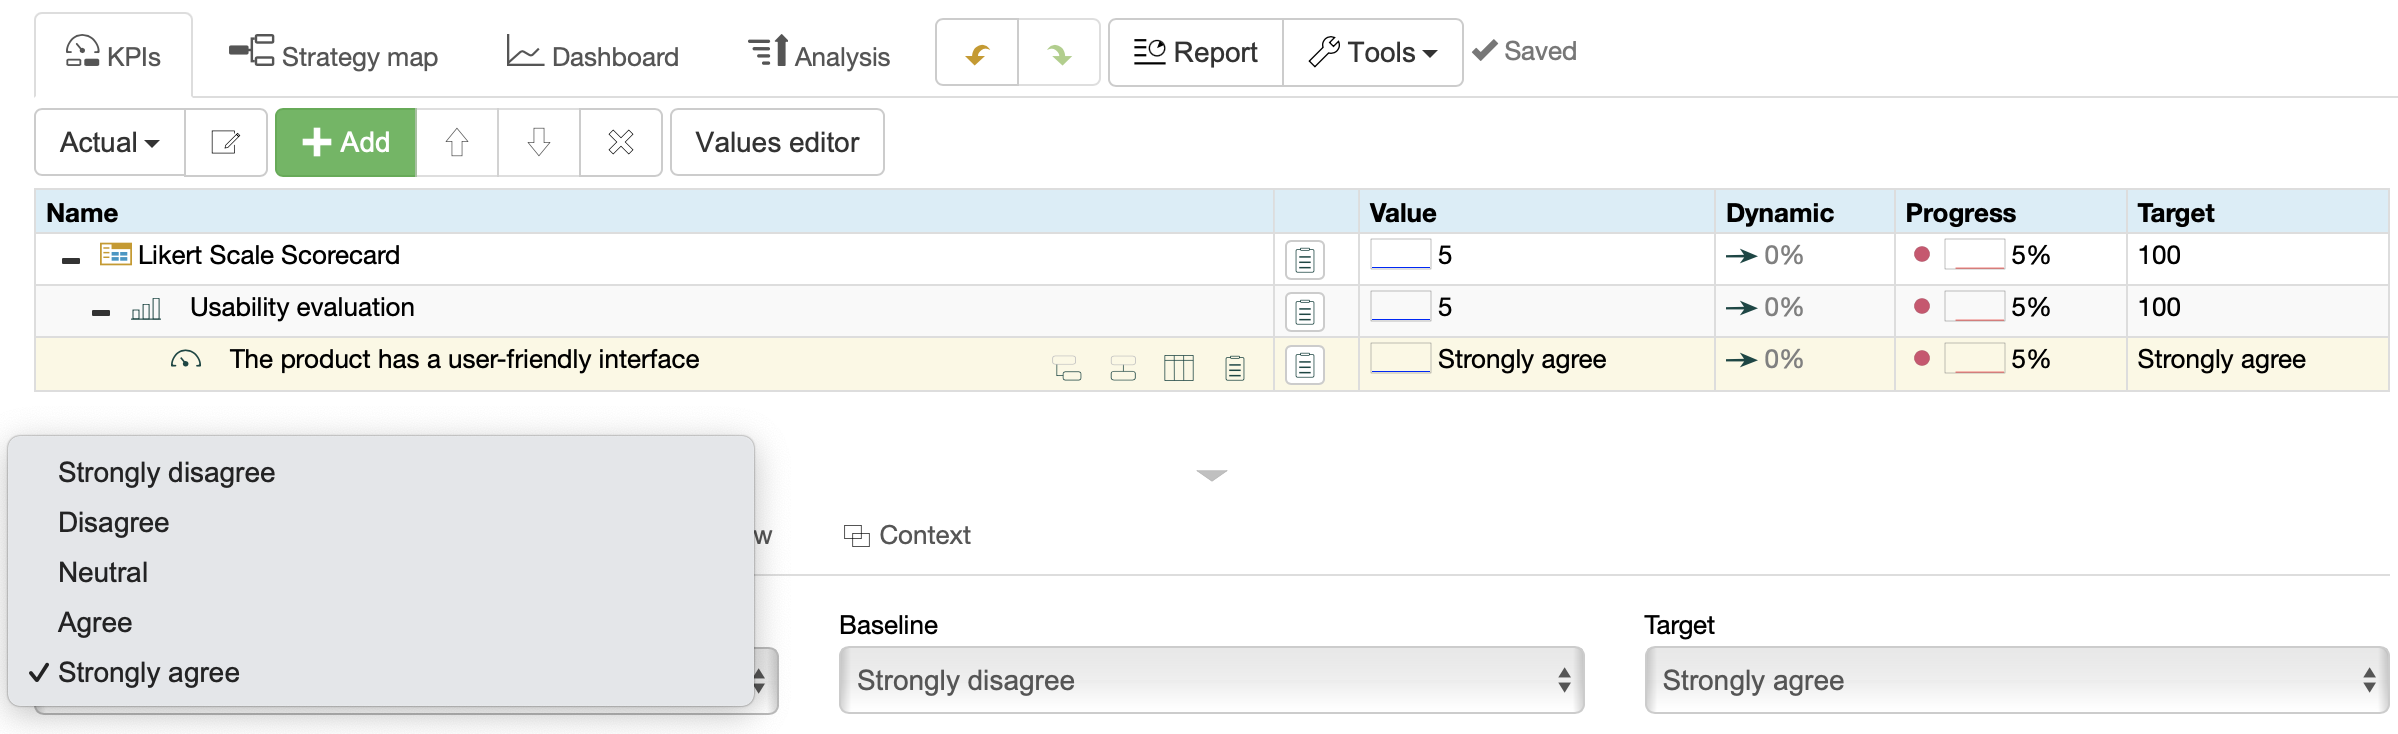
- Guide that explains how to use Likert Scale added
- Growth Loop Canvas – now added to the templates. Use it in conjunction with the classical AARRR funnel model to describe and execute your marketing strategy.
- Added a special export format that generates an Excel/CSV data input template from the existing scorecard (refer to Tools > Export Data).
February 2024 updates:
- An example of the Vendor Risk Management scorecard added to the templates.
- PESTEL analysis template has been updated with 2024 trends.
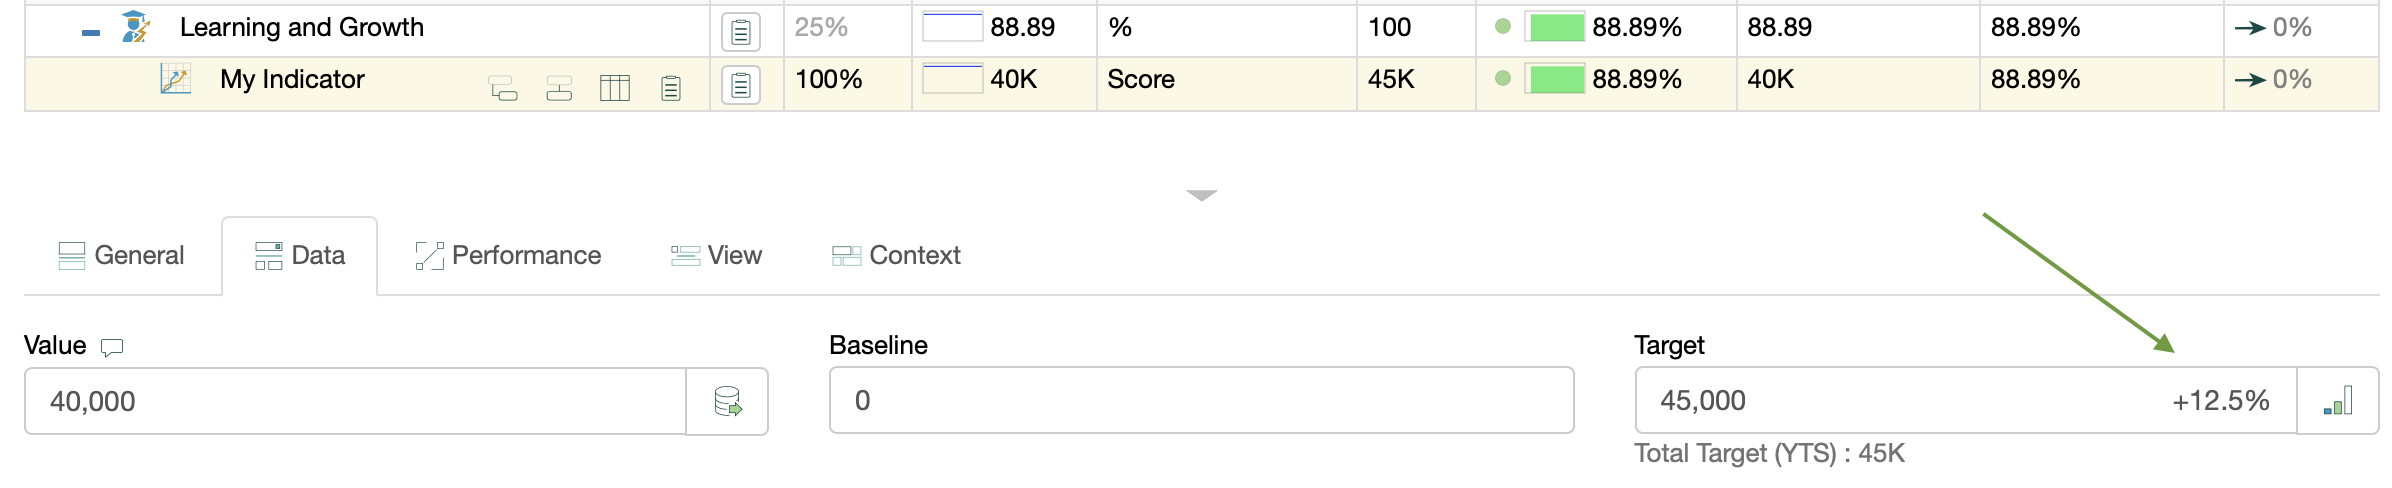
- Specify the target as a percentage of the current state:
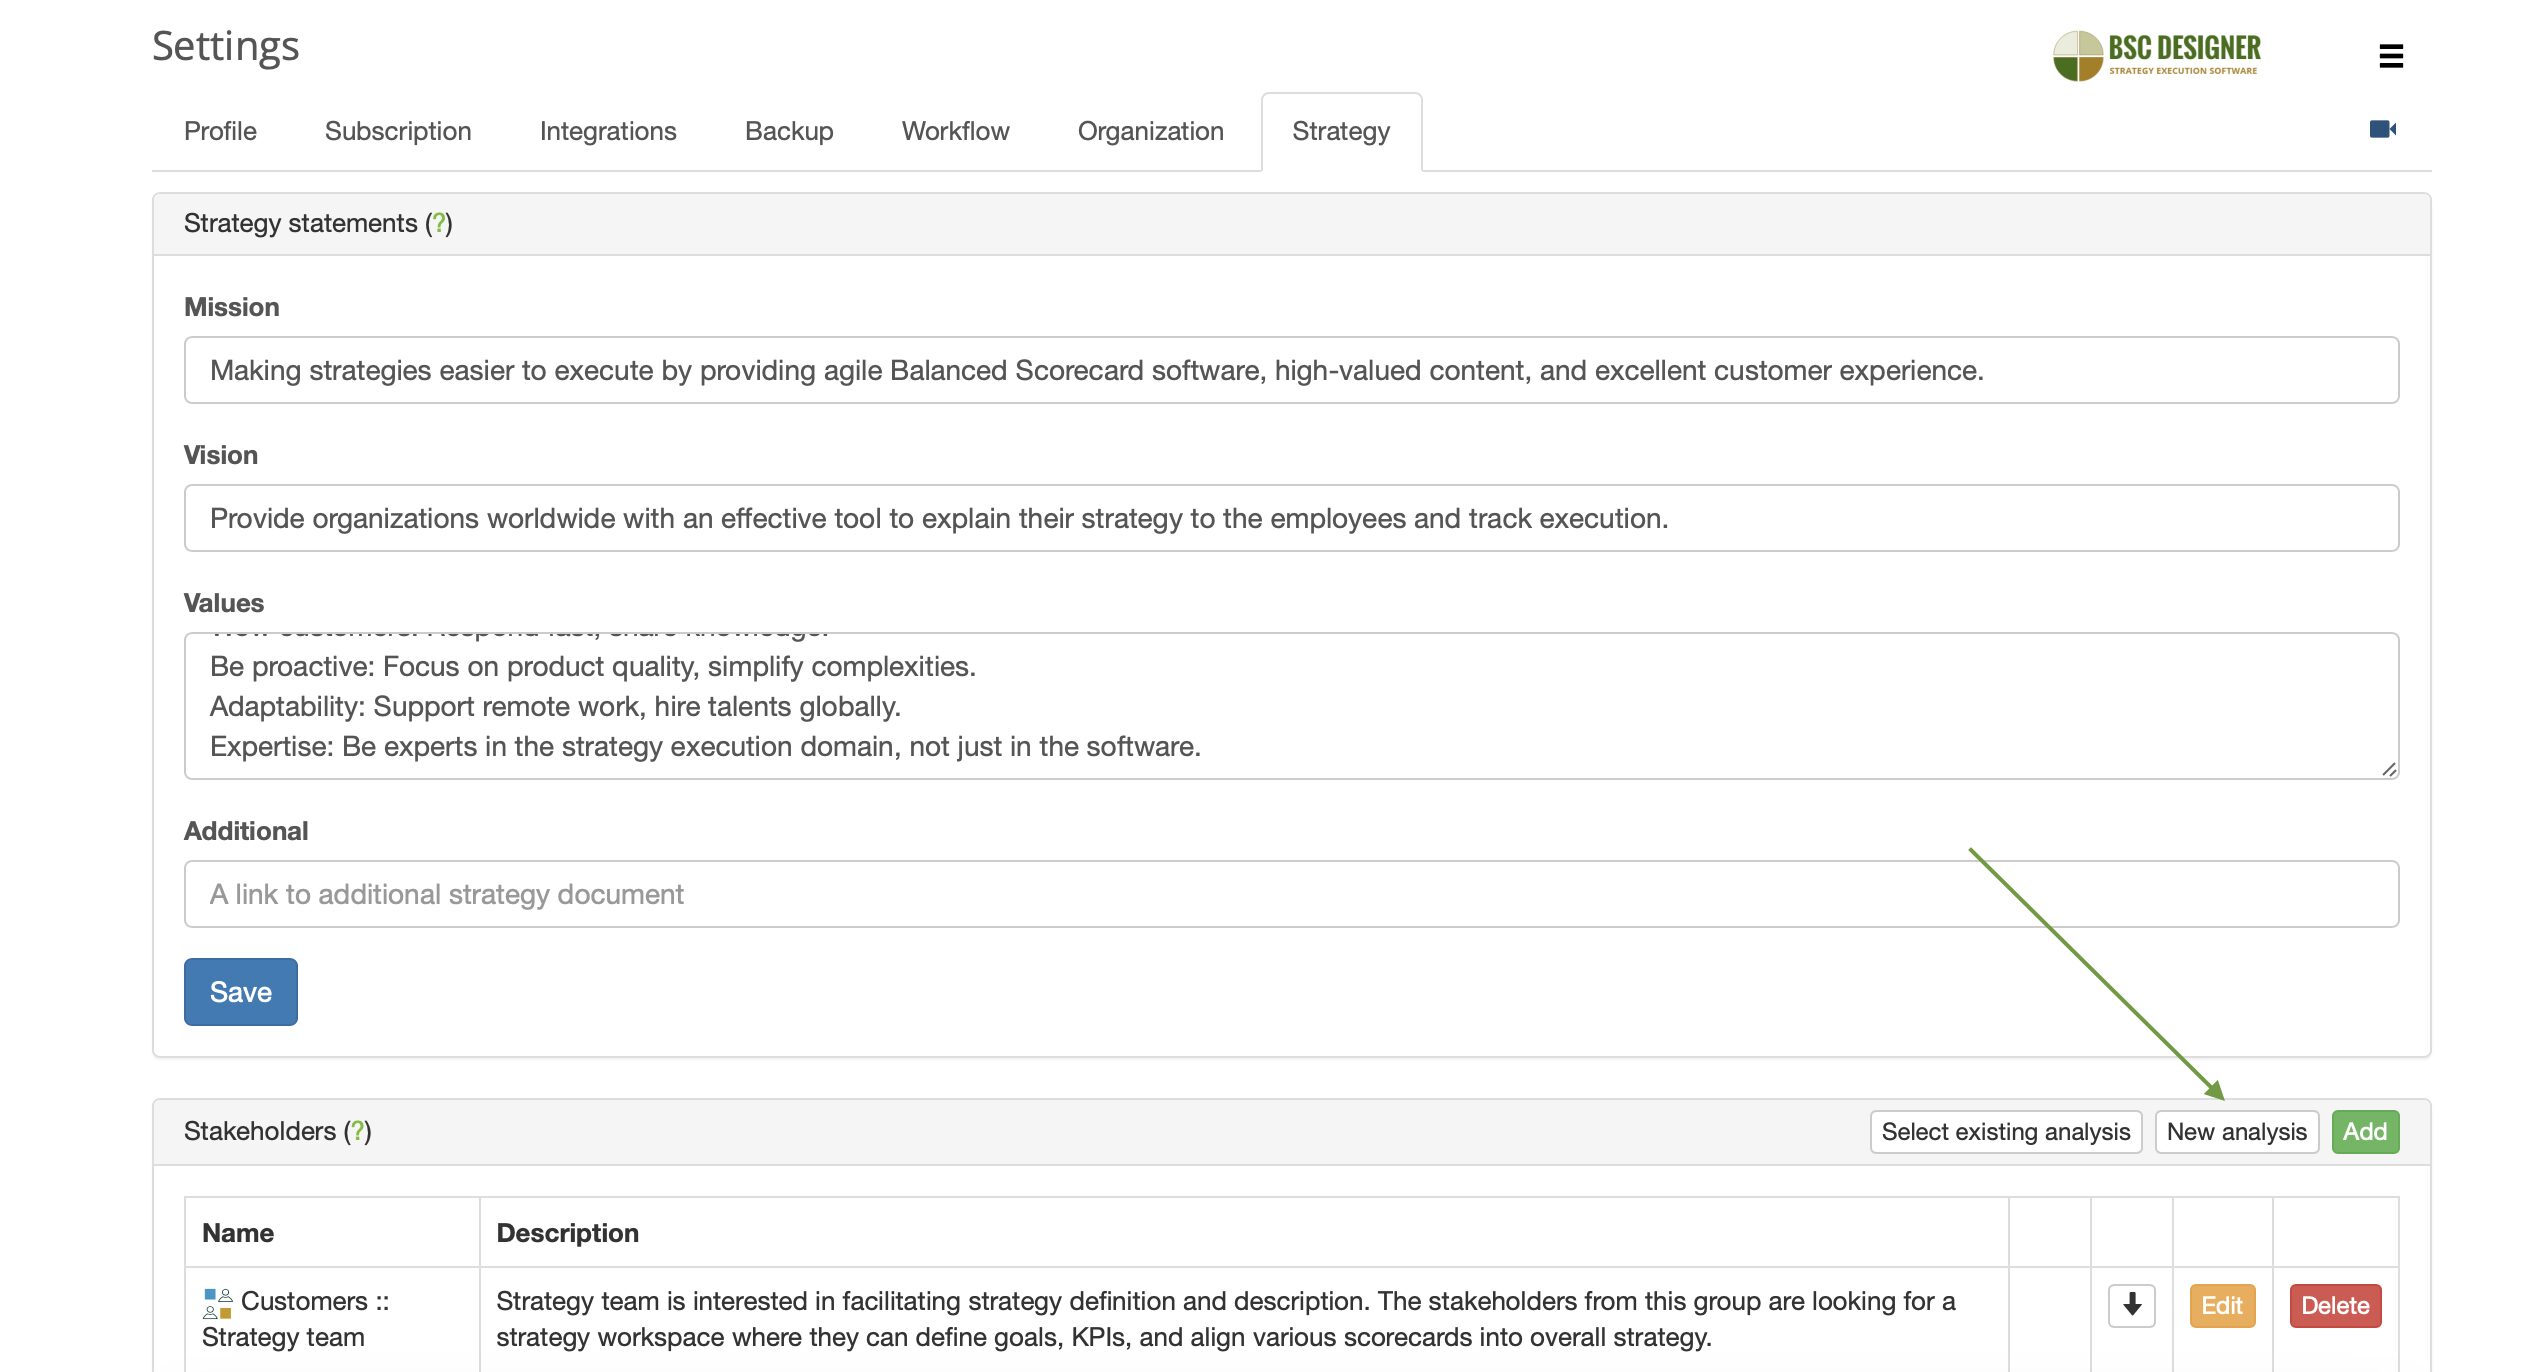
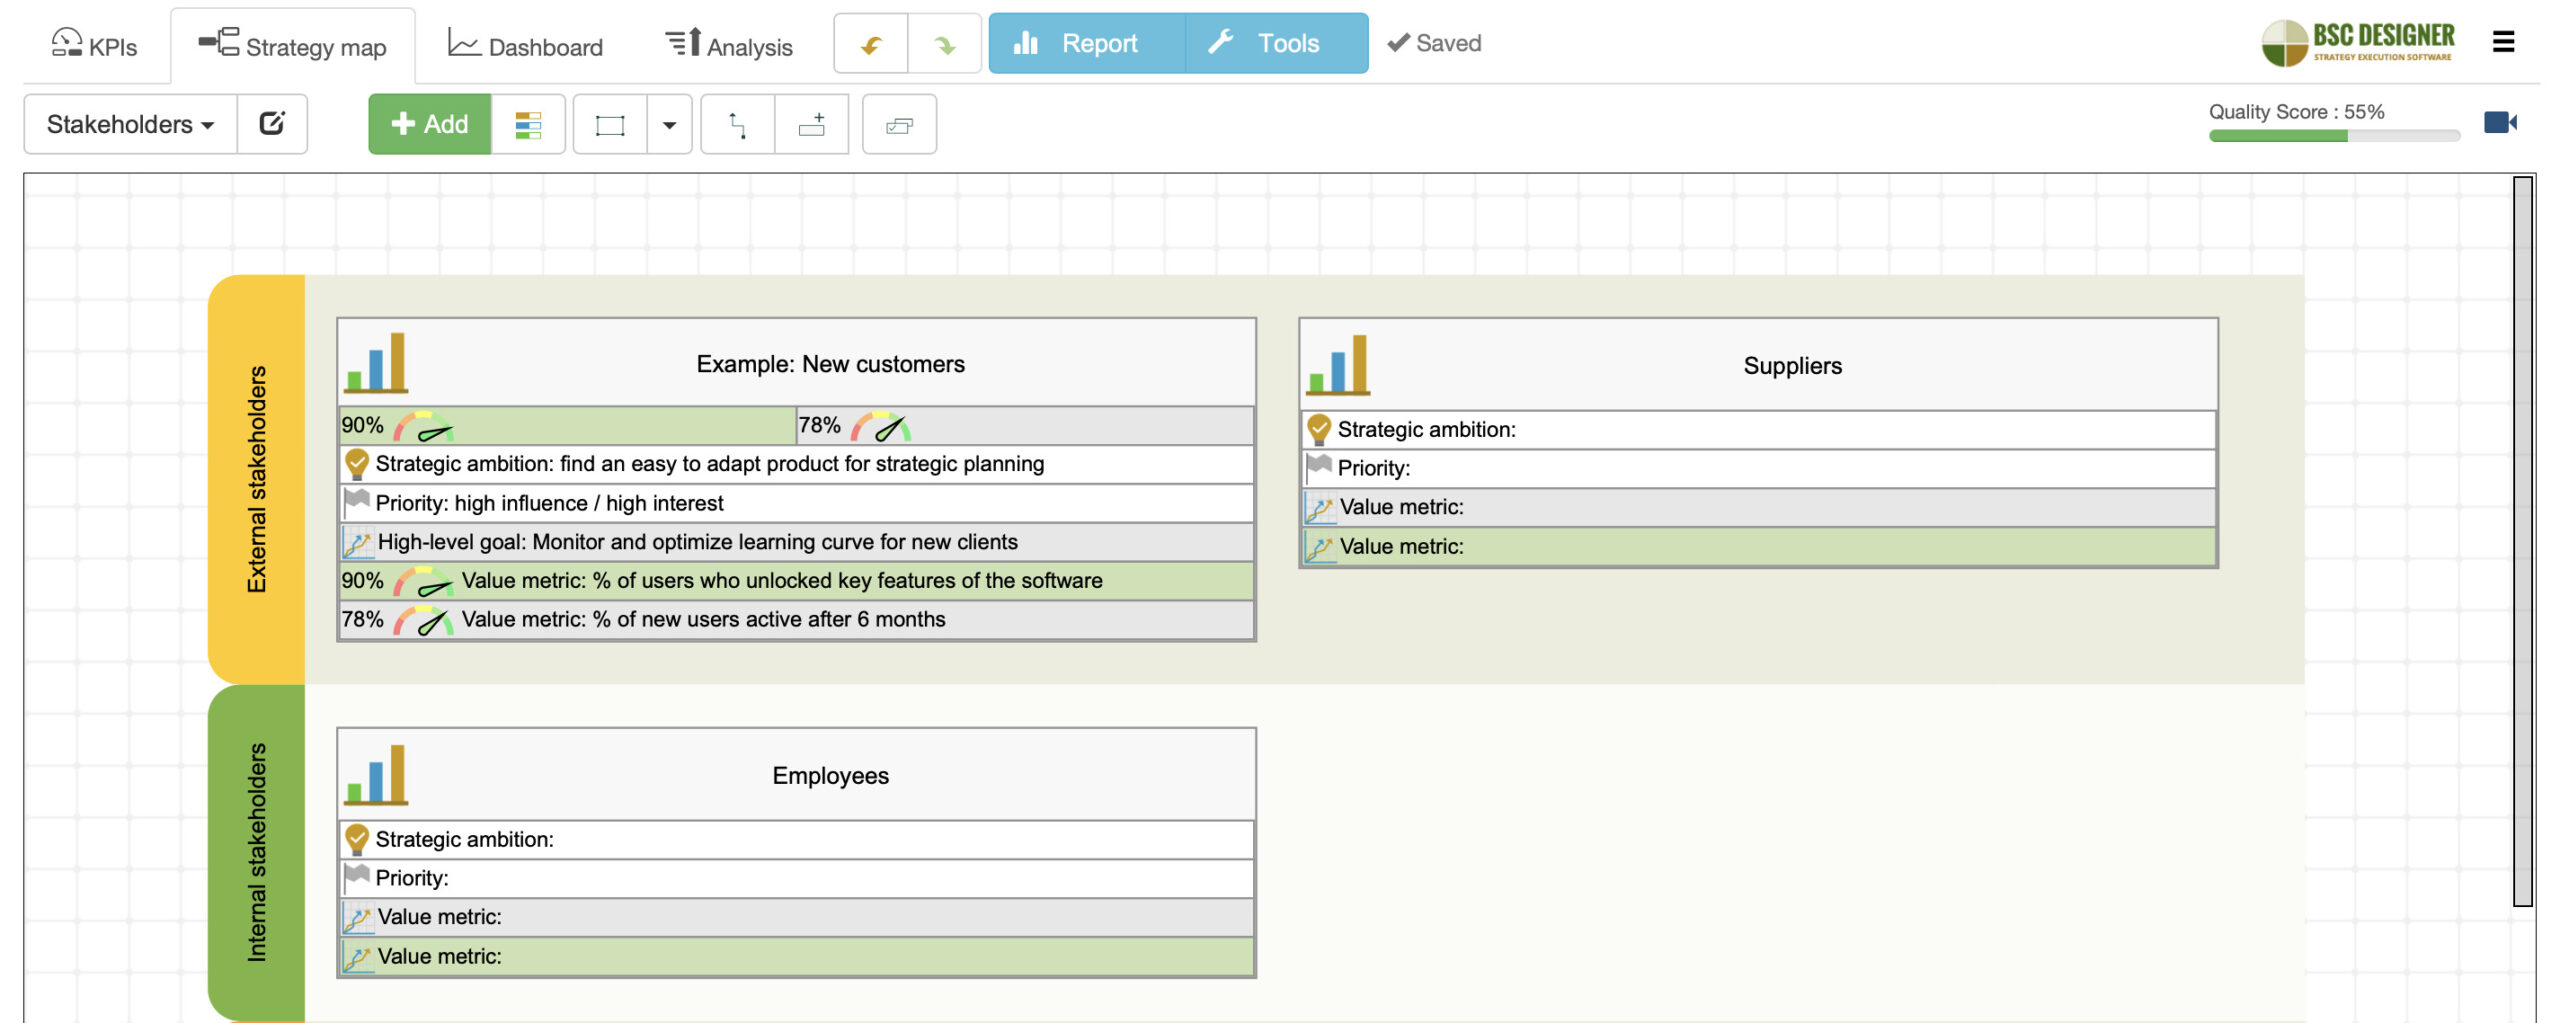
- Synchronisation between the stakeholders analysis template and the stakeholders in Settings > Strategy has been added. Learn how to start stakeholder analysis for your organization.
- Improved the identification of indicators in the formulas. Use [.][indicator] to refer to the indicator within the current item or [..][indicator] to refer to the indicator with the same parent.
- Users can now automatically display all sub-items of the selected item on the Bar or Time chart.
According to our research, Governance Risk and Compliance (GRC) will be one of the key trend for strategic planning in 2024. You can expect more updates from our side to support your organization in this context:
- Compliance template and article released – learn how to quantify compliance efforts in the context of new regulations.
- Risk template added with minimalistic and complex models for risk management.
- A case study that explains the use of BSC Designer to construct evaluation scorecards, along with a template for creating an evaluation scorecard.
January 2024 updates:
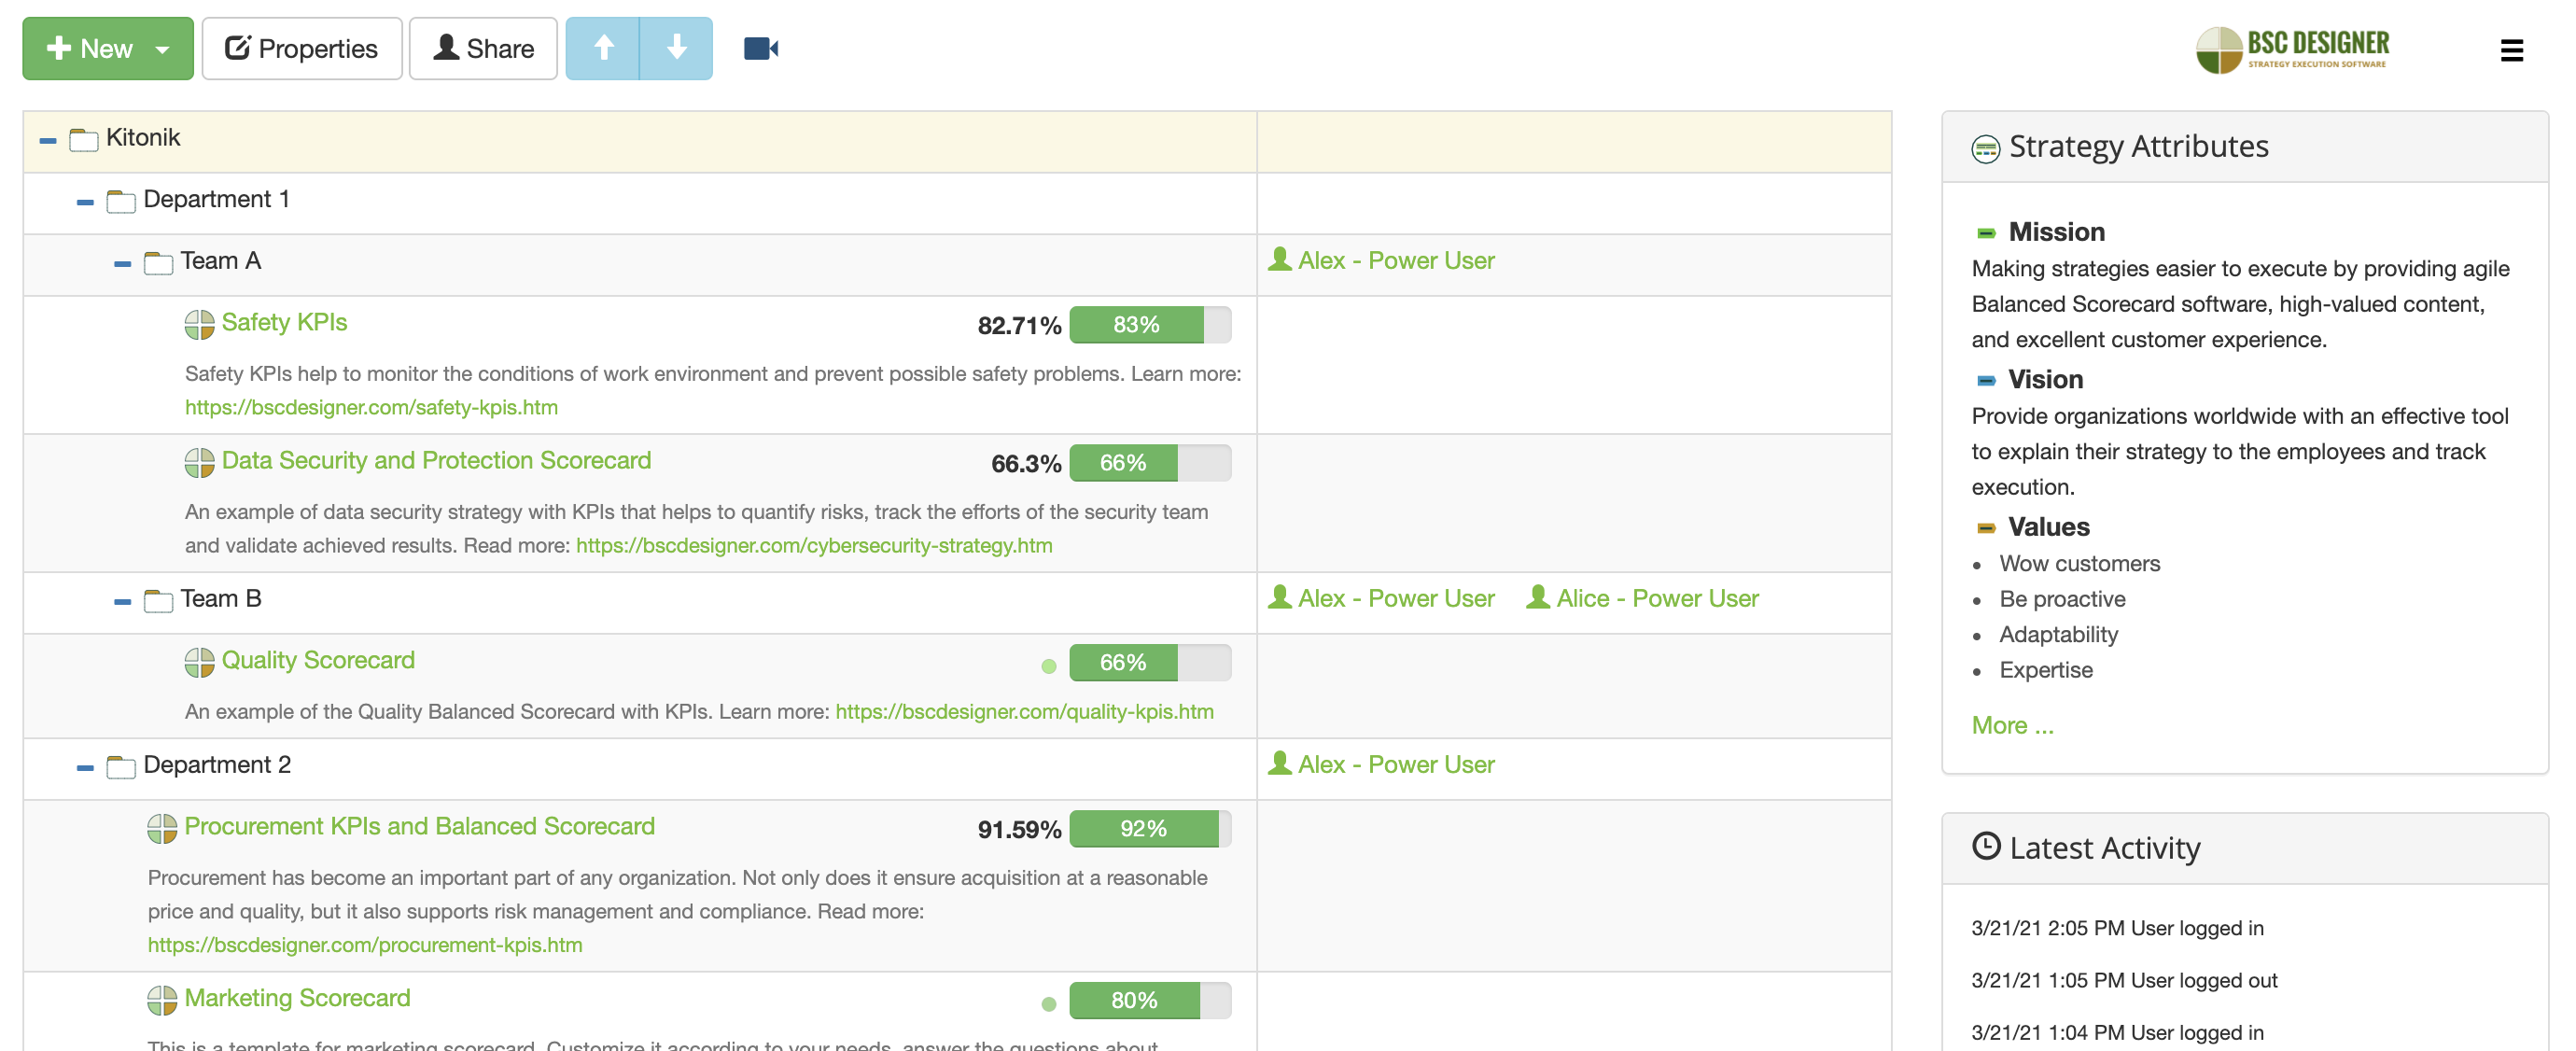
- Global dashboard released. The account administrator can configure a dashboard layout that will be displayed to all users of the account.
- Document storage for initiatives
- The global dashboard is customized based on user roles (a dashboard for data input users only or power users) and screen size.
- Users can perform direct data input via the dashboard by clicking on the Value field and can also directly approve data values through the value field.
- Access rights are determined by ownership. A user assigned as an owner will receive the required access rights automatically.
- The widgets from the My Scorecards section are now accessible on the My Dashboard tab, providing users with more options for configuration.
- Users can now customize the titles of all diagrams.
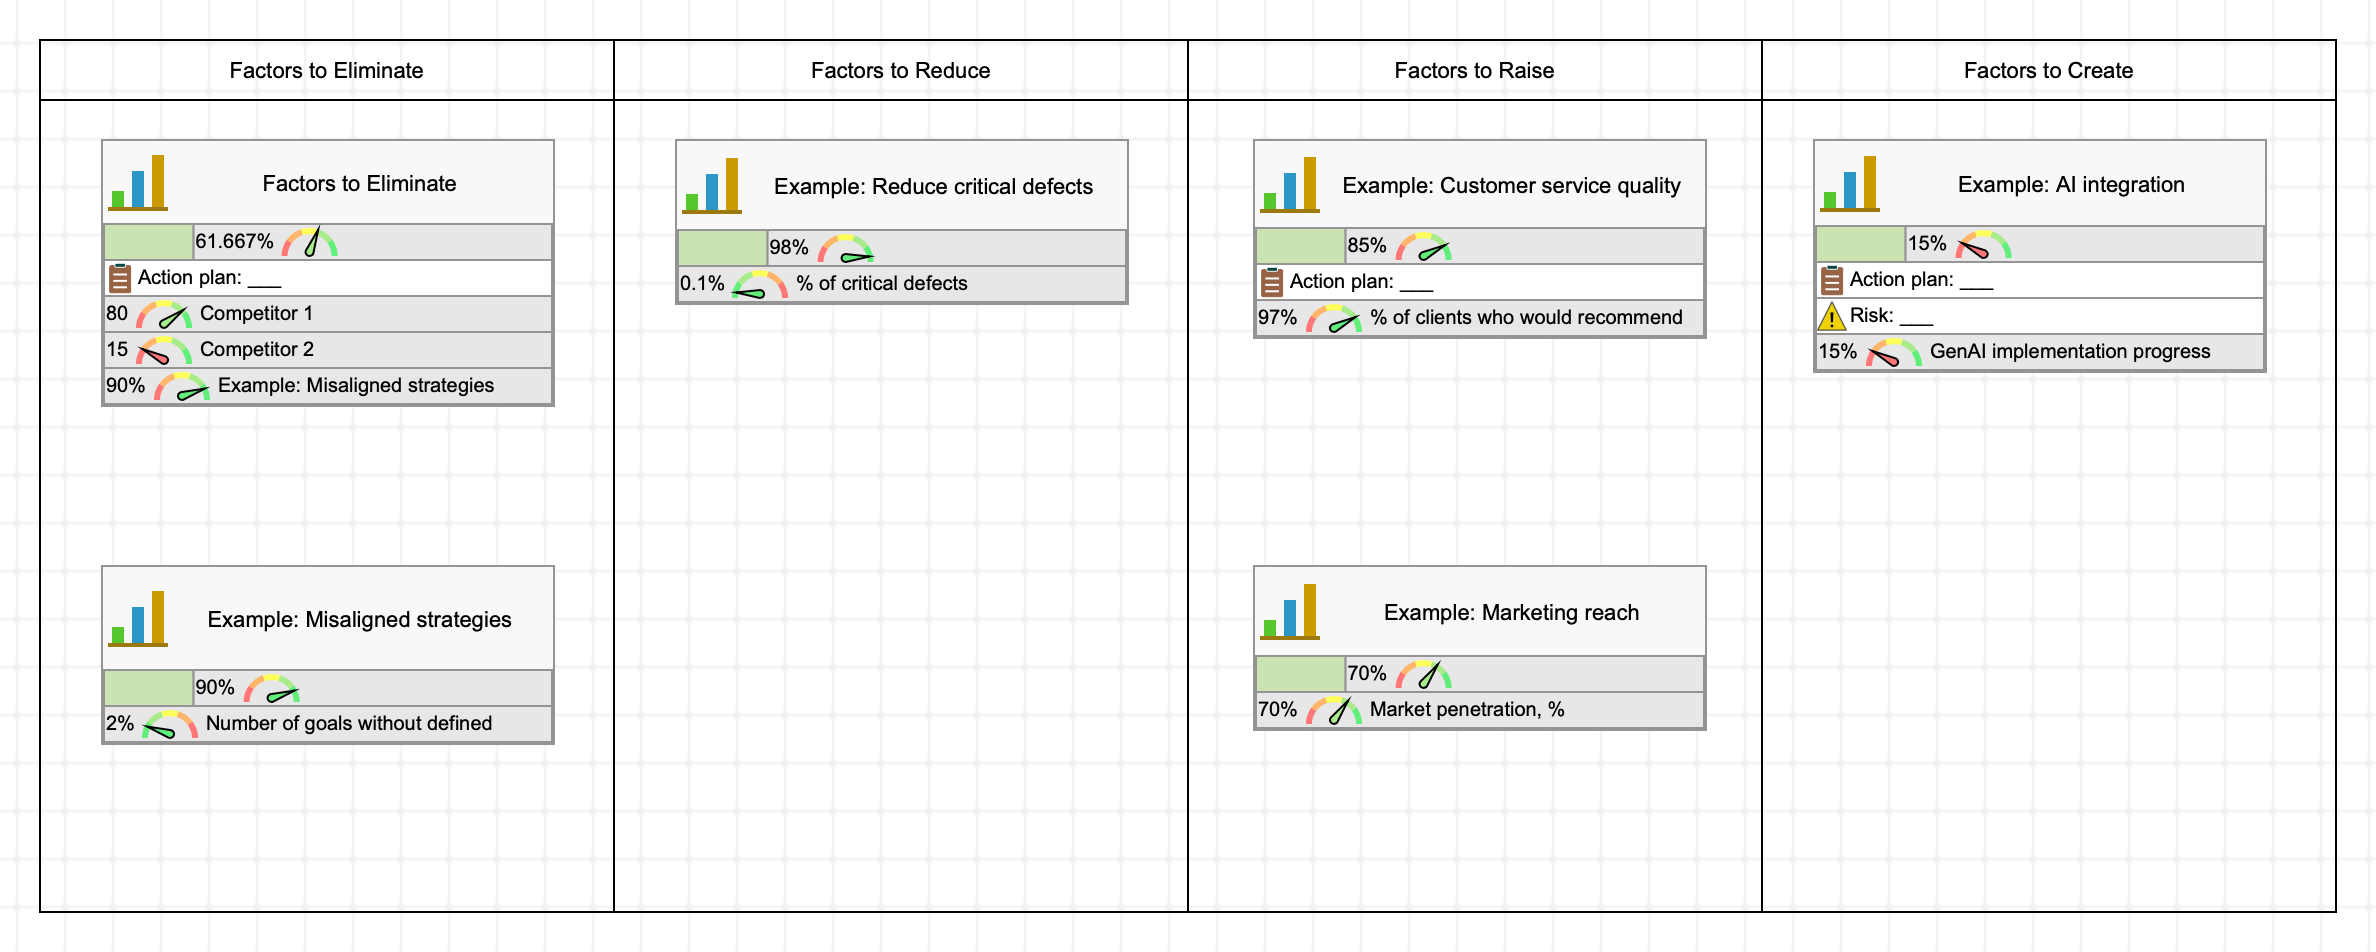
- Blue Ocean Strategy canvas added to the templates.
- A template for a strategy of Venture Capital company added
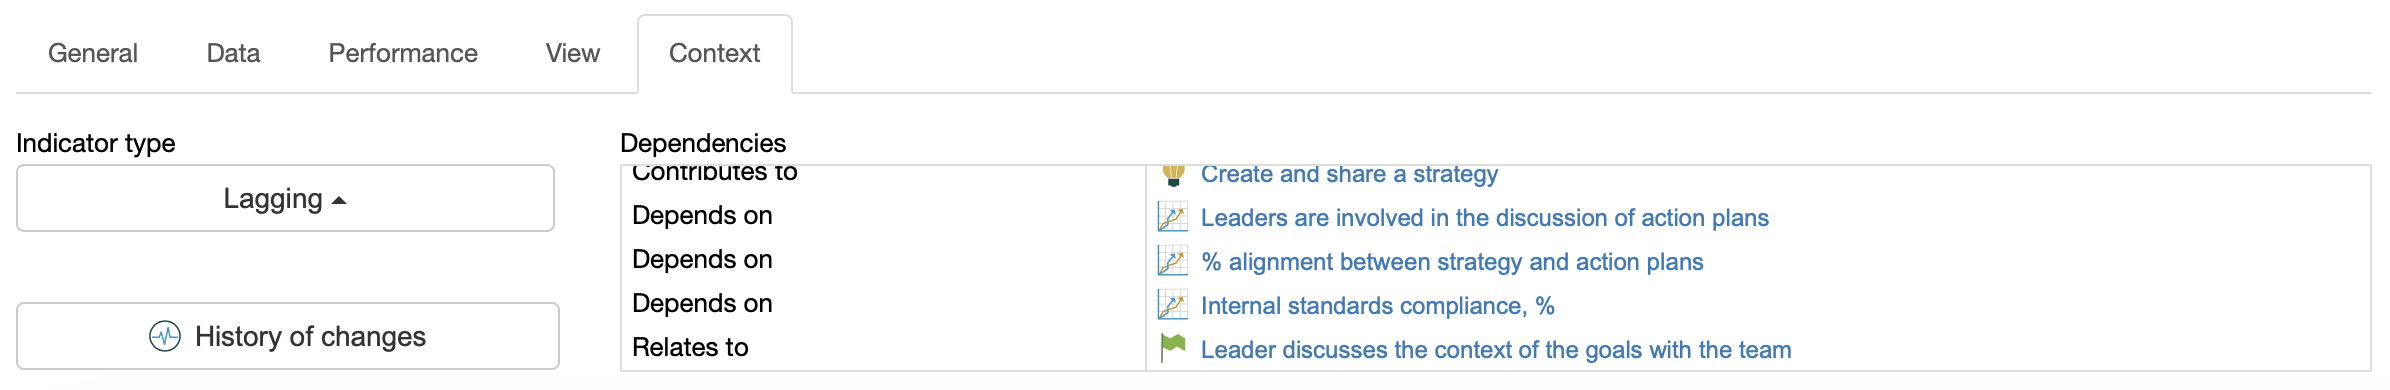
- More options to align scorecard: new option “Link by Context” (see the results on the Context tab) in addition to the old option “Link by Data”
- Settings > Backup now includes the documents stored in the account

December 2023 updates:
- The formulas for KPIs (KPI > Data tab > Data source button > Formula) can now use the targets of other KPIs for calculations. This will make sense when the formula is configured as ‘Apply to value’ or ‘Apply to target.’
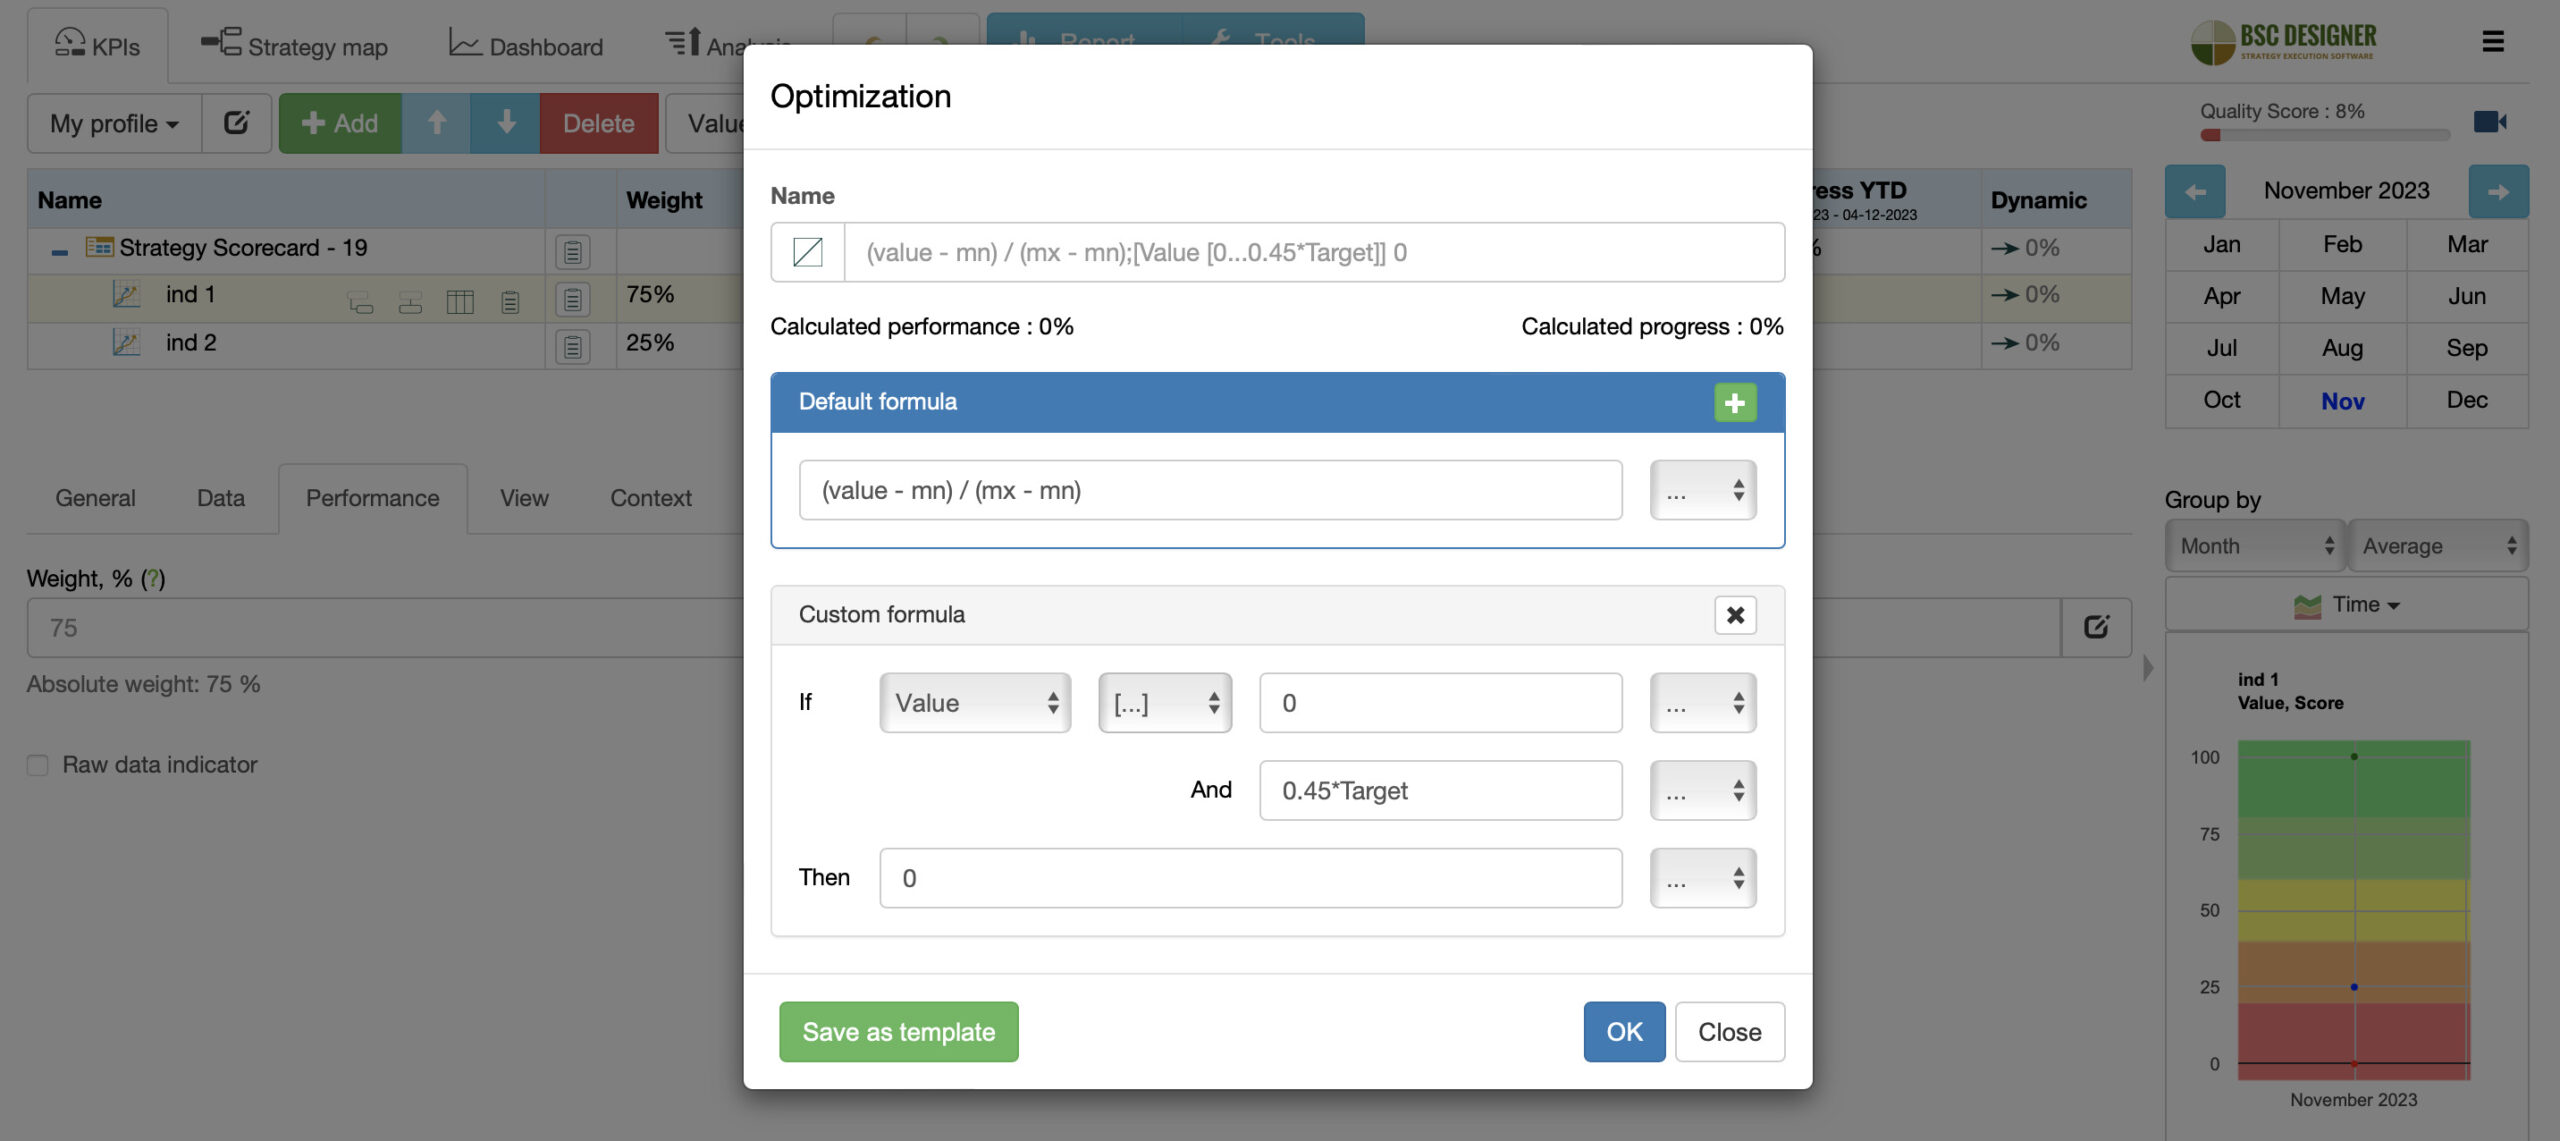
- The Performance Formulas dialog (KPI > Performance tab > Optimisation list > custom formula) has been revised to include BETWEEN logic, as well as to use parameterized thresholds (80% of the target). Now, it is easier to explain logic like: ‘If the value is in the range of 0-45% of the target, set the performance to 0%.’
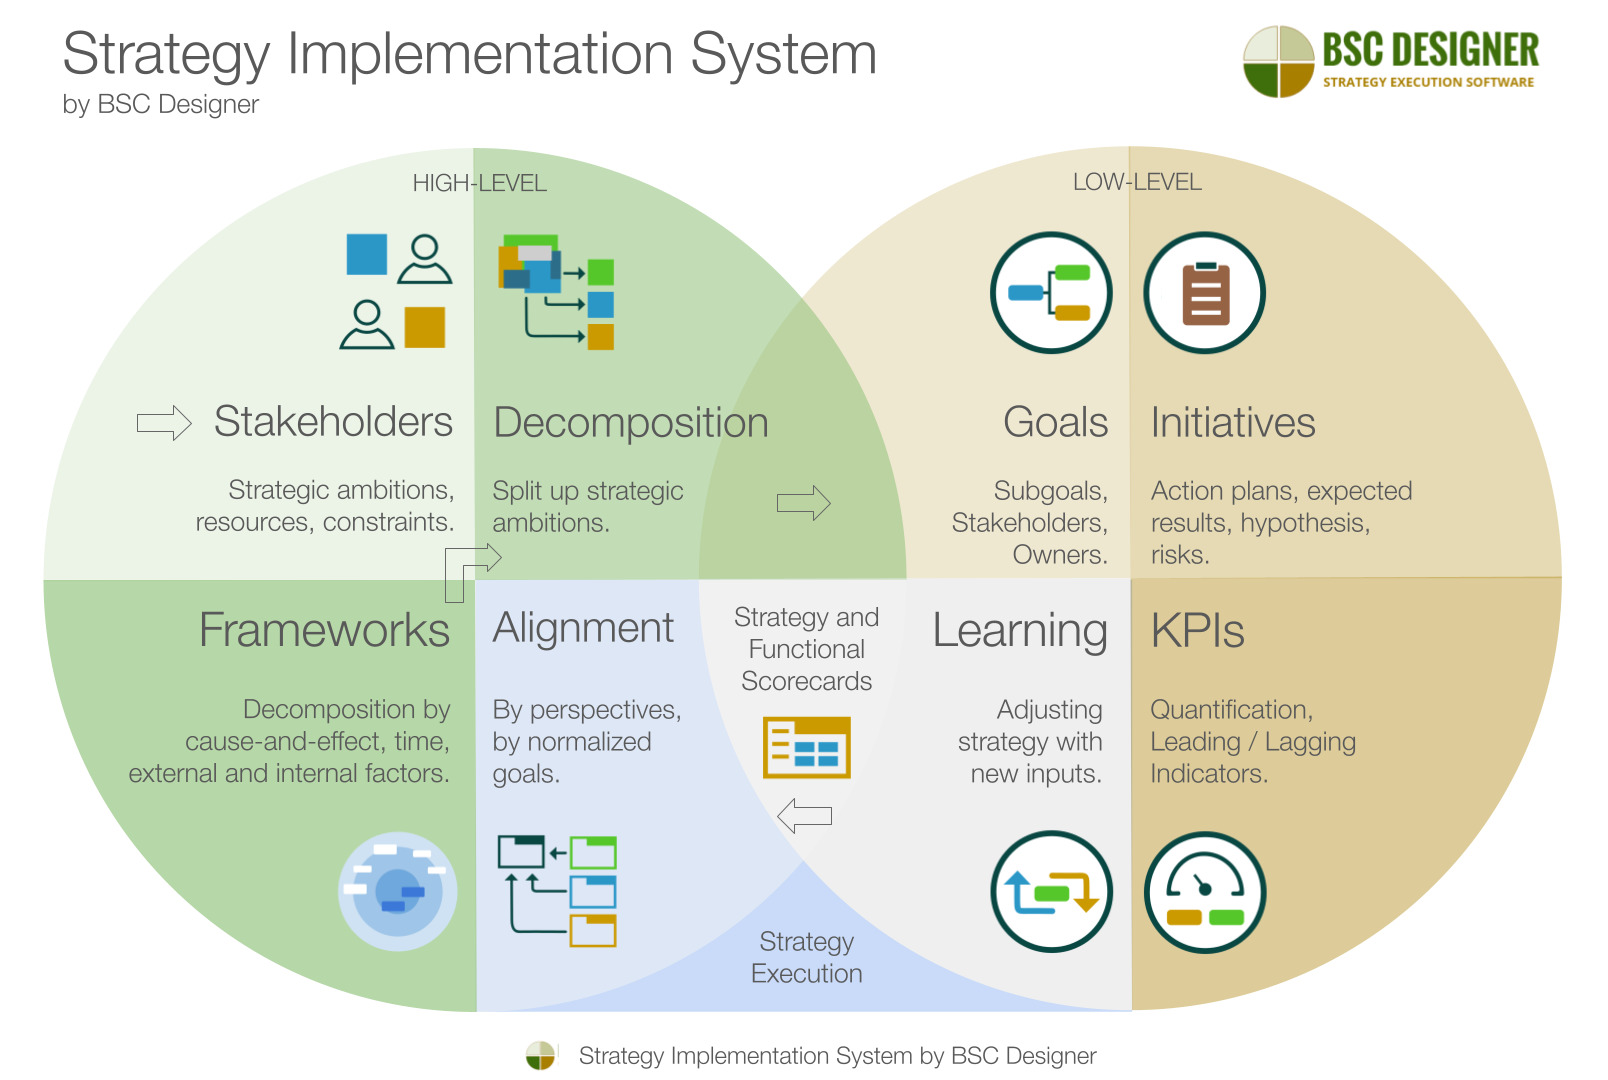
- Strategy Implementation System released.
November 2023 updates:
- Additional layer of security with 2FA (Two Factor Authentication). See Settings > Organization > section “Two-Factor Authentication”.
- A possibility to configure custom templates for scorecards, including template for a new scorecard.
- The dependencies of the goal/indicator/initiative are now visualised on the Context tab
October 2023 updates:
- Using AI to generate strategies in BSC Designer.
- More flexible import from CSV/Excel with support of descriptions for each level of the goal, indicators, and initiatives; support of initiative type.
- Trend line and curve line for time charts.
- Administrator type added to user settings. Any power user can now be assigned as administrator of the account (full access rights to scorecards and account settings).
September 2023 updates:
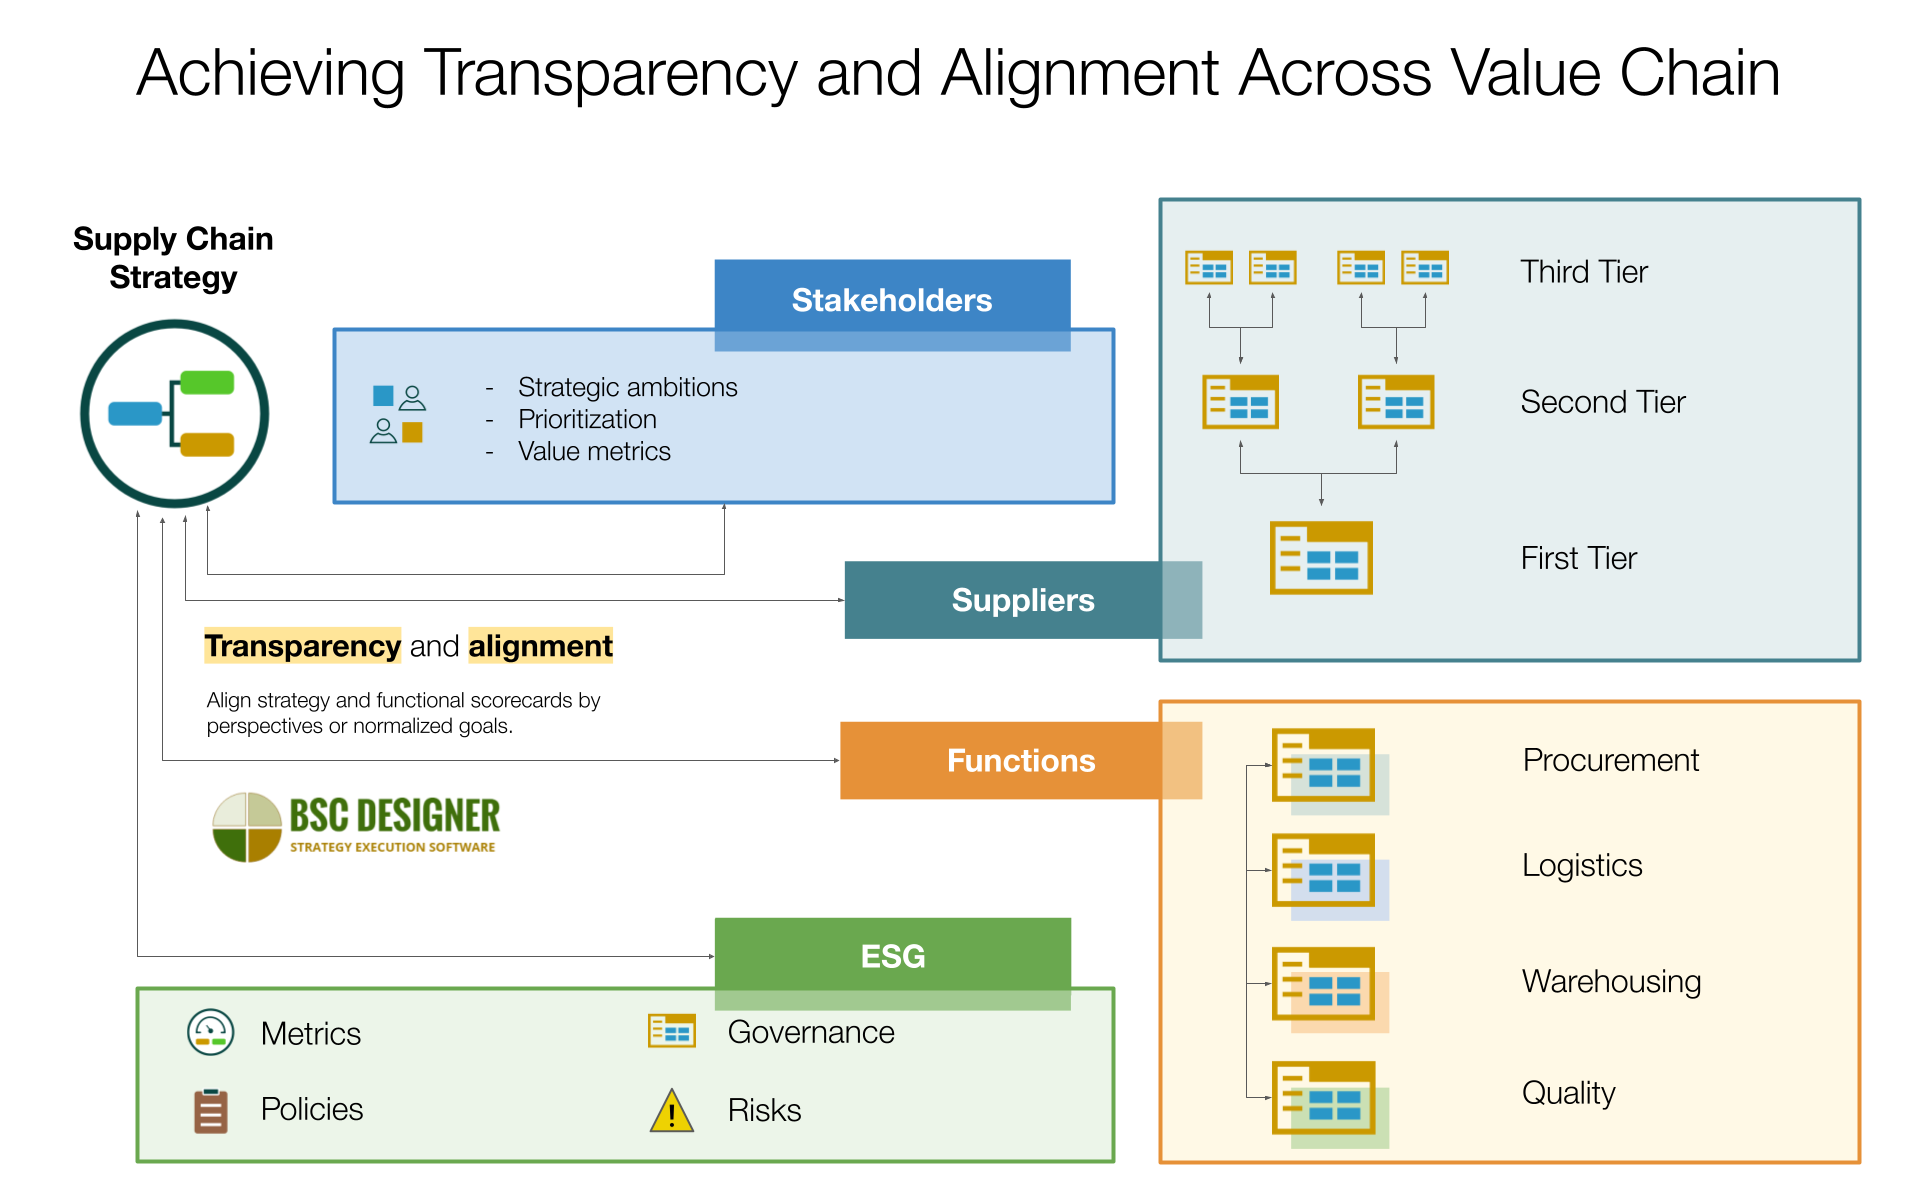
- Supply Chain strategy map template
- Change management framework with KPIs for three phases of change
August 2023 updates:
- Support for dates locale (Settings > Organization > Format > Date format)
- Stakeholder Analysis template added to the templates
July 2023 updates:
- Better formulas for KPIs – can now be applied to value field only or to the target field only
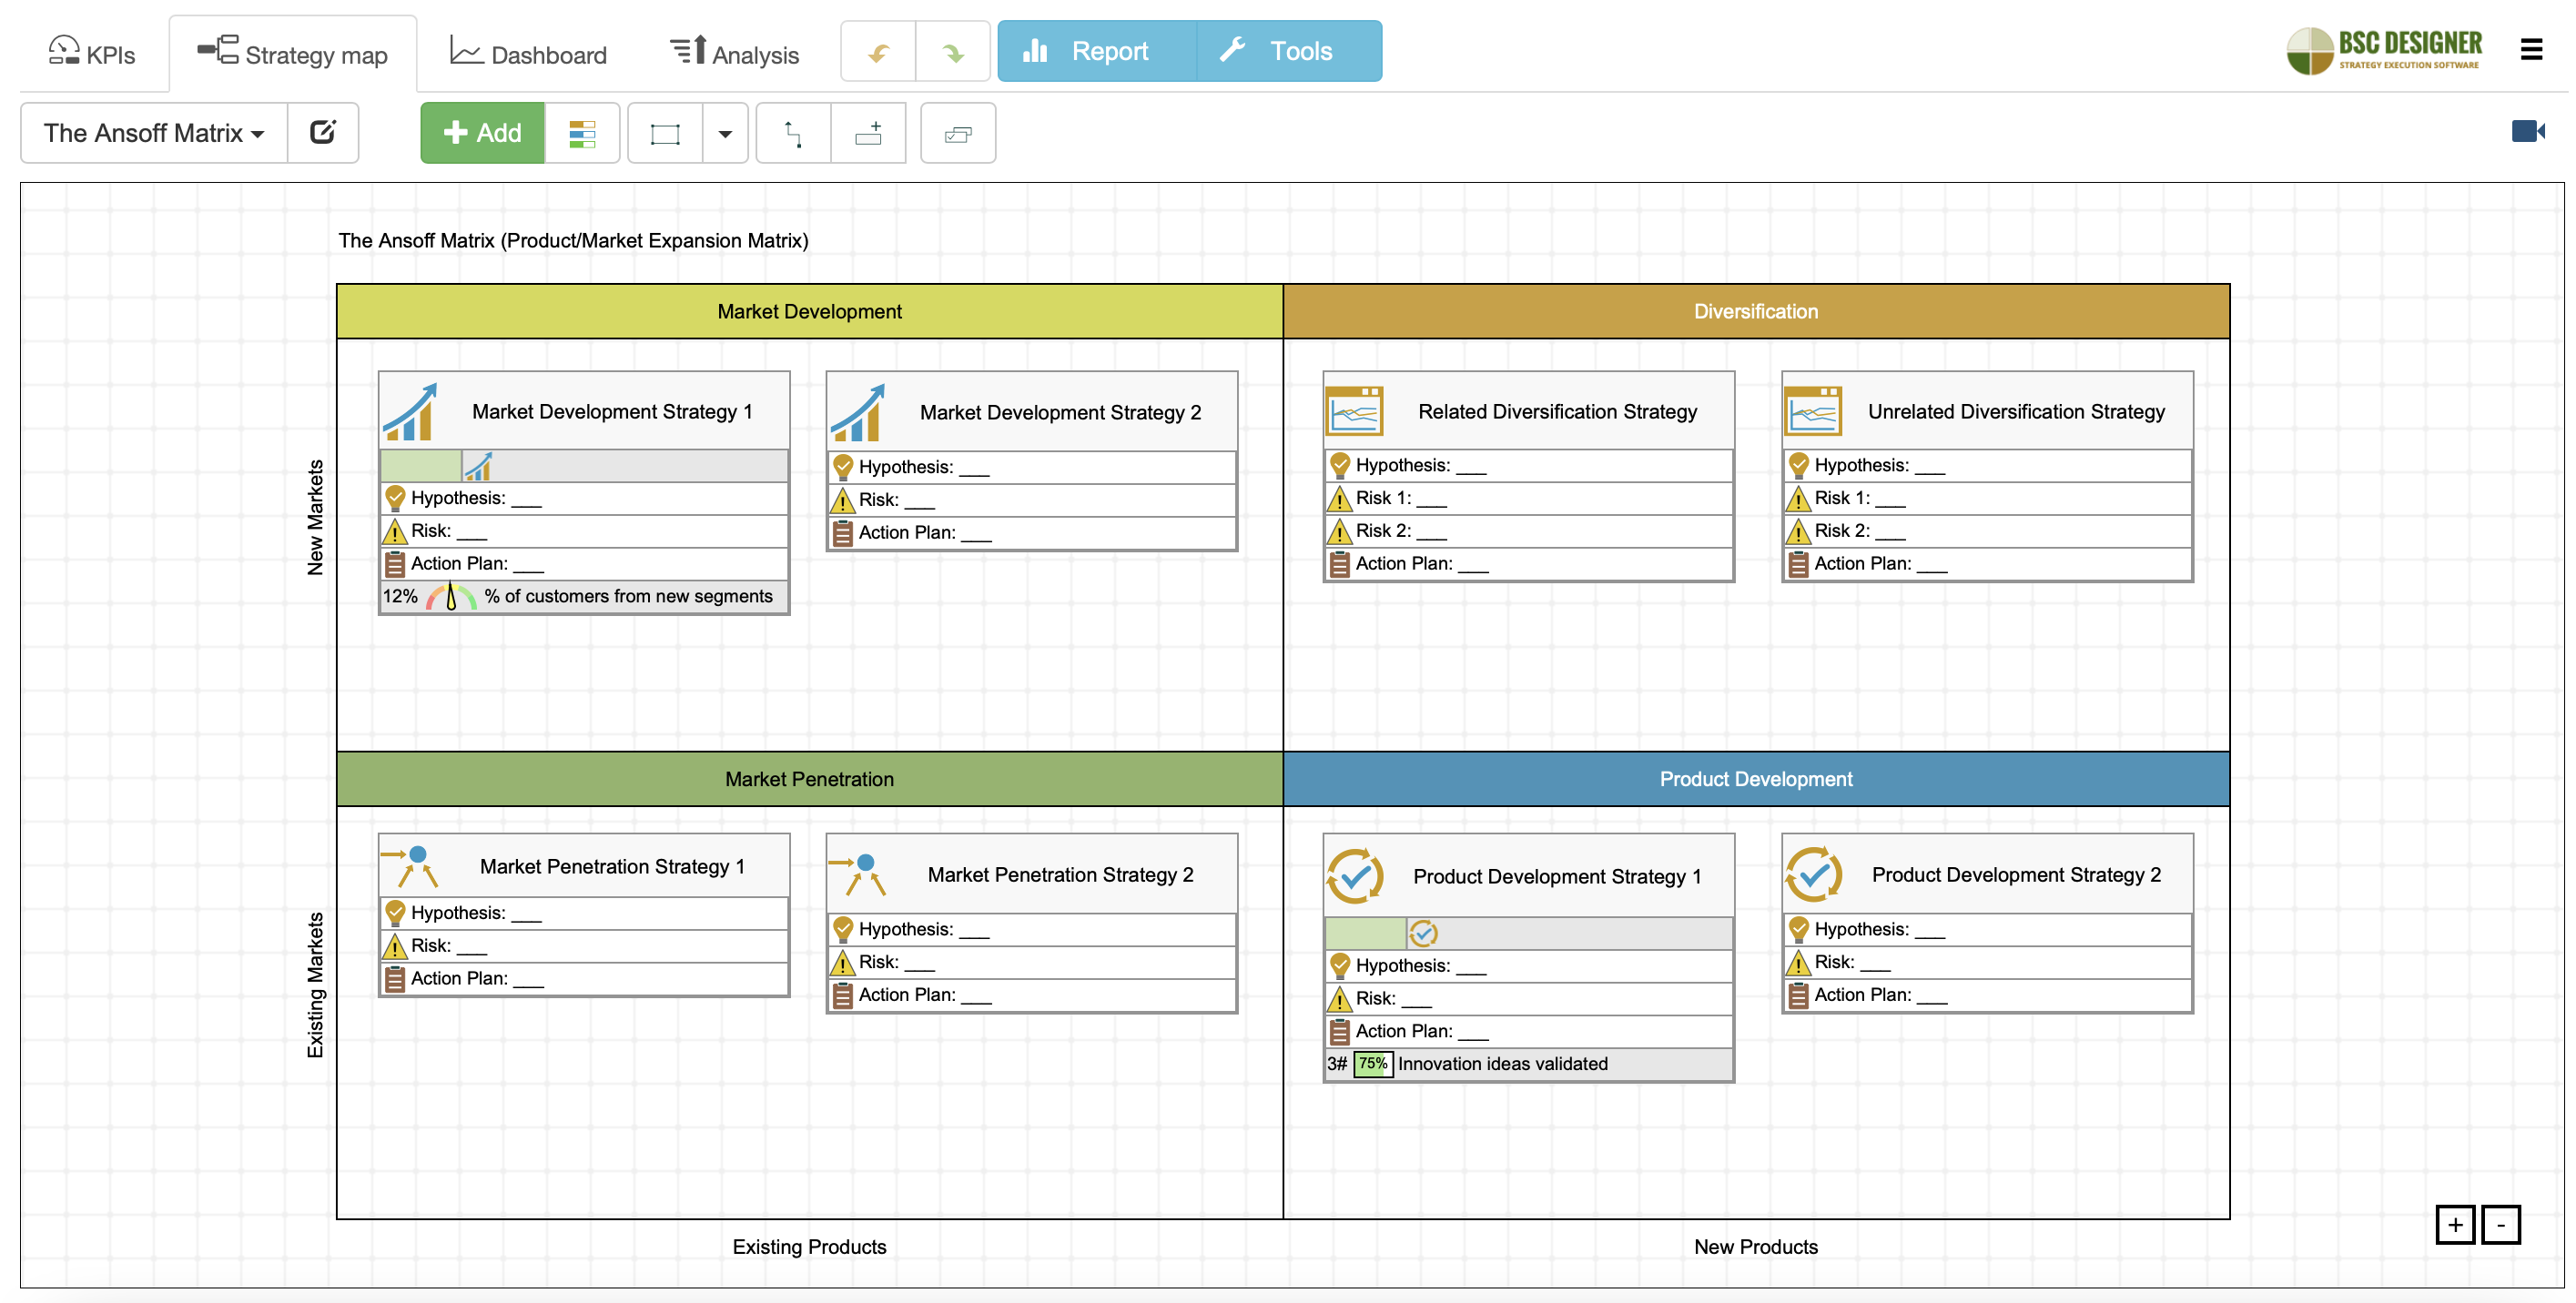
- The Ansoff Matrix Template added to BSC Designer. Learn more about using the Ansoff Matrix to define growth strategies:
June 2023 updates:
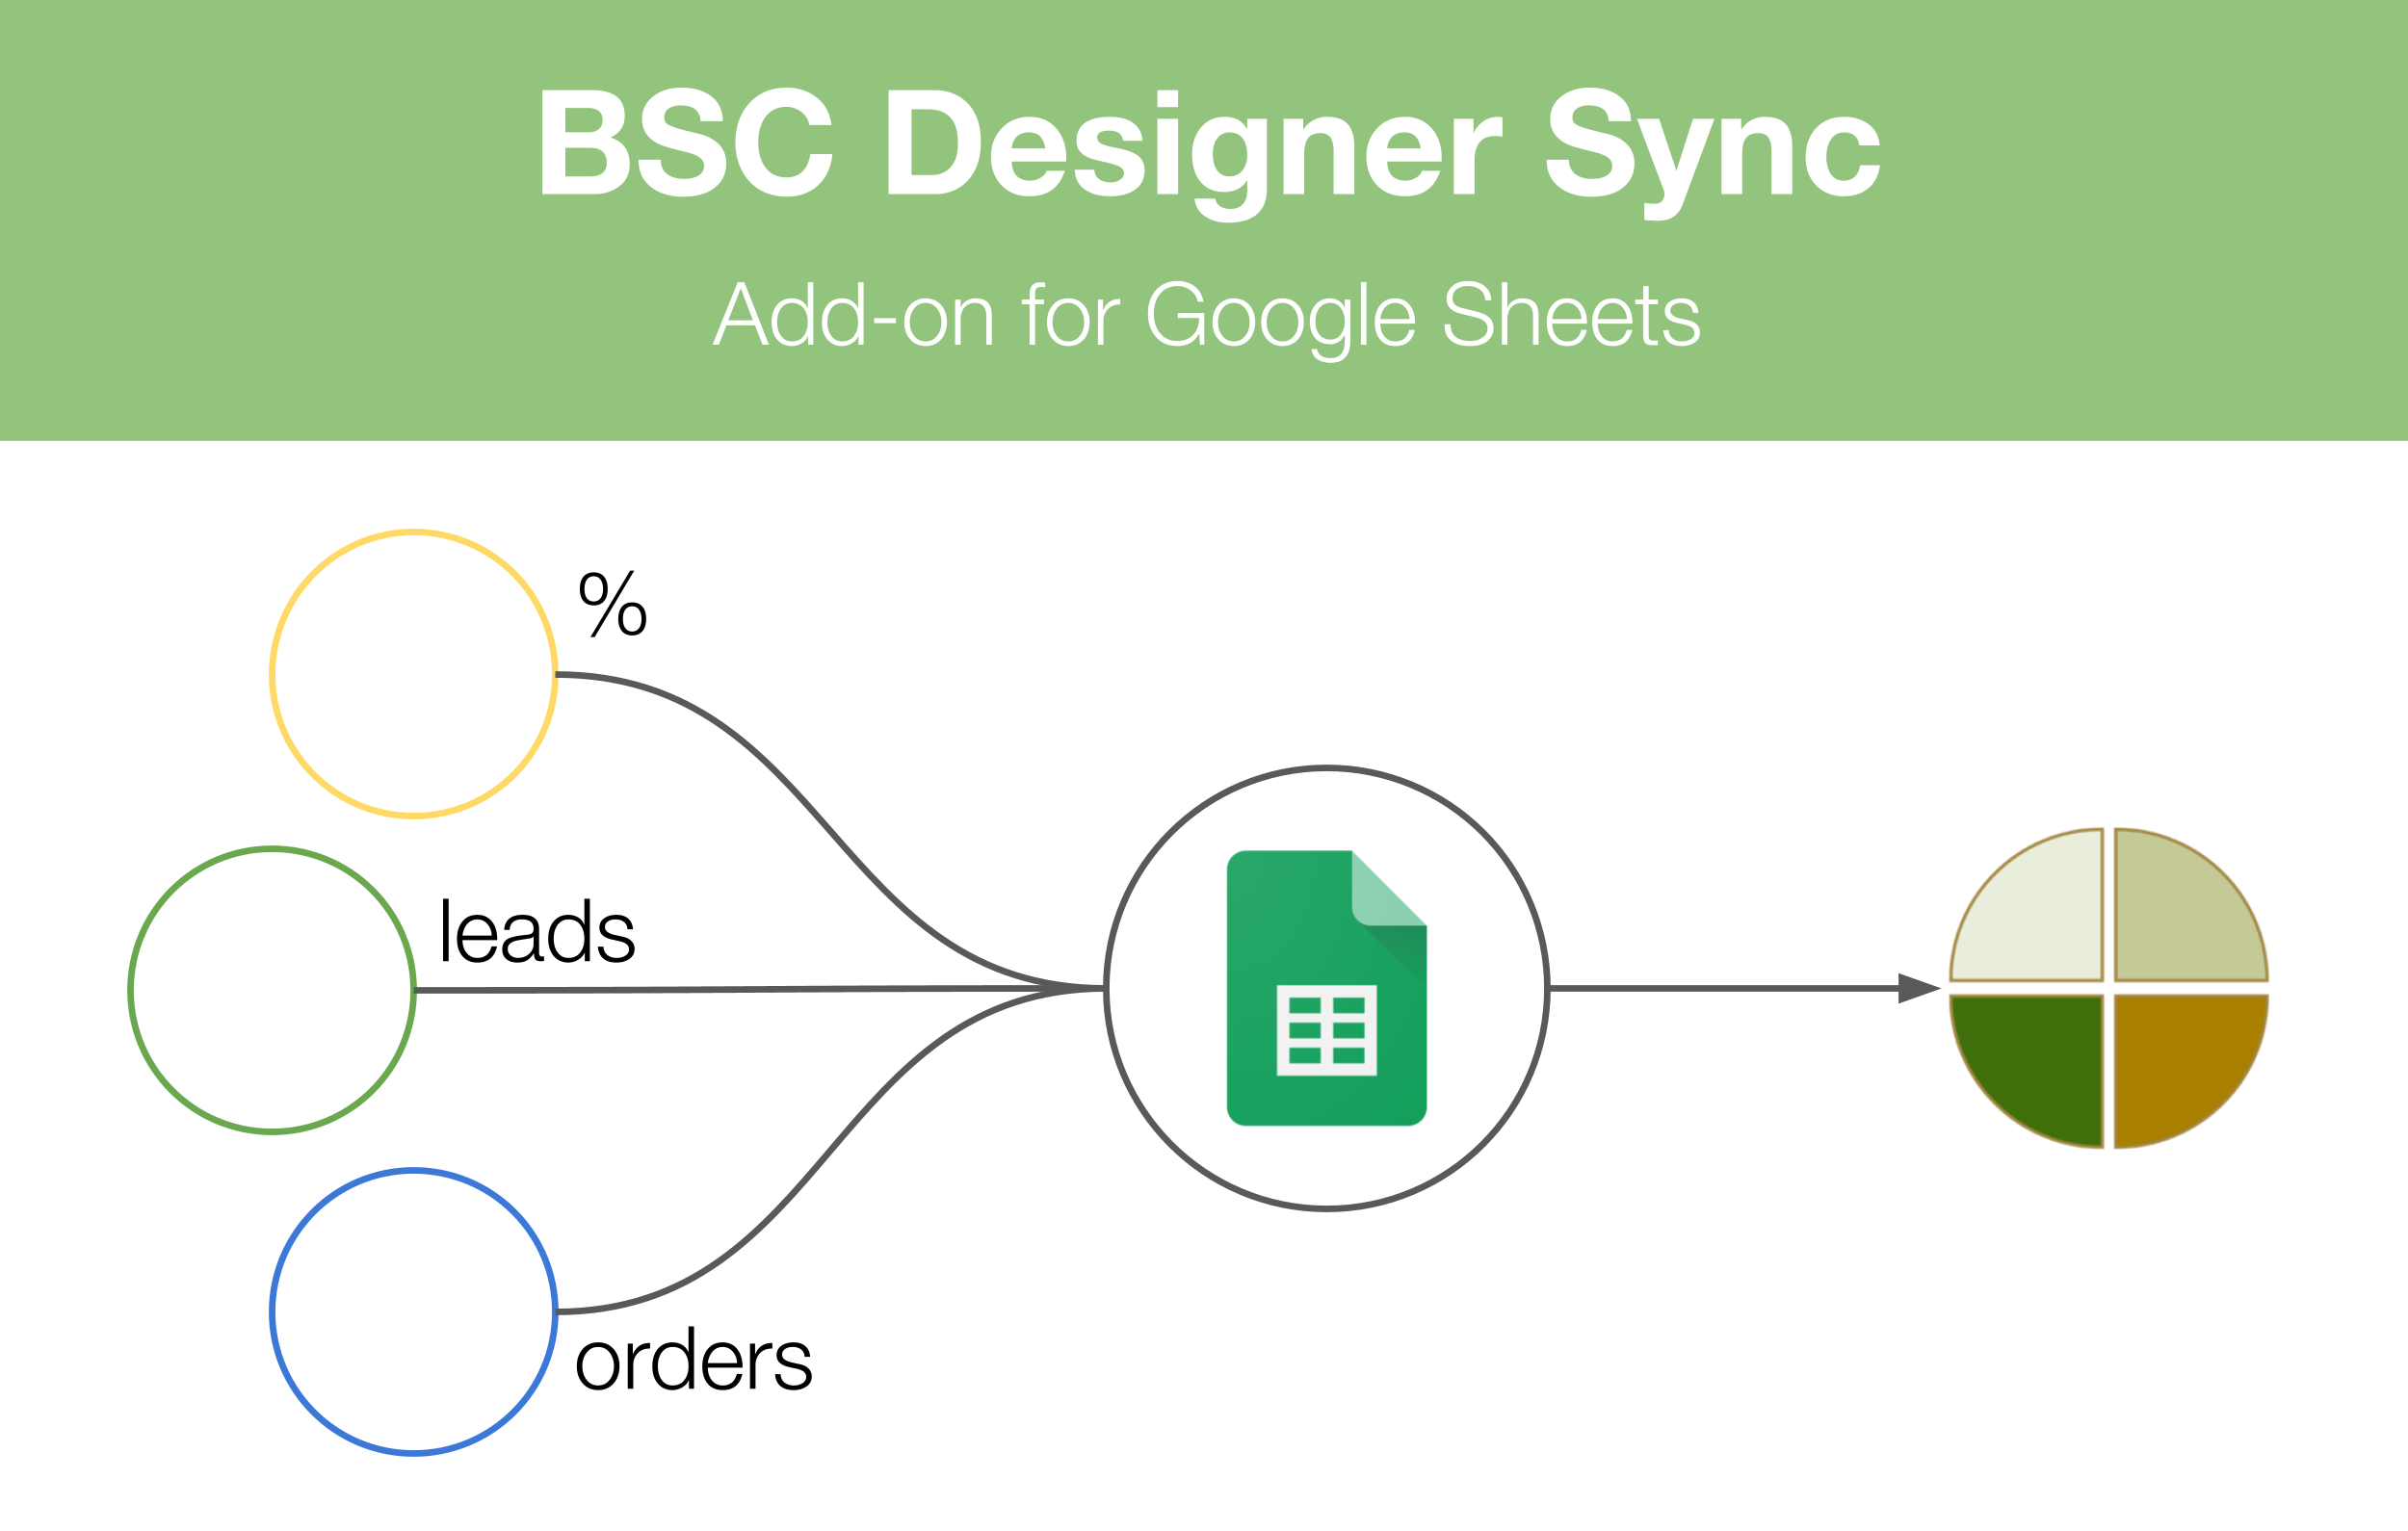
- BSC Designer Sync released. Automatically update KPIs via the Google Sheet Add-on:
April 2023 updates:
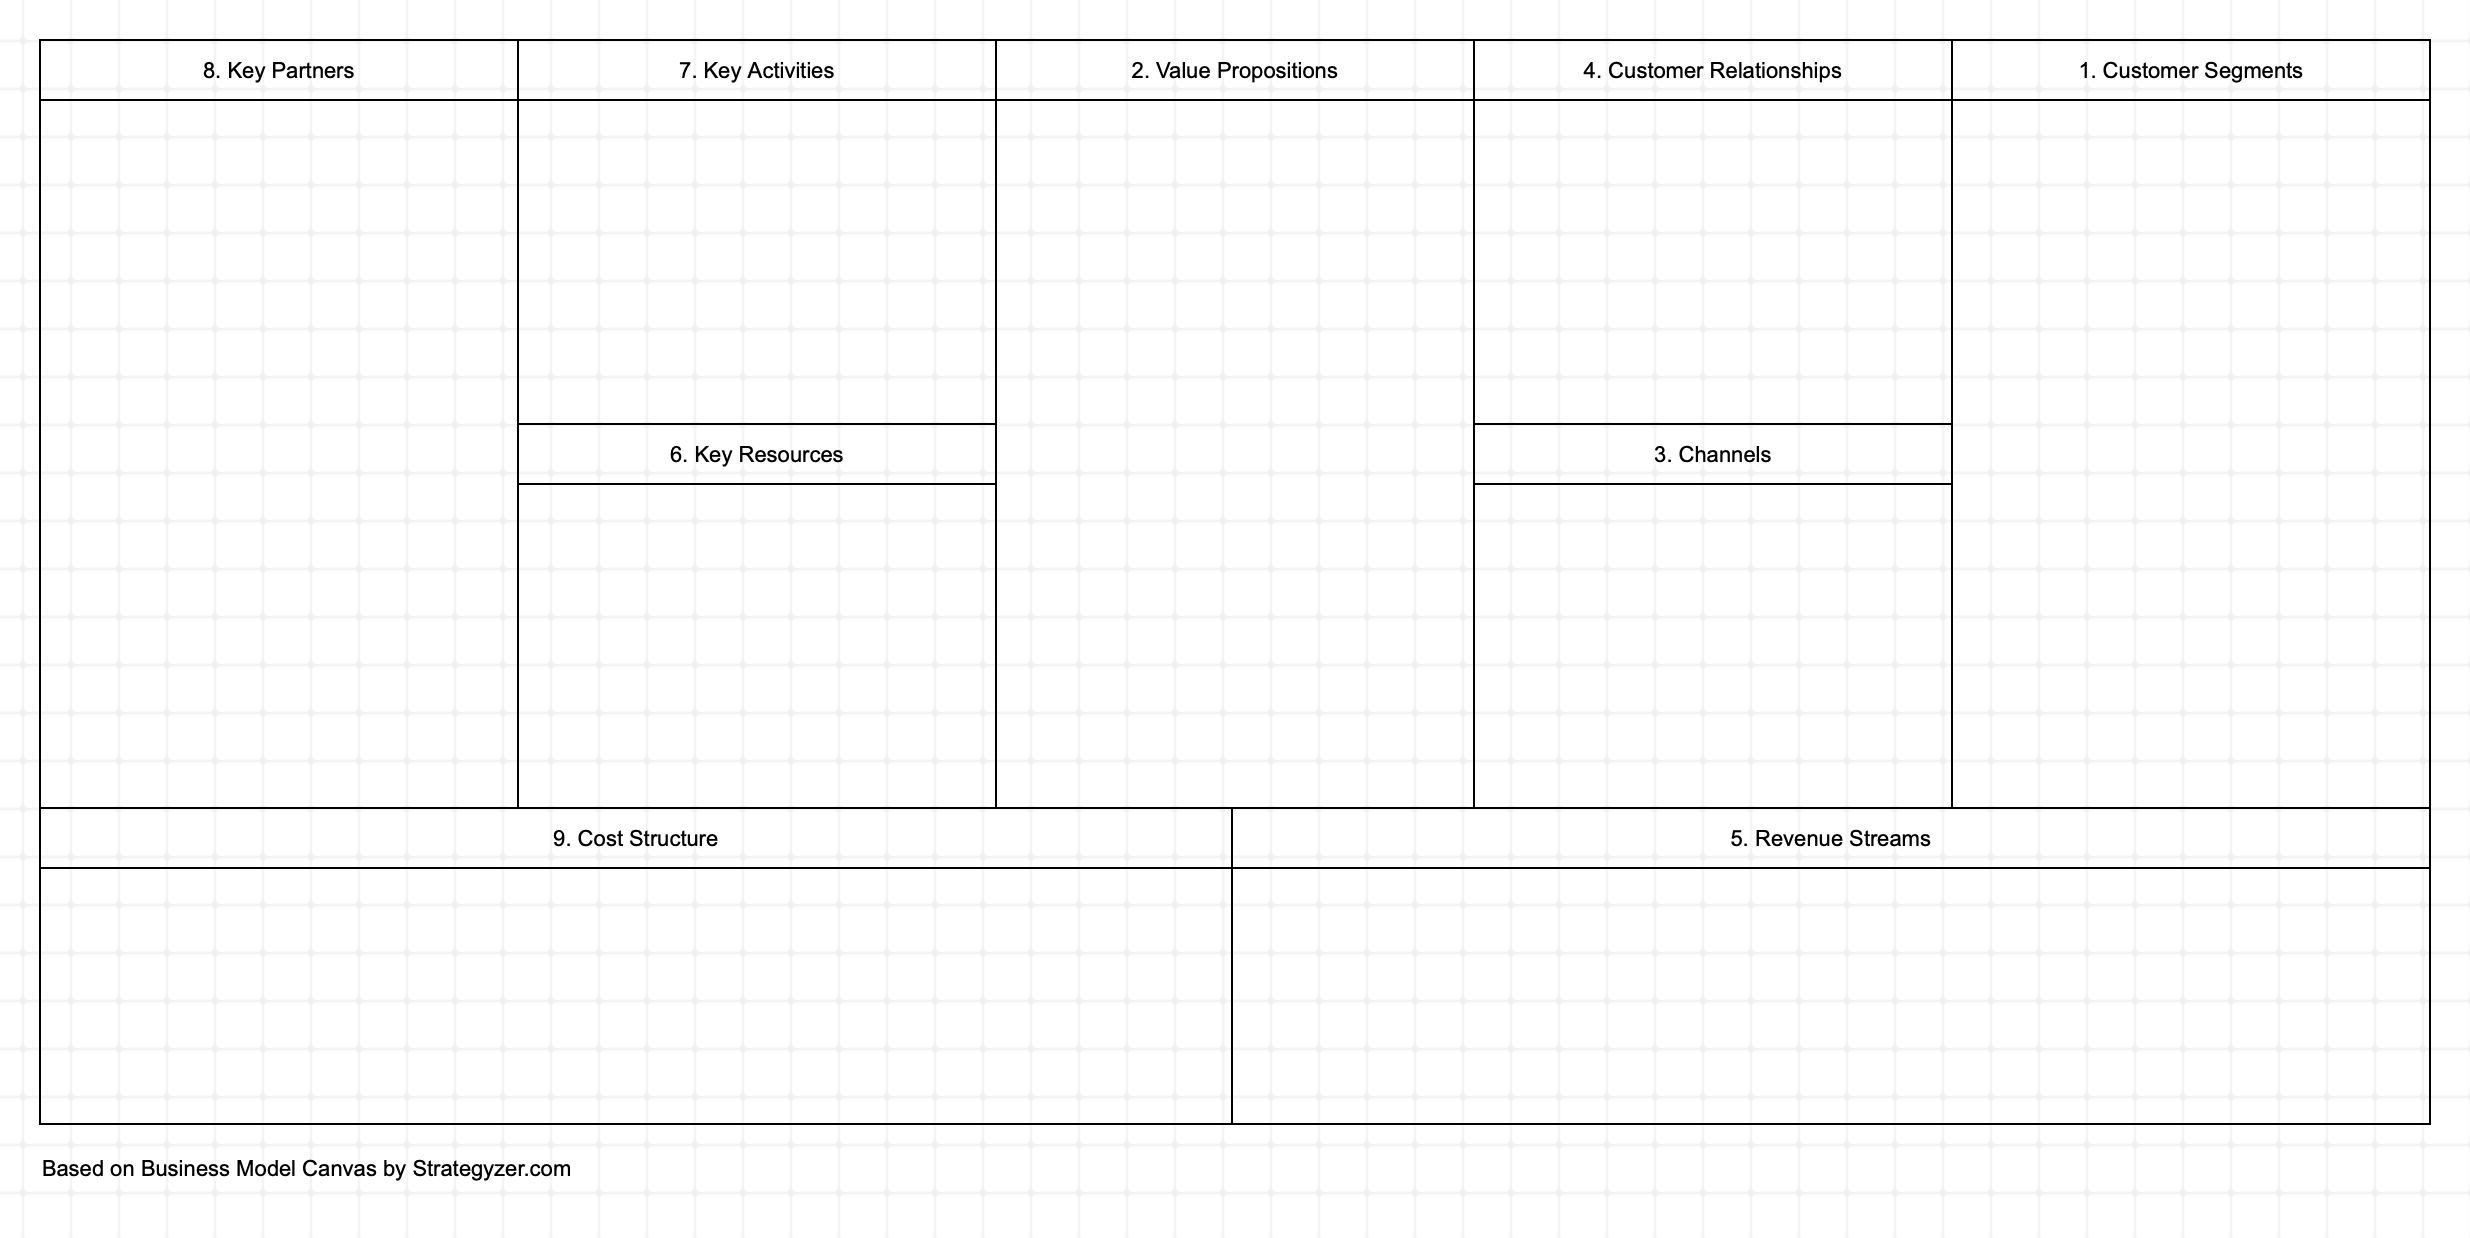
- Business Model Canvas template and example added
- Strategy maps and dashboards can now be included in any report
- Owners can now be visualised in the list of initiatives on the dashboard
March 2023 updates:
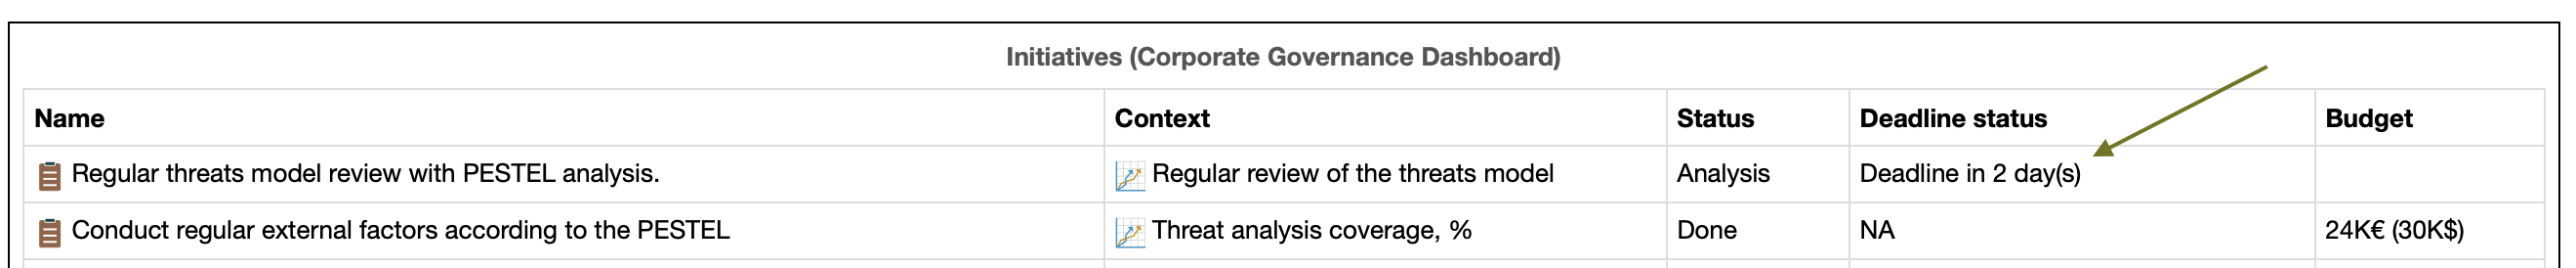
- The status of deadline is can now be displayed in a user-friendly manner on the initiatives diagram:
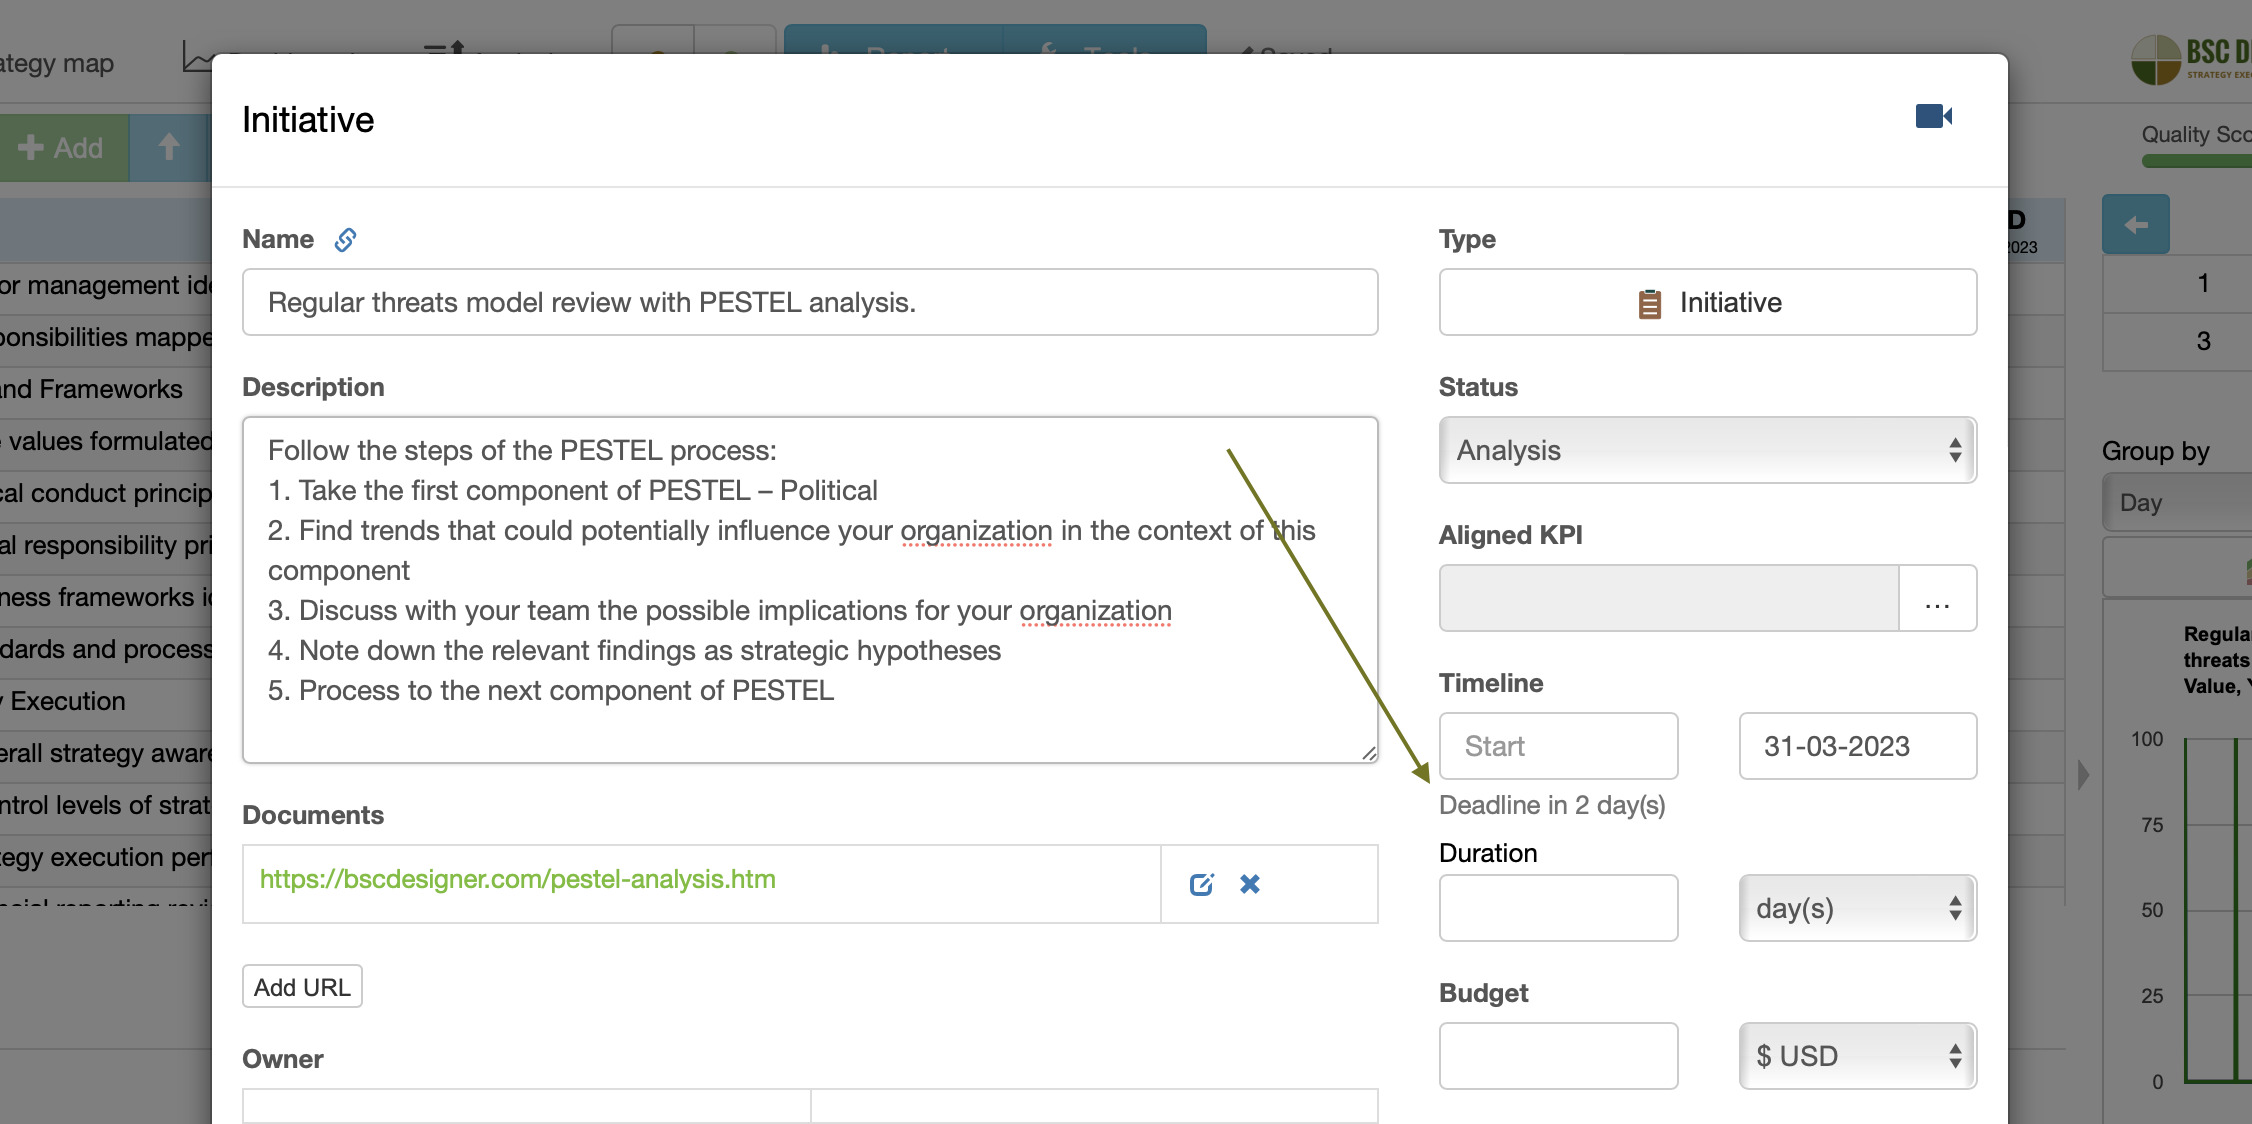
or in the Initiative dialog:
February 2023 update:
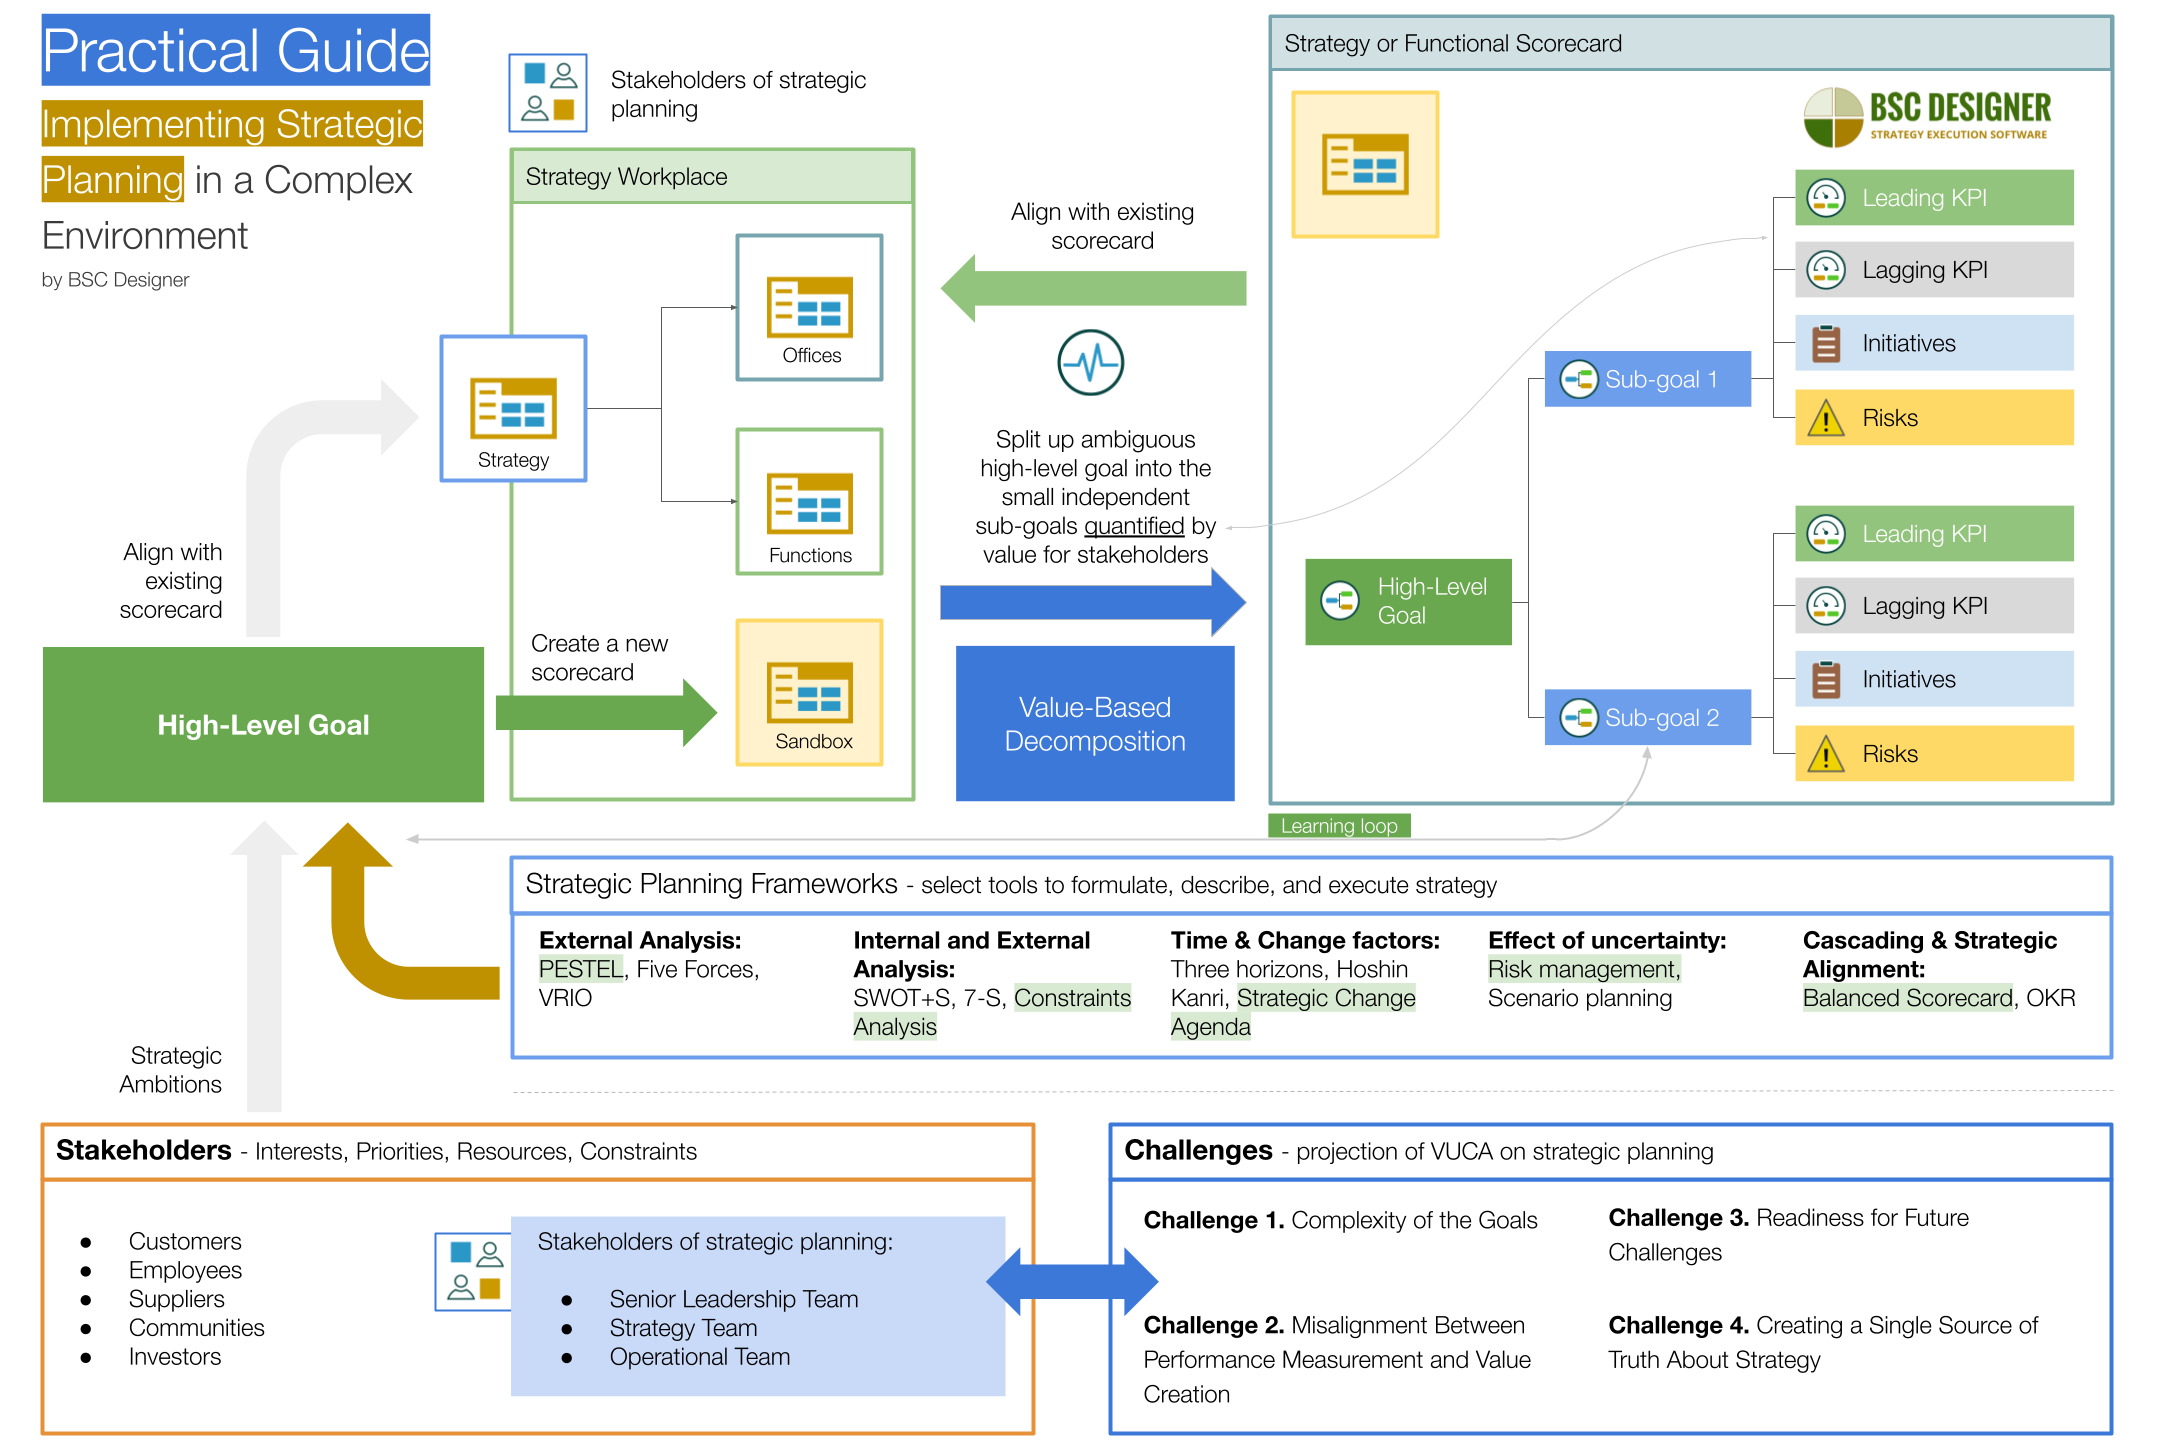
- Practical Guide: Implementing Strategic Planning in Complex Environment
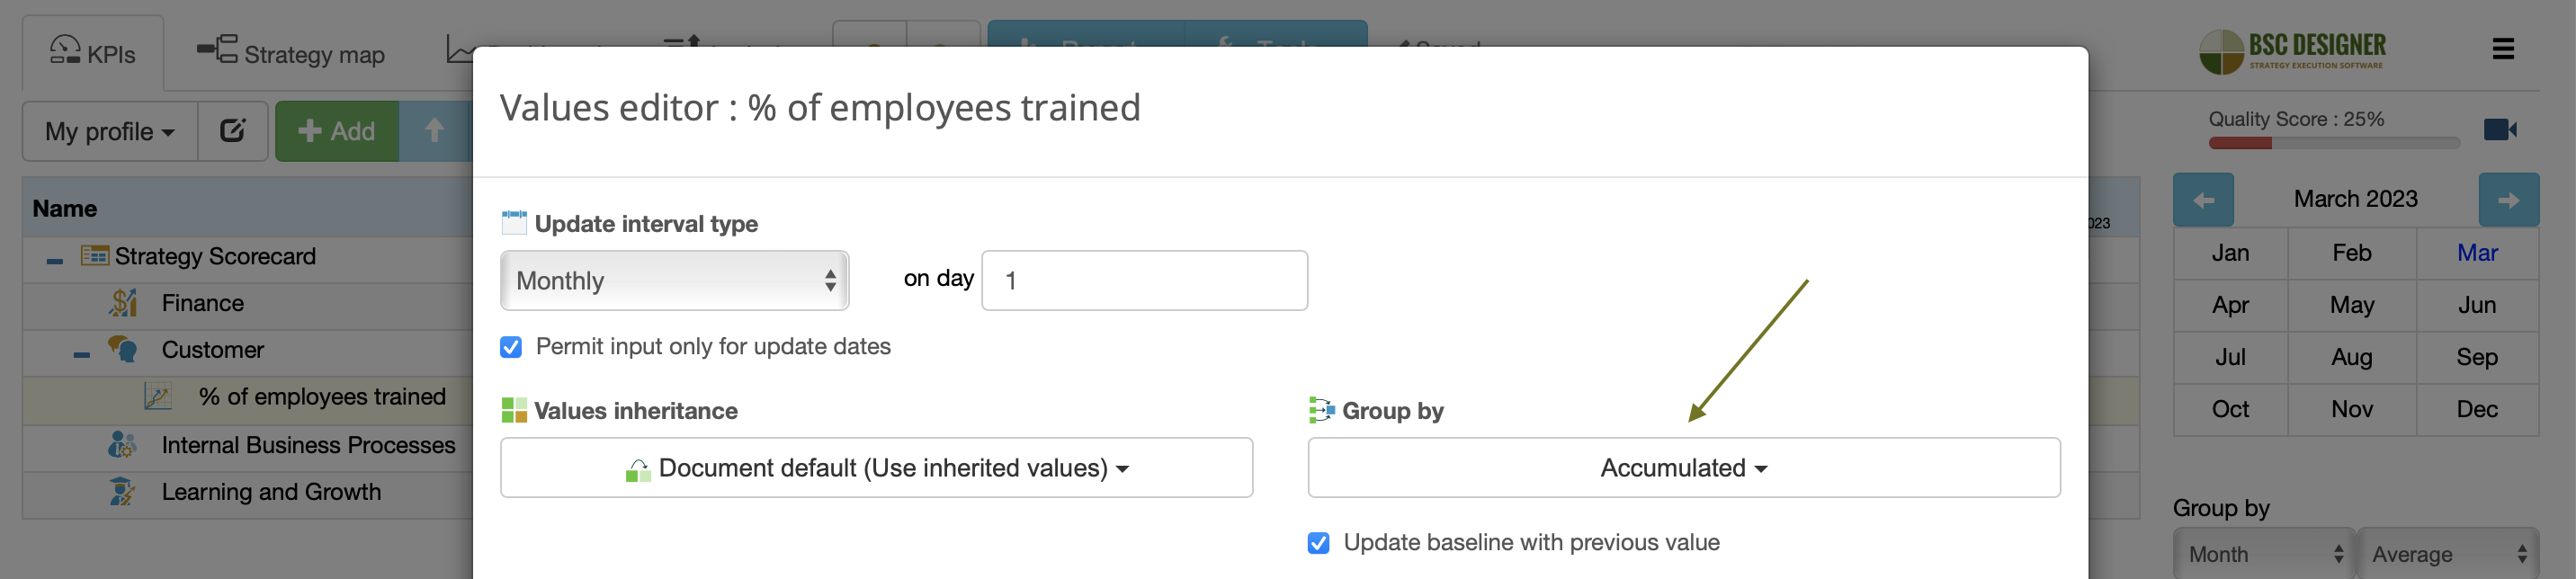
- New type of grouping “Accumulated” – the last value will be used as an aggregated value. To calculate the progress the software will use the first baseline, the last value, and the last target
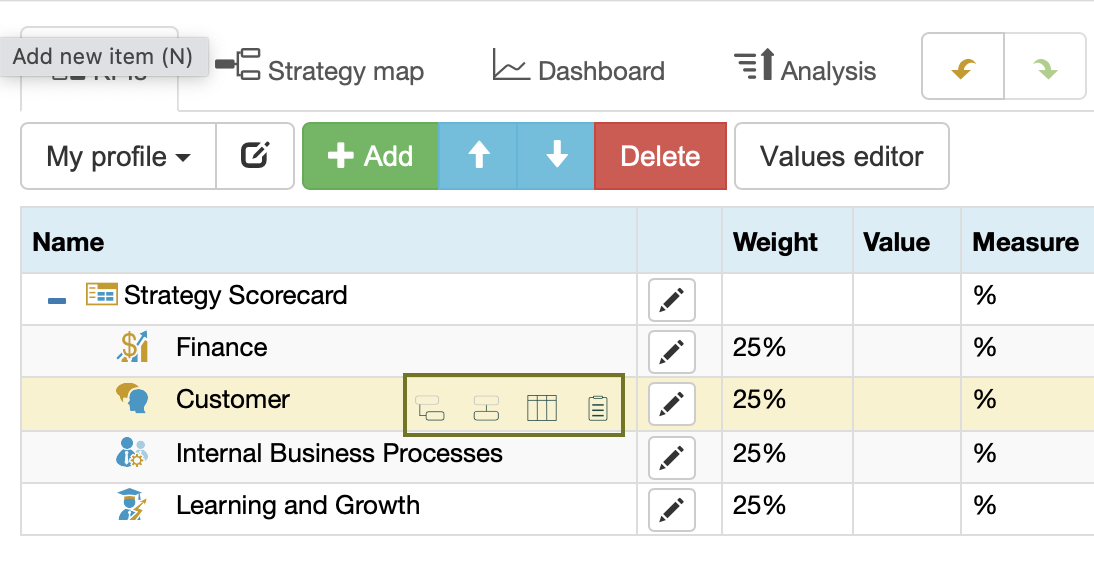
- Fast controls to create indicator as a child item, create indicator on the same level, access values editor, access initiatives
January 2023 updates:
- Automatic updates of the baseline for certain groups types
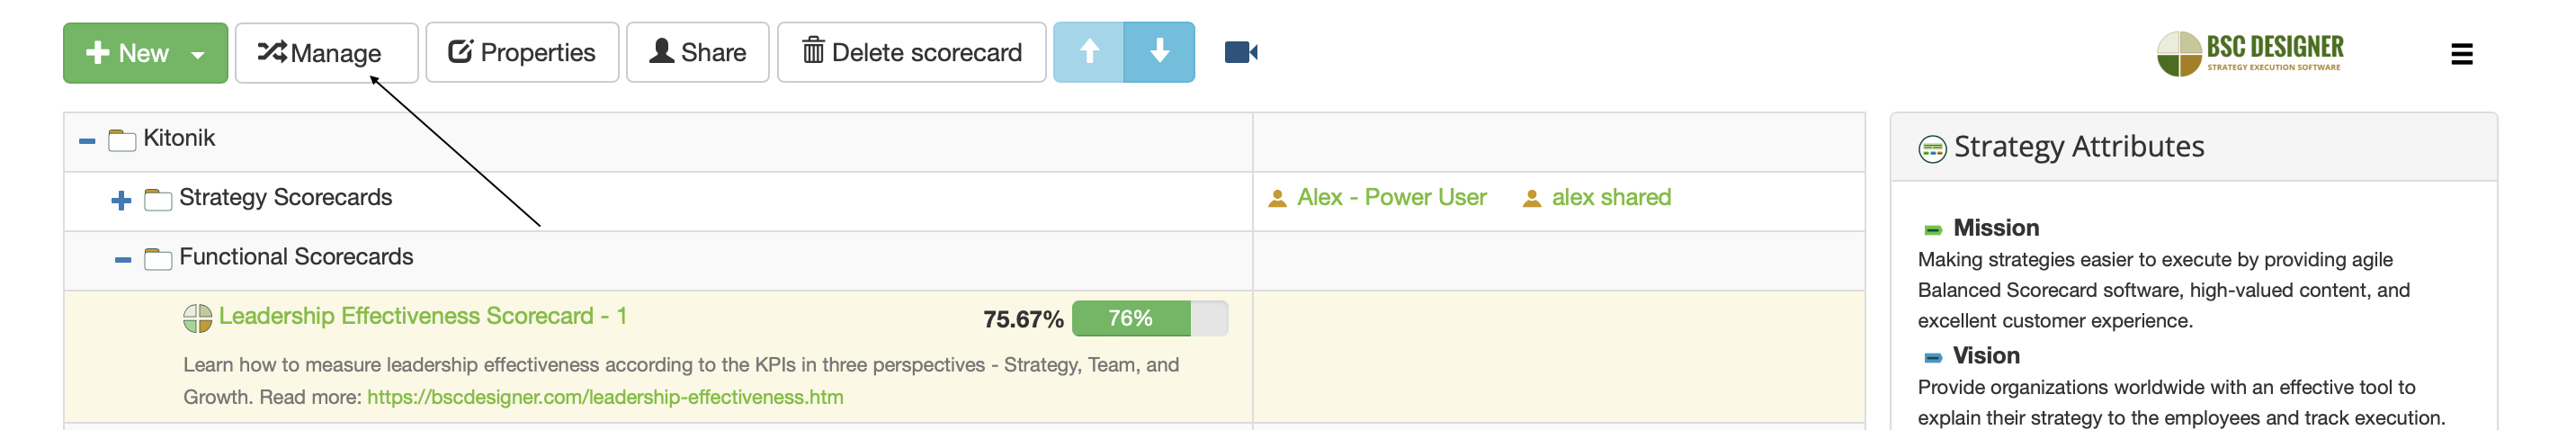
- Manage button for My scorecards section to easier copy and move scorecards:
December 2022 updates:
- Manage the list of stakeholders on the Settings > Strategy tab. Assign stakeholders to the goals via Owner field.
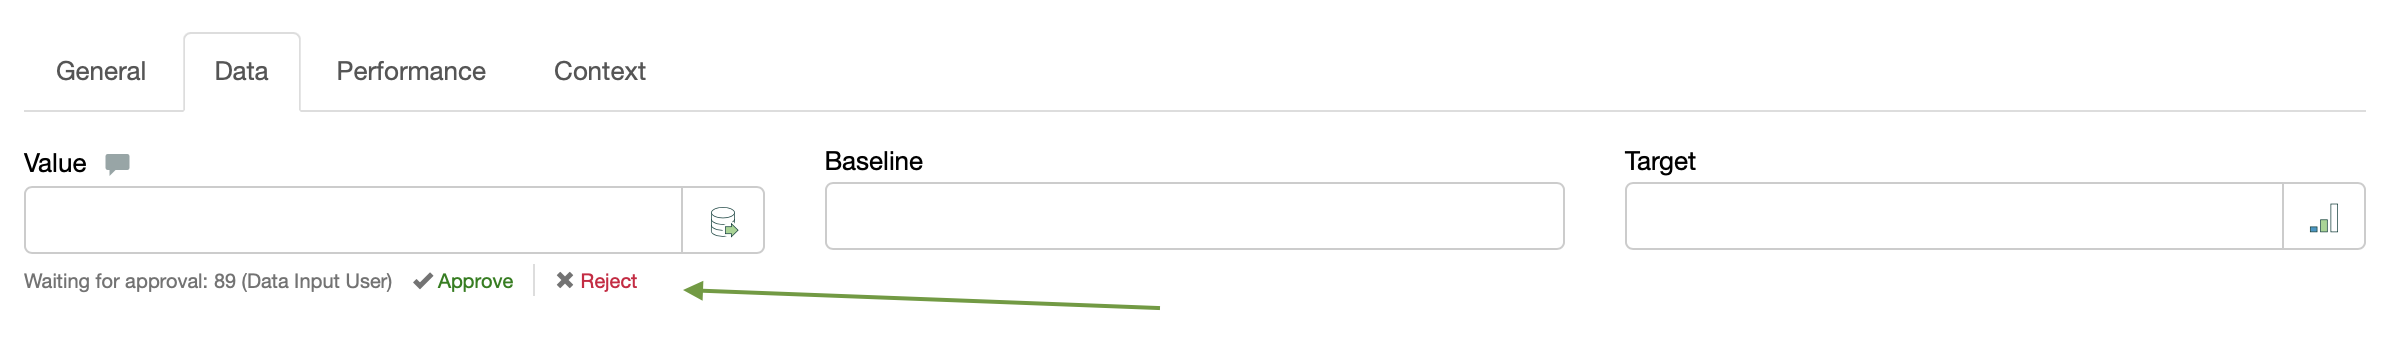
- A new option added to the settings of data input users: “Approval required for entered data”. If activated, all values entered by the user will be submitted for approval or rejection by power user:
November 2022 updates:
- A new type of users added – data input users
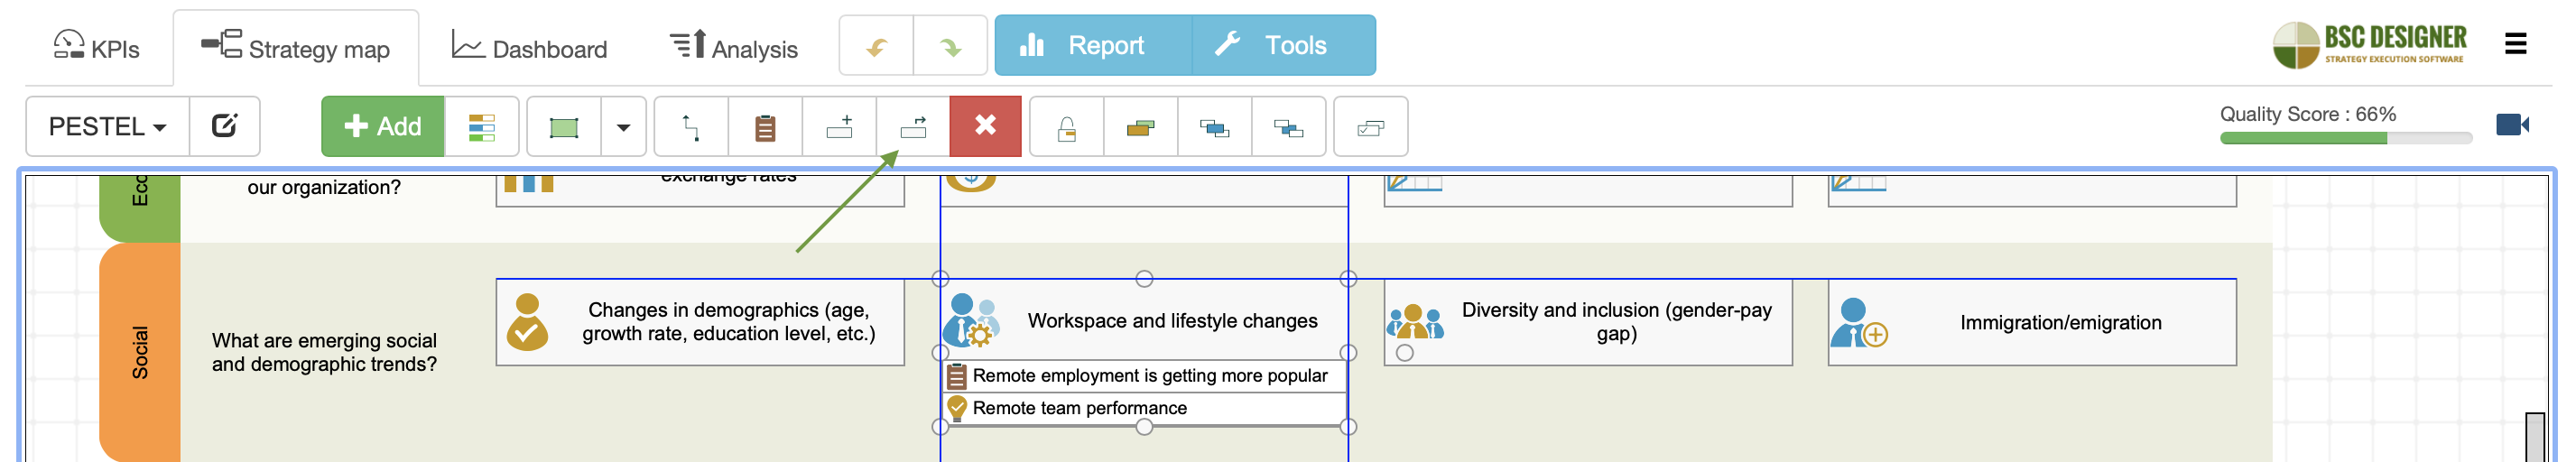
- Easier way to use the goal from one scorecard (for example, findings of PESTEL analysis or Strategic Agenda) on another scorecard:
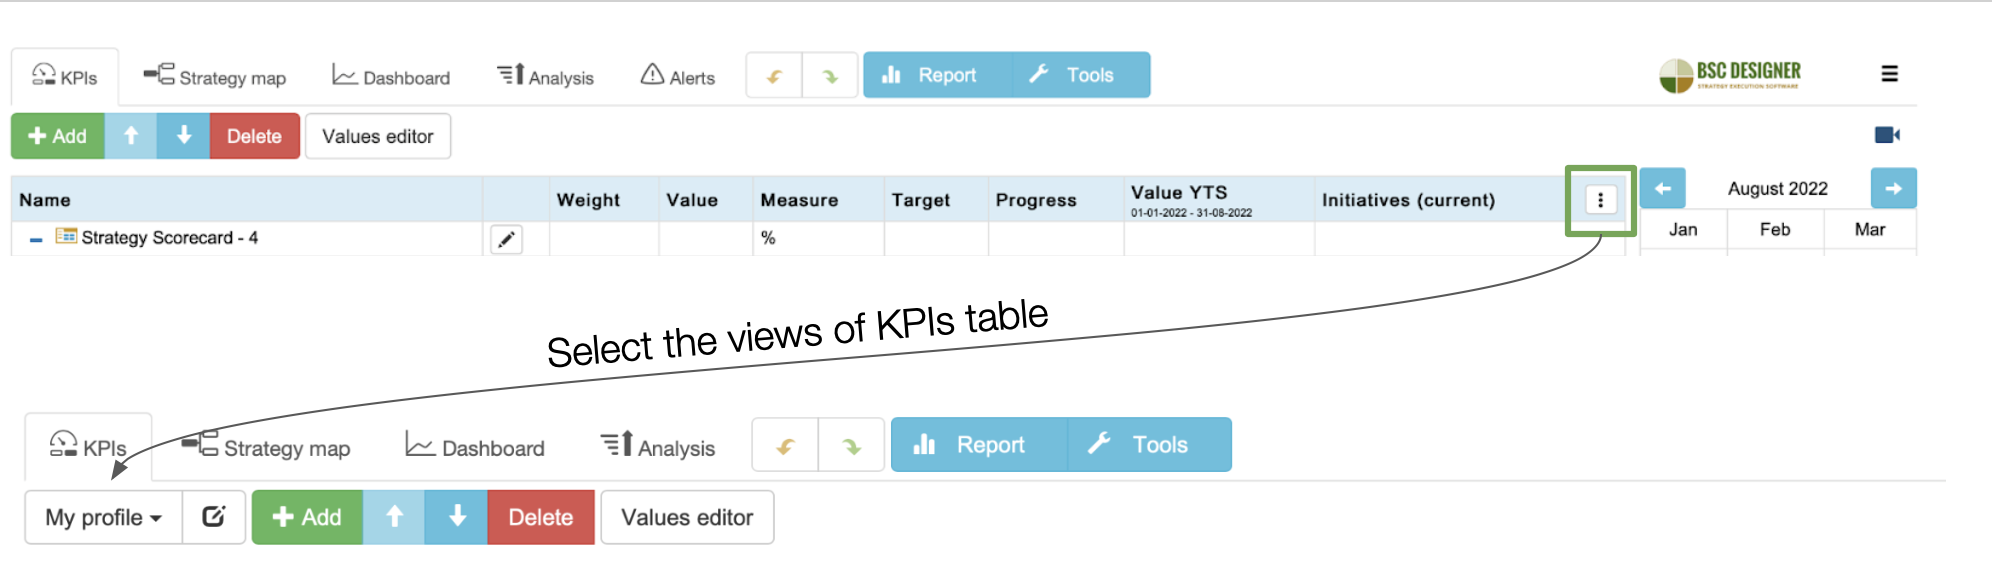
- Quick selection of the views for the KPIs table
October 2022 updates:
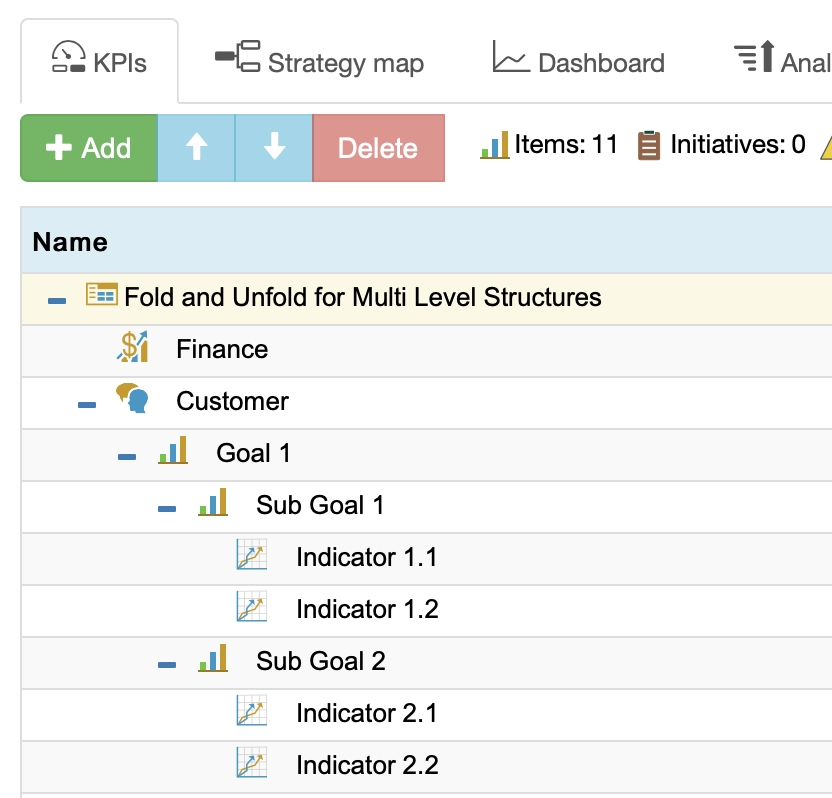
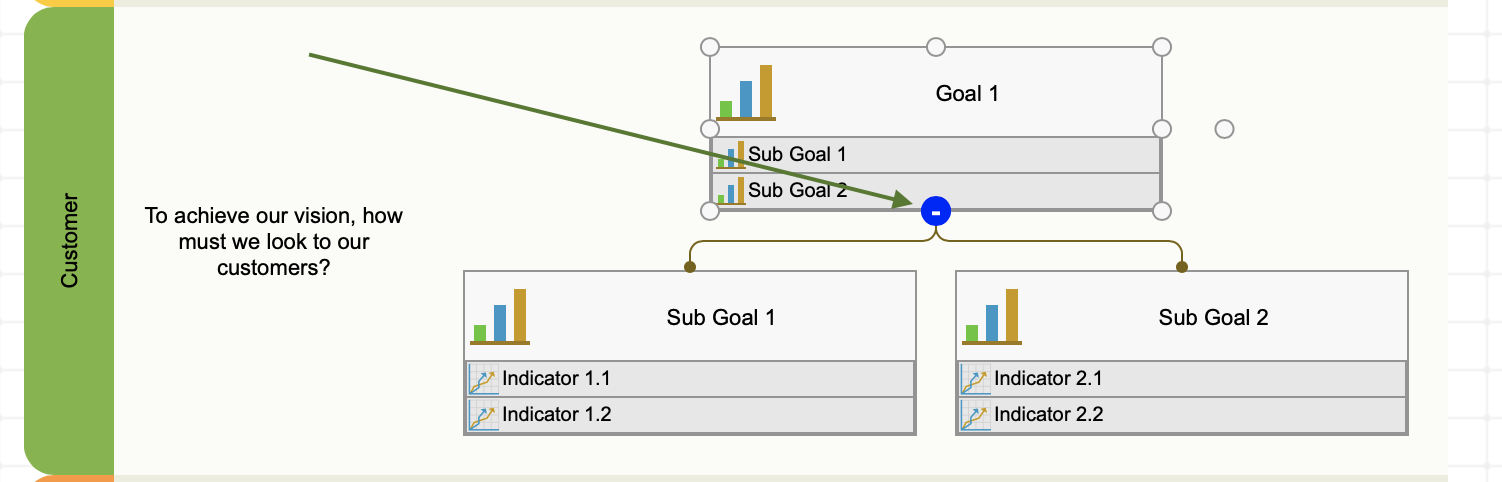
- Multi-level structure of goals/KPIs might look fine on KPIs tab, but on strategy map, they might become huge. We’ve added a possibility to fold/unfold all child branches or specific ones. Select a goal on strategy map and look for the blue circle.
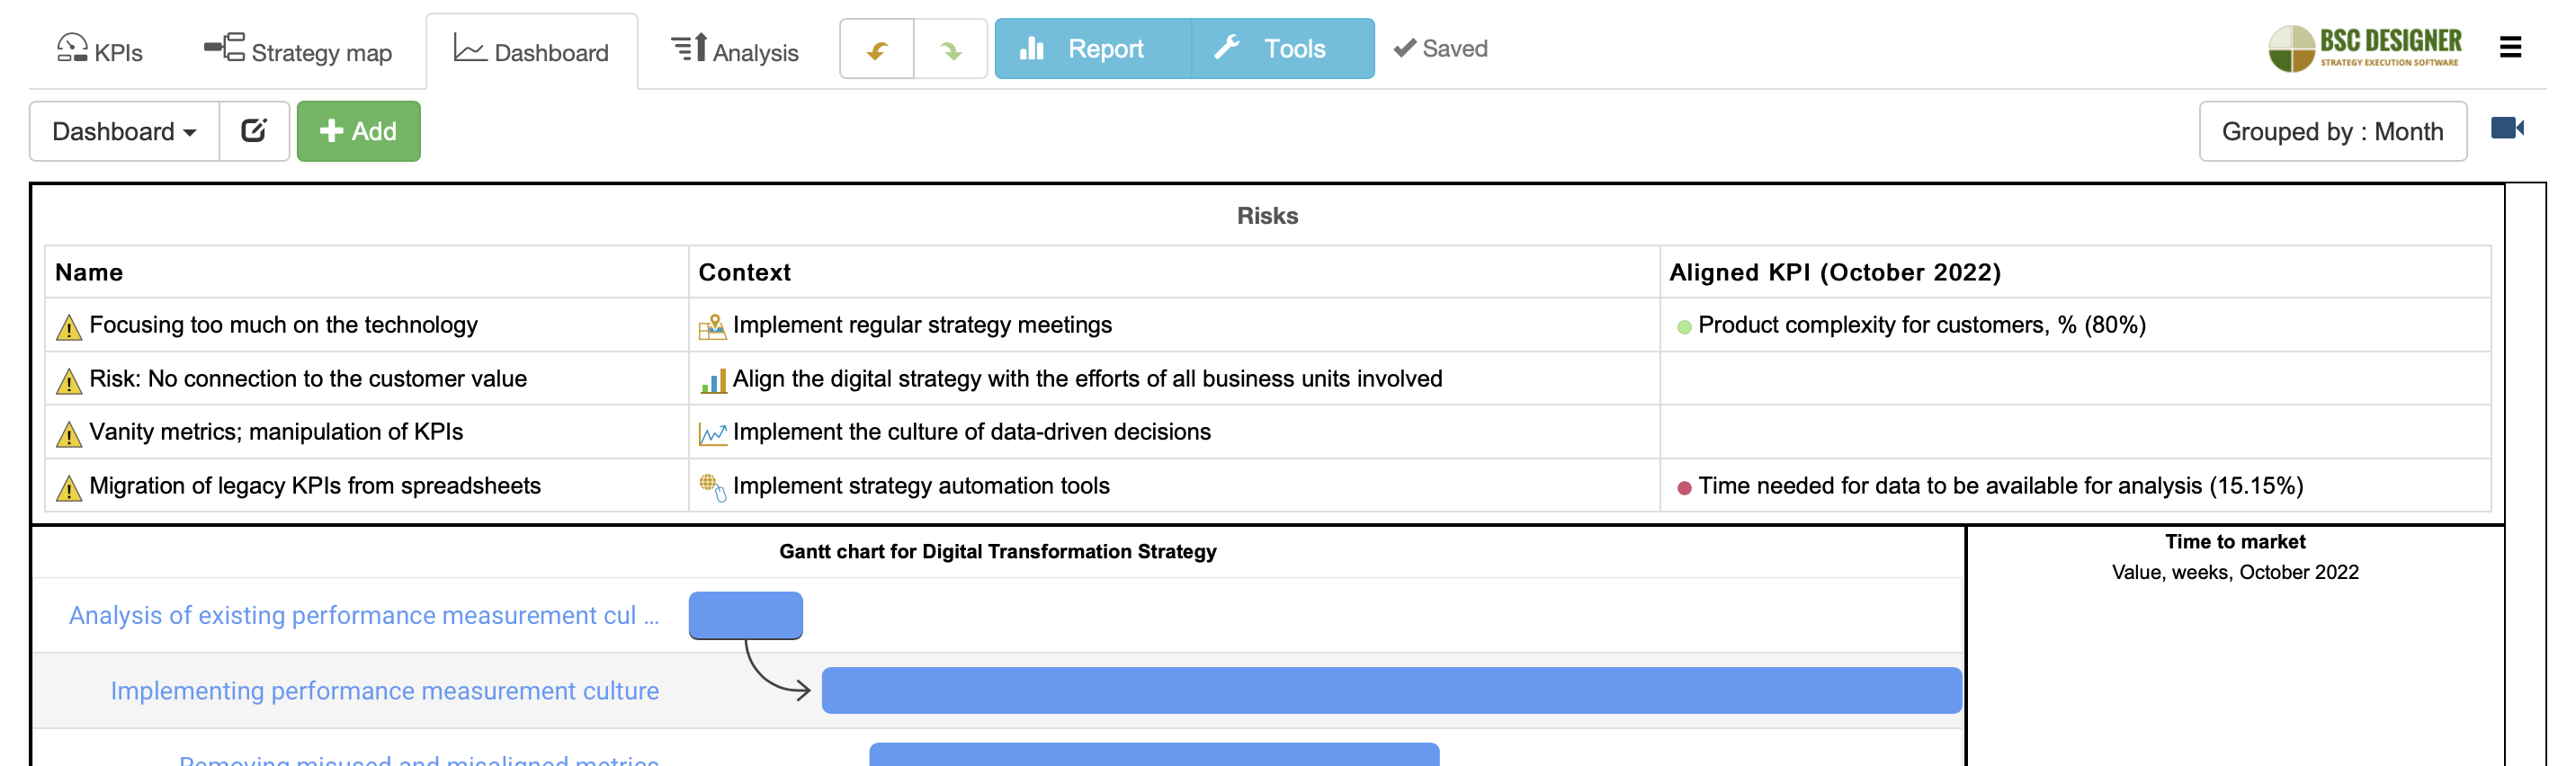
- Visualize initiatives on the dashboard. Filter by record type to visualise, for example, risks only.
September 2022 updates:
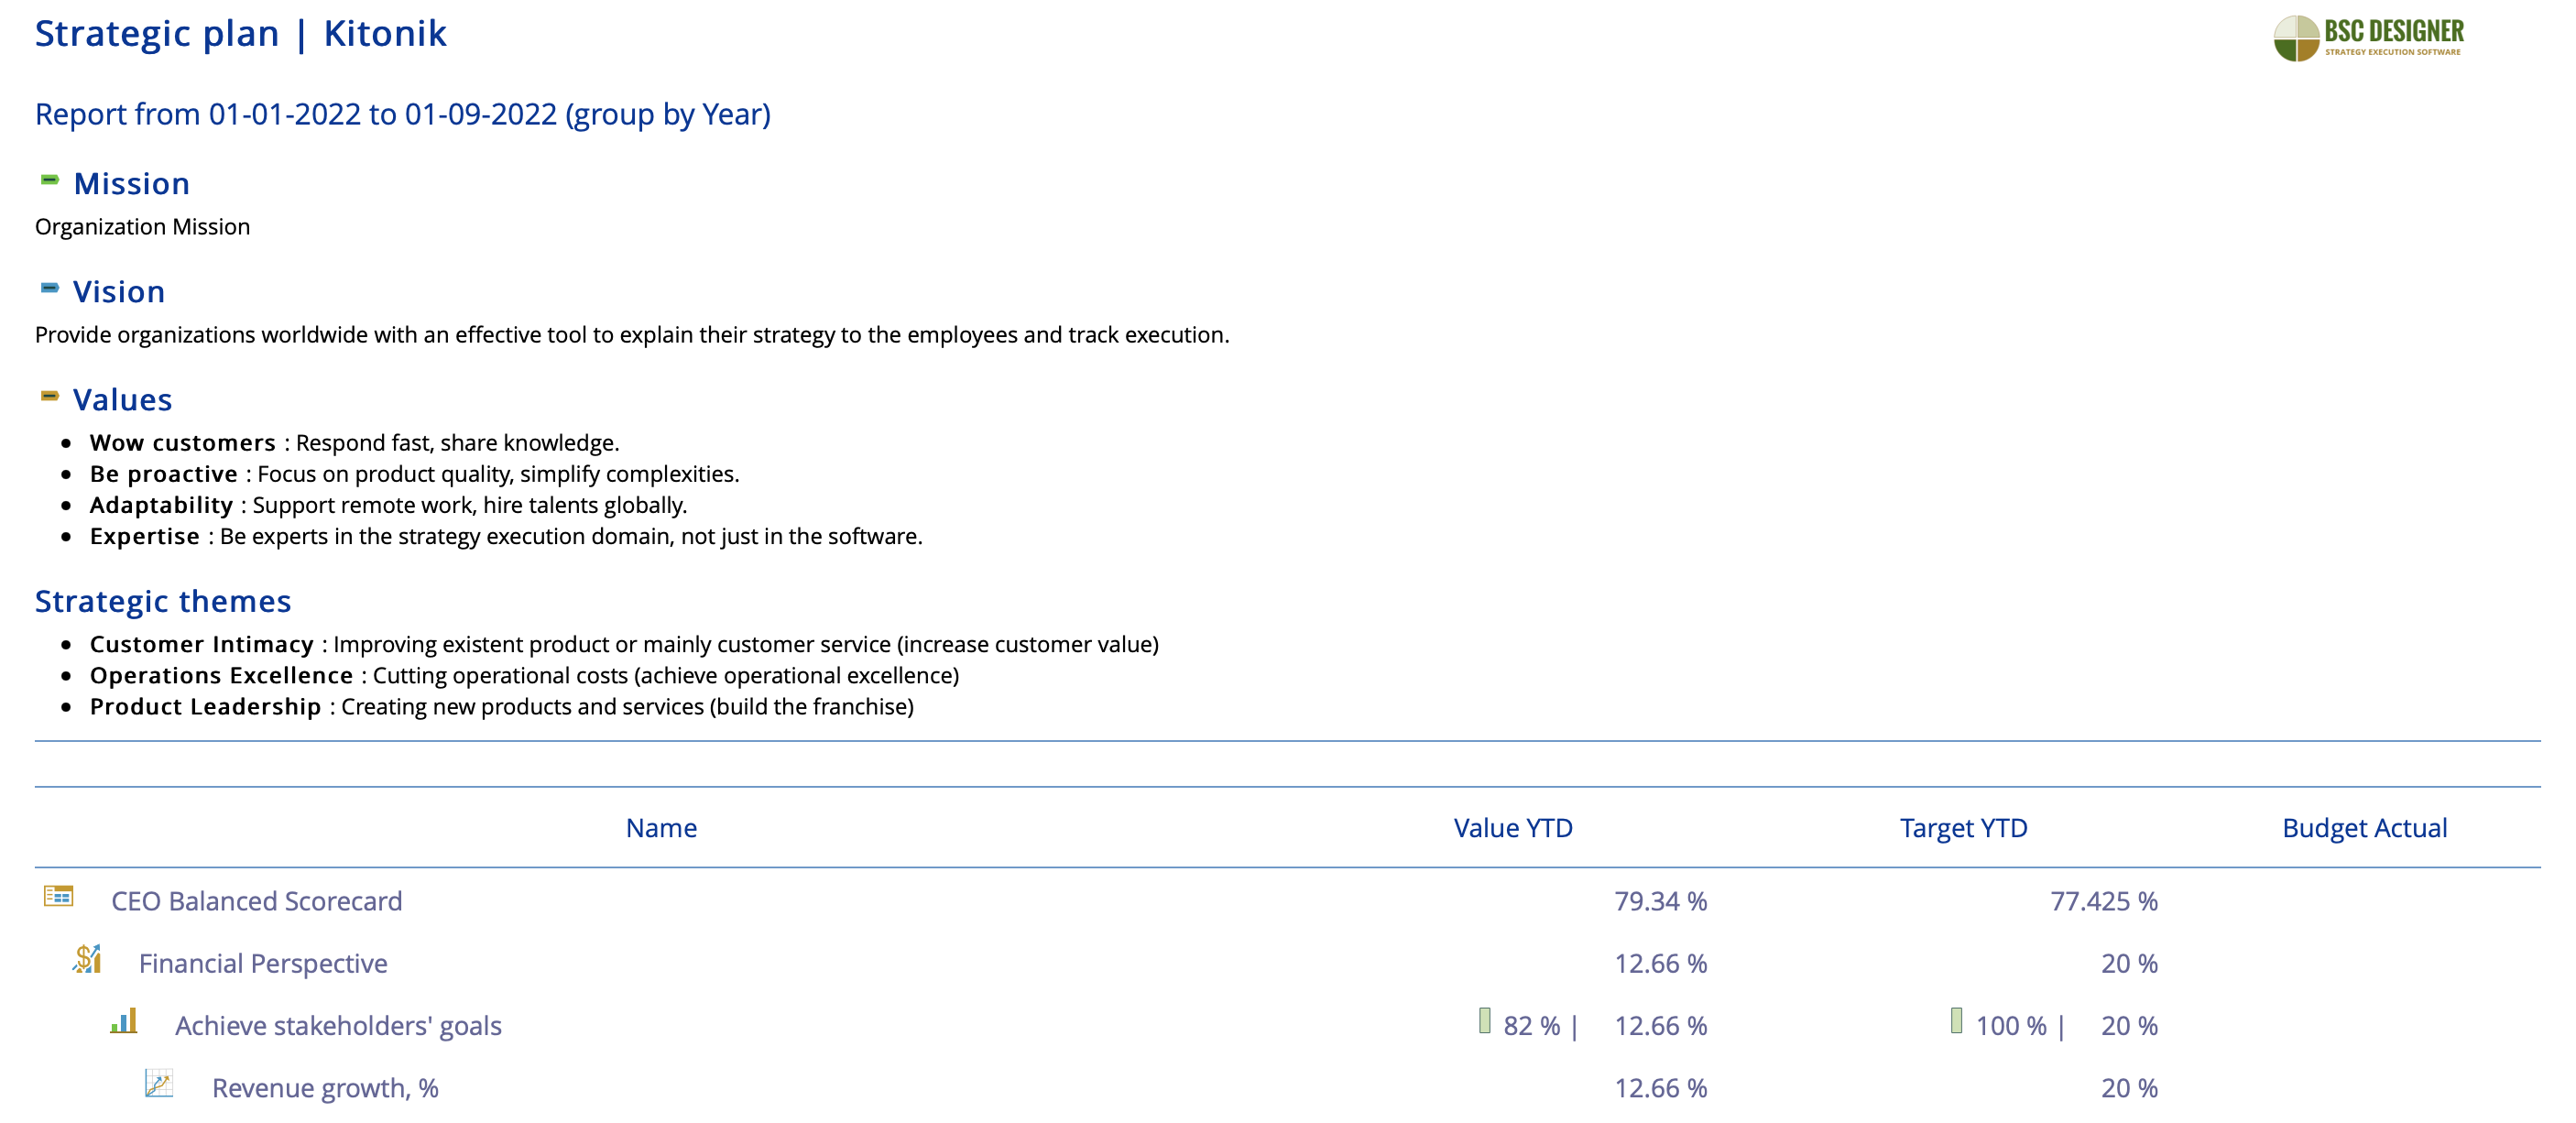
- Strategic plan report that contains strategy attributes (mission, vision, values), strategic themes, the key goals and KPIs from the current scorecard.
August 2022 updates:
- [Major update] The initiative can now be displayed directly on the KPIs tree. For each status of the initiative its visualization option can be configured (Settings > Workflow > Initiative statuses > Edit) whether to display it always, or display it only when an initiative is relevant for the currently selected date.
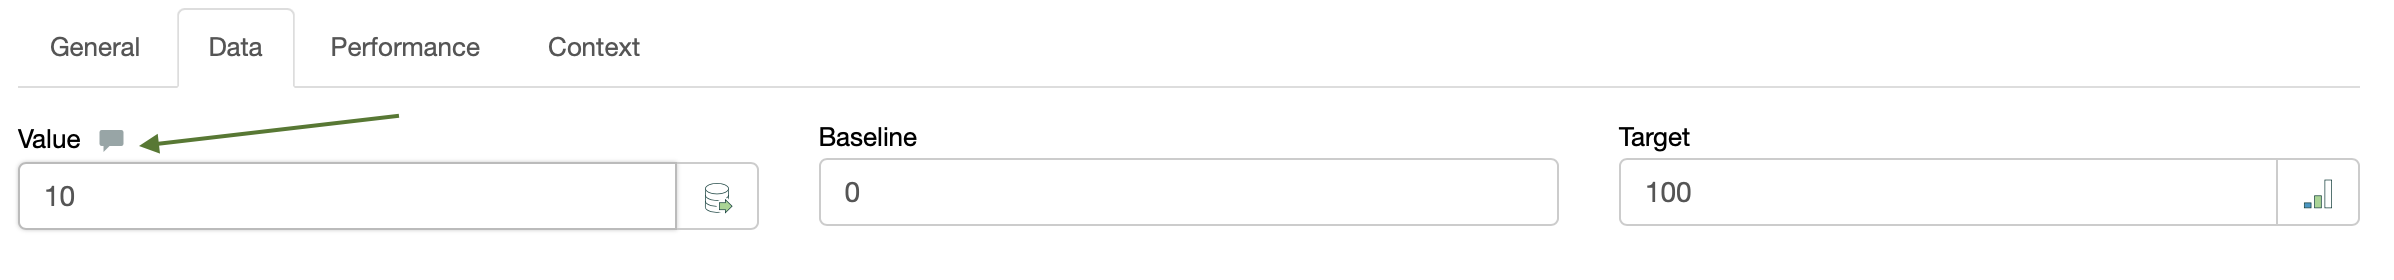
- Commenting the values of the KPIs is now easier – you will find comment button next to the Value field as well as in values editor:
July 2022 updates:
- Shift to a centralised datasources for SQL indicators. Create a datasource on the Integrations tab. Re-use it for all SQL indicators.
- Quality score tool now supports Risk indicators and the connections between goals in different perspectives that break cause-and-effect logic.
June 2022 updates:
- Added Dashboard and Strategy Map reports + a possibility to schedule sending
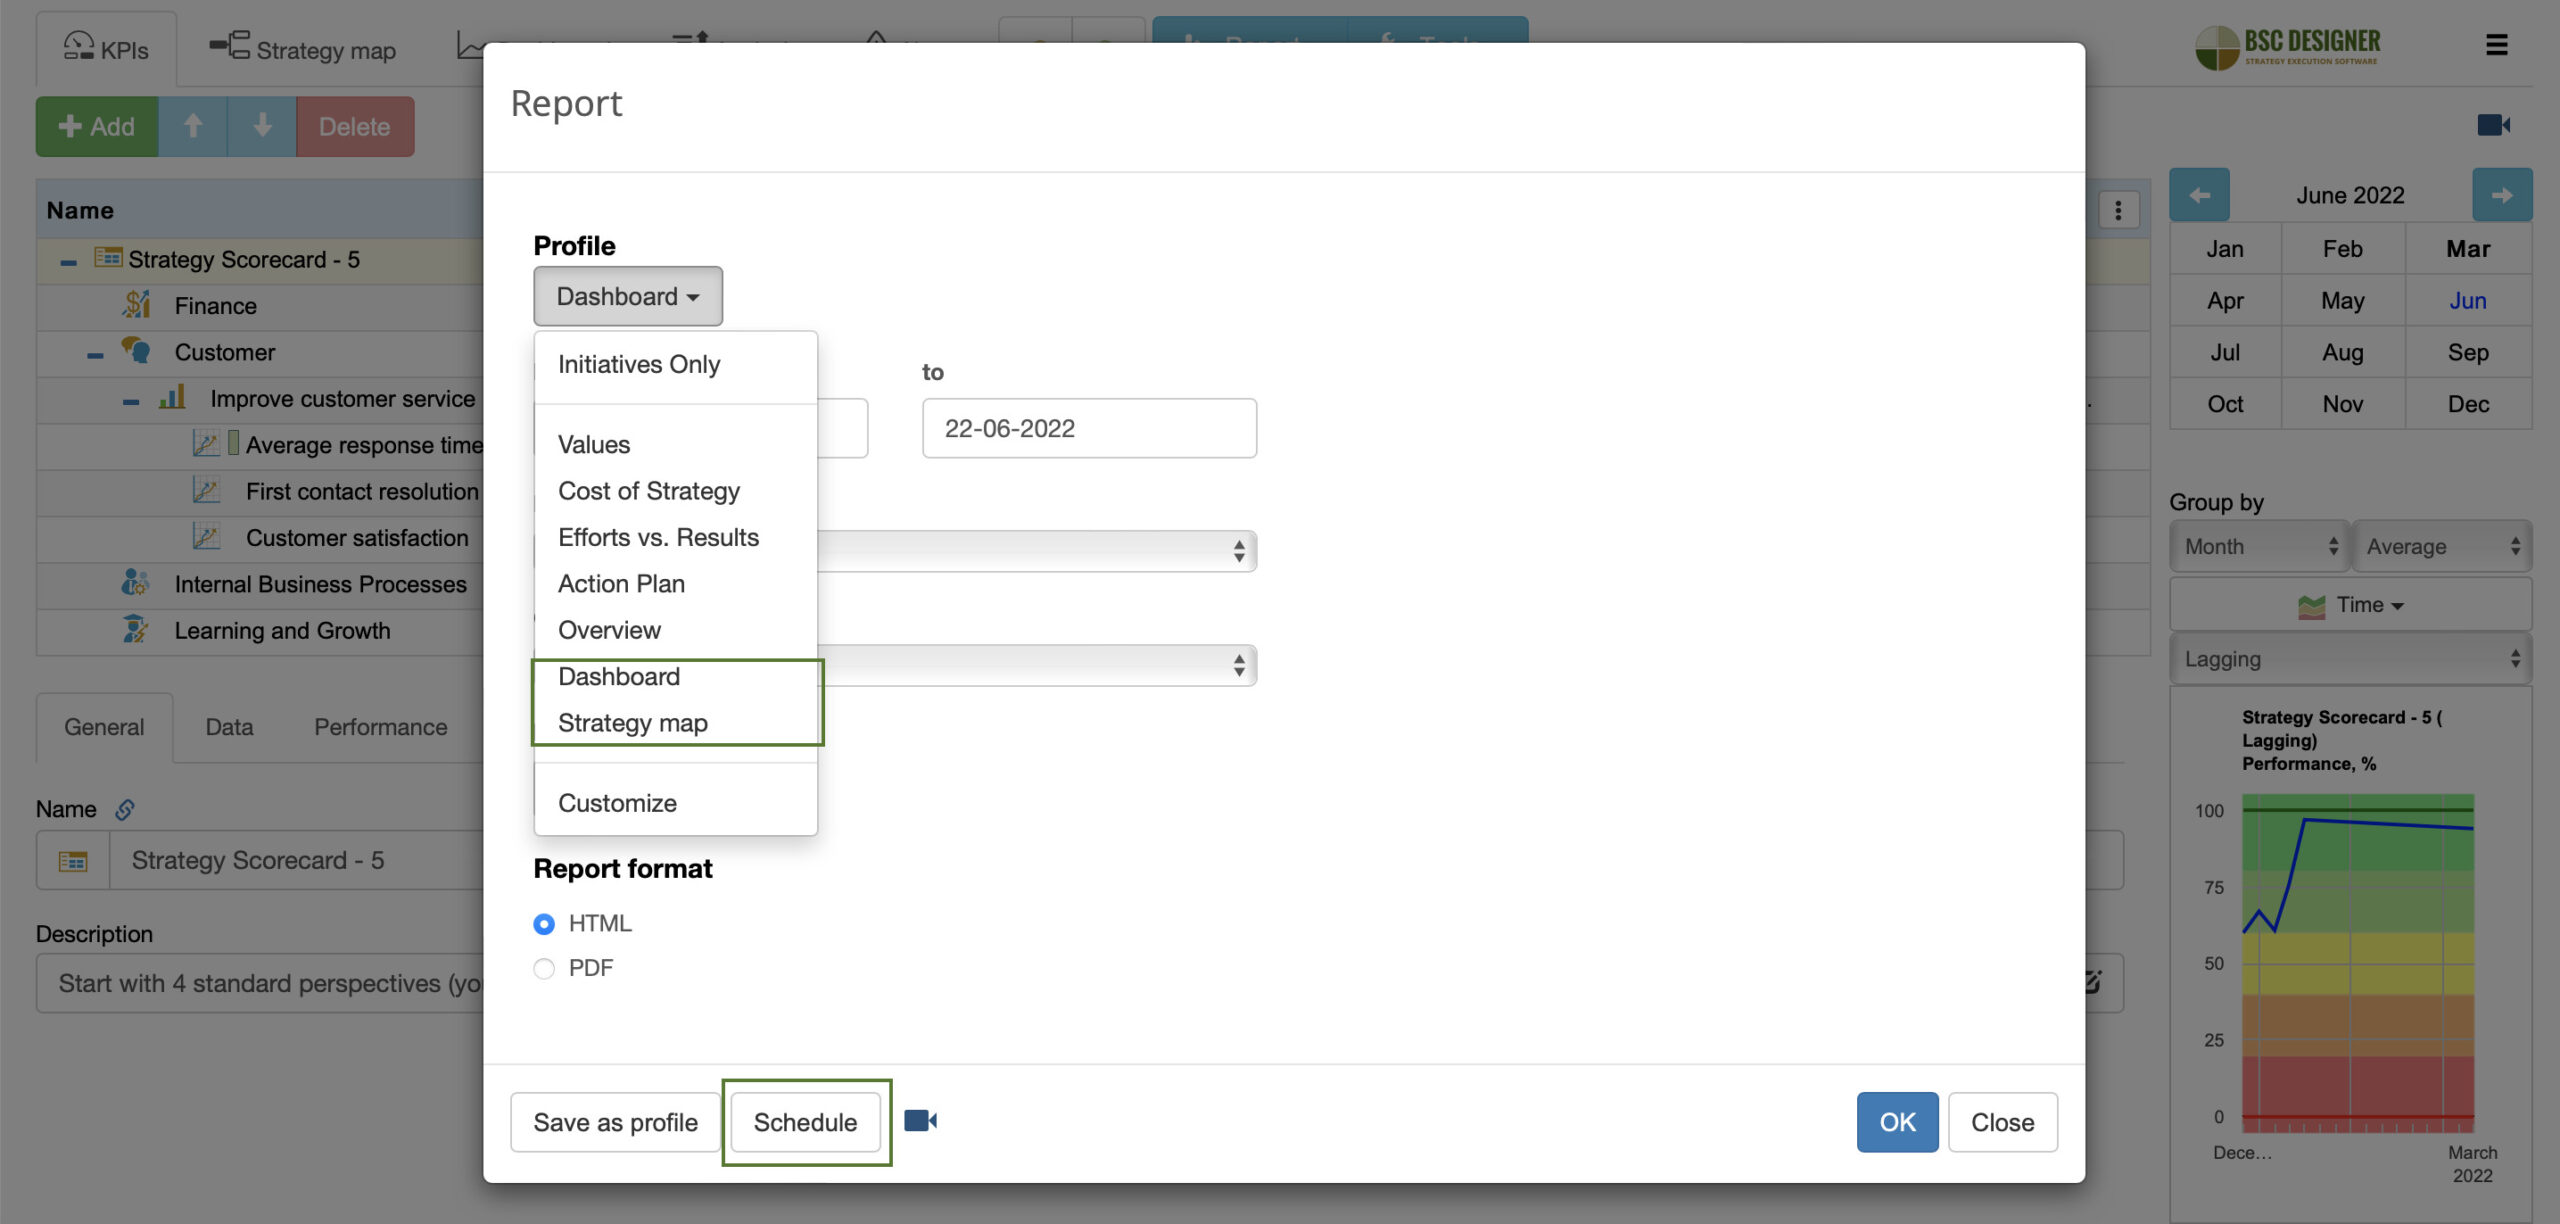
- Report profiles are now easier to manage:
May 2022 updates:
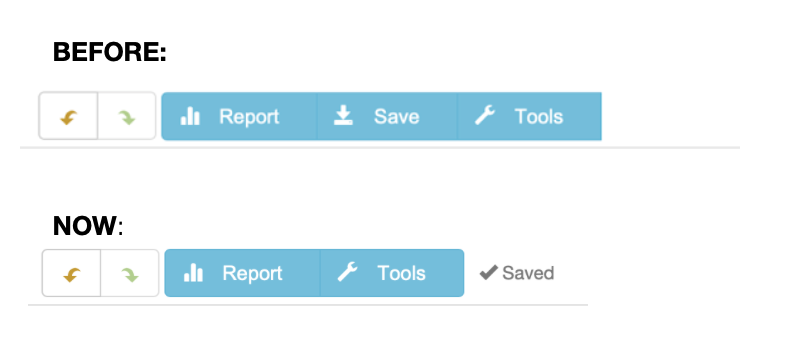
- “Save” button was removed – no need to click it all the time, now all the changes are saved and synchronized automatically.
- The “Save to my account as…” fature was moved to the Tools menu
- The “Download .BSC” features was moved to the Tools > Export data > Export as BSC (XML) file
March 2022 updates:
- Risk Mitigation Initiatives and Risk Indicators in BSC Designer:
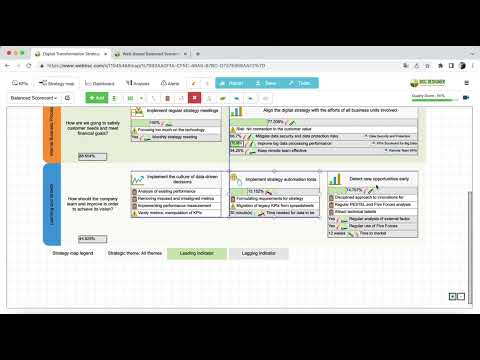
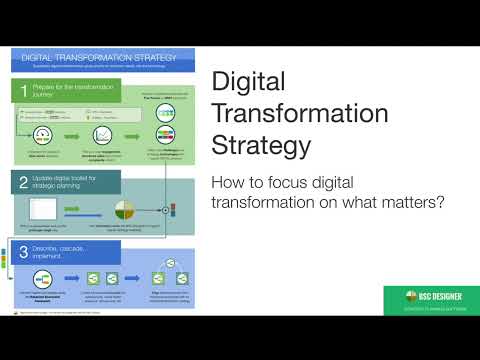
- 3 Steps to Build a Successful Digital Transformation Strategy:
February 2022 updates:
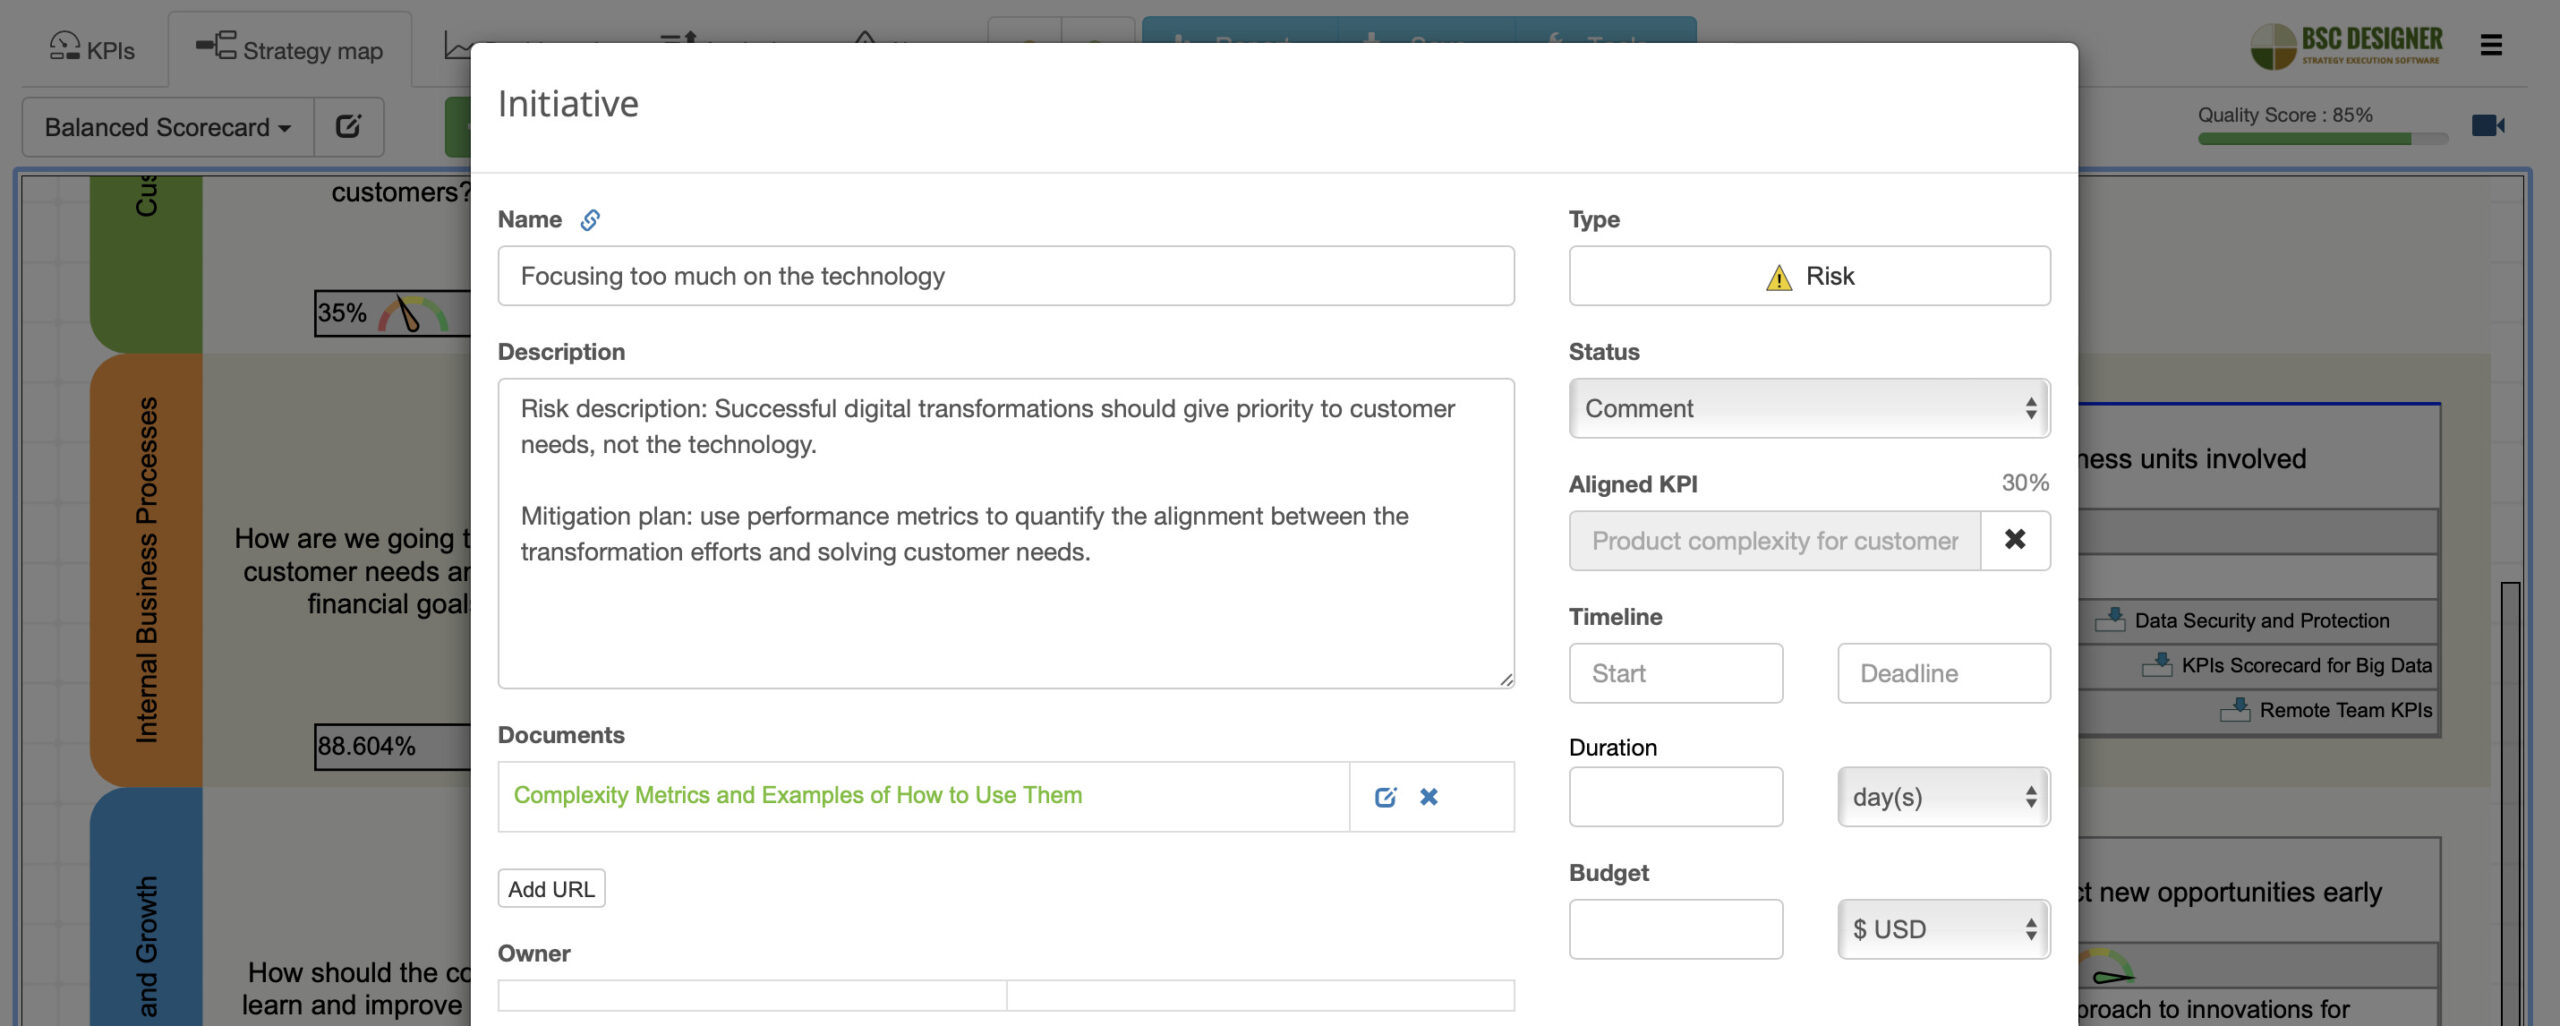
- “Risk” type of initiative record added. It’s now easier to map the risks to the business goals:
January 2022 updates:
- Dashboard report added. Dashboard report can be generated via interface or scheduled to be sent regularly as PDF attached to email
- Support of Hana SAP added for SQL indicators
- Users can now be grouped into the teams. A team can be assigned as an owner. Access rights can be granted to a team.
- All users team is added
- Gantt charts now support the time interval
- Source scorecard is now shown on the KPIs tab and strategy map for imported indicators
December 2021 updates:
- Linking two scorecards by copy and paste of the goals
- Send email to a special mailbox and get it converted into an initiative in BSC Designer.
![[Update] Capture ideas for your strategy from all members of your team by email](https://bscdesigner.com/wp-content/plugins/wp-youtube-lyte/lyteCache.php?origThumbUrl=https%3A%2F%2Fi.ytimg.com%2Fvi%2F8kPwn3JadyY%2F0.jpg)
- Webhooks can now be owners, e.g. receive notifications
- Links to the documents in the initiative dialog can now have titles
- New charts on the dashboard are positioned automatically
November 2021 updates:
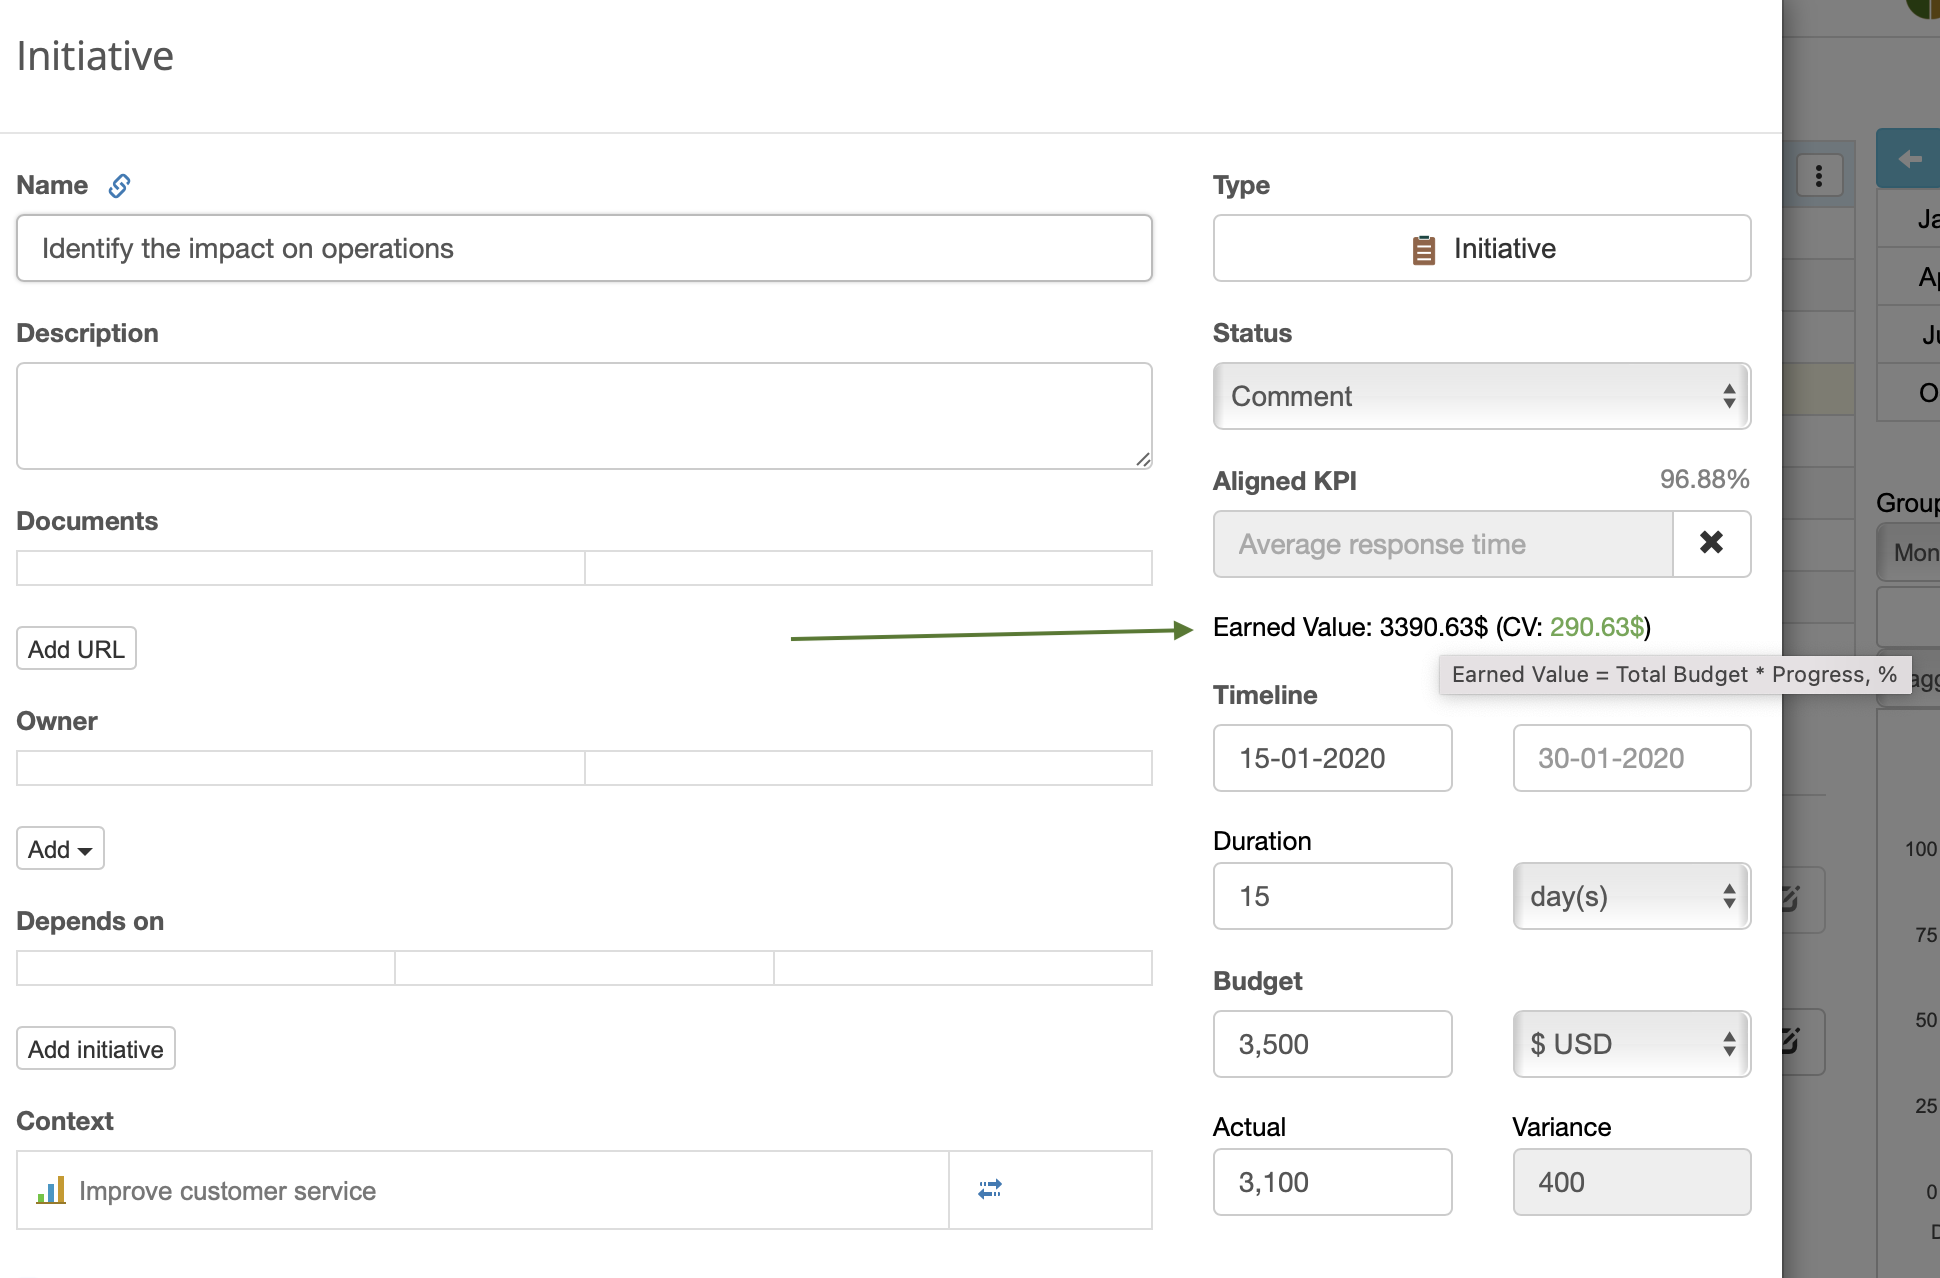
- Earned value can be calculated for the initiatives (progress KPI and total budget need to be specified):
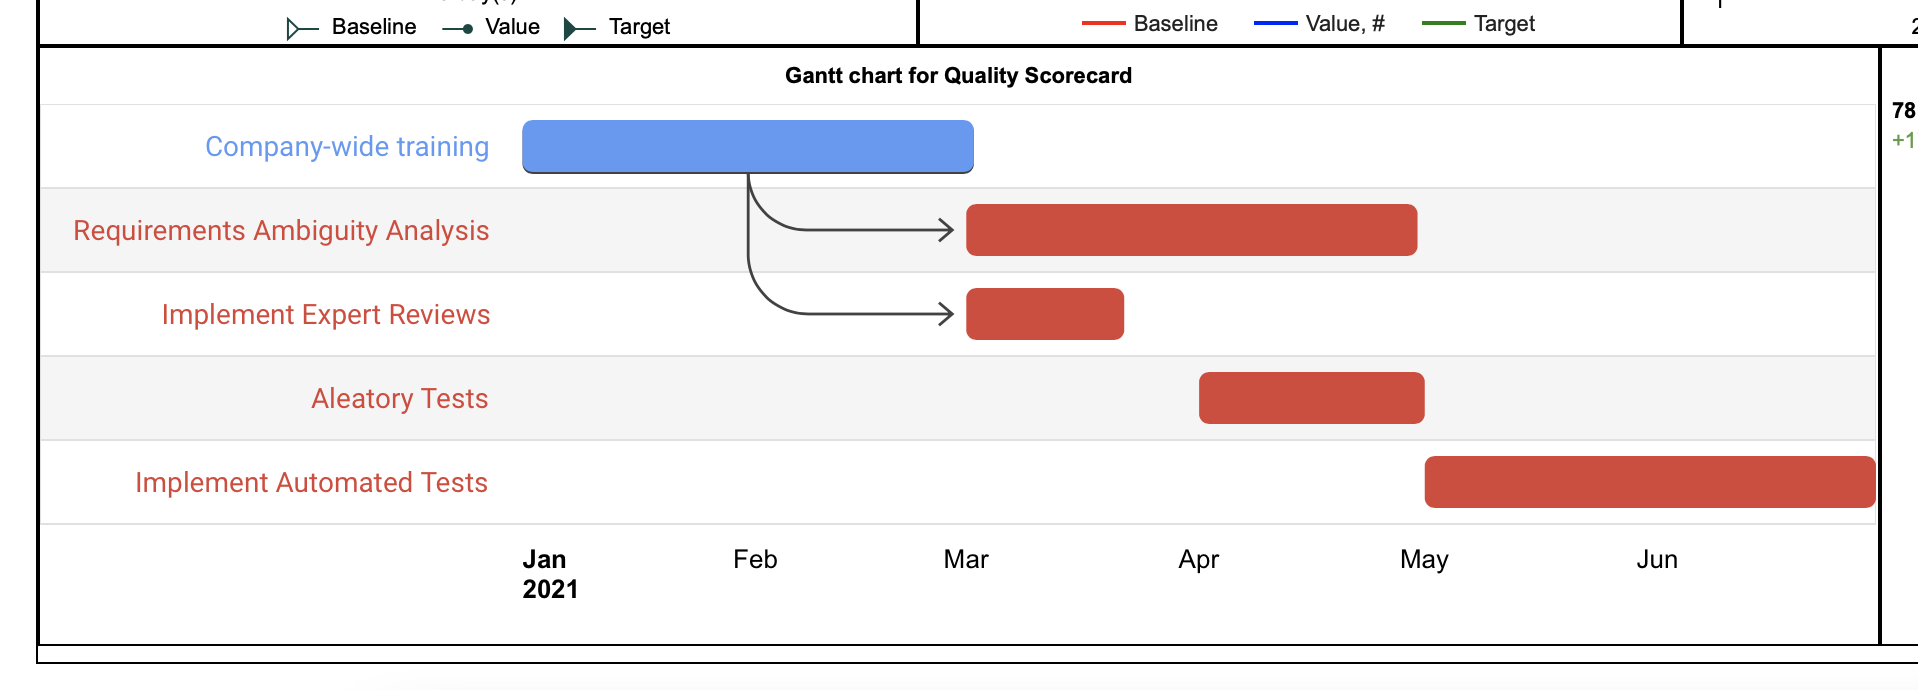
- Gantt charts for the initiatives. The initiatives of the scorecard can be now presented on the Gantt chart. The required properties of the initiative in this case are start date and deadline. The aligned KPI will show the progress of the item on the gantt chart.
- Adaptive weight for the items. If weight is not entered specifically, the available weight will be divided between items equally taking into account specifically entered weights.
- Depends on property was added to the initiatives
Octubre 2021 updates:
- Filters applied to the reports can now be saved as a report profile
- An example of using BSC Designer for a strategy meetings of distributed team
- Import from Excel now supports multi-level structures like Perspective -> Strategic Goal -> Tactical Goal -> KPI
- Switched to versionised resource files – avoid problems with slow project loading after software was updated
- Audit trail log can be exported to CSV now
September 2021 updates:
- Columns “Absolute weight” and “Performance Formula” are now supported in KPI tree, reports, and export.
- It’s not possible to pick custom data rages in reports, like “last month” or “last 30 days” as an alternative to specifying report dates.
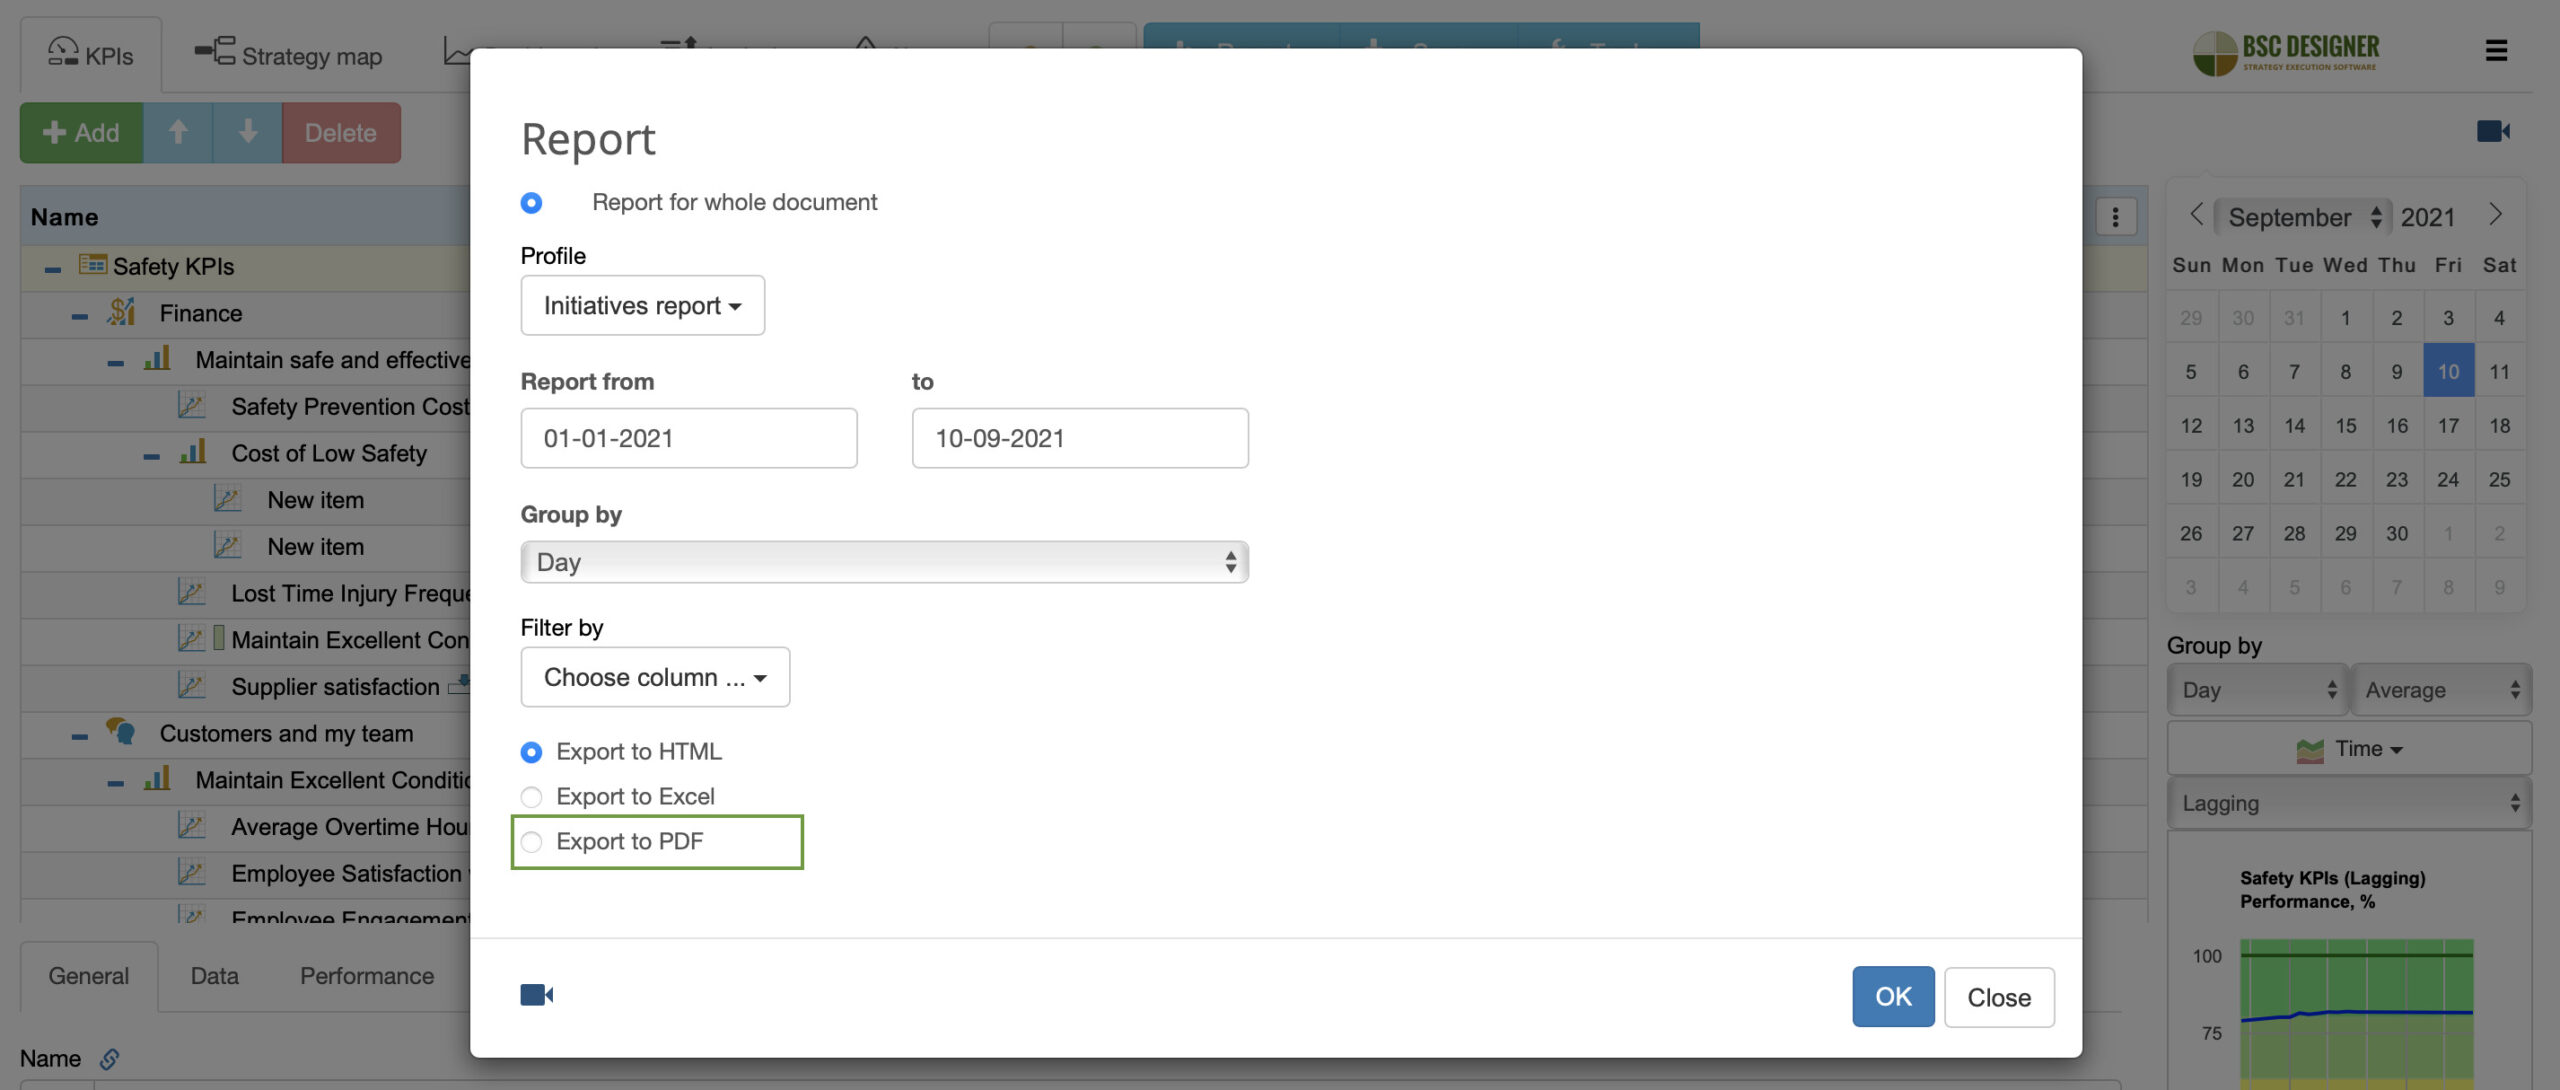
- BSC Designer can now generate reports in PDF format in addition to HTML and Excel. PDF format is optimised for paper size documents, so if you find that some columns don’t fit, you have two options – limit the report period to include less data and/or use report profiles to update columns to be used on report.
- Font size for BSC Designer – Arabic was increase for a better user experience
August 2021 updates:
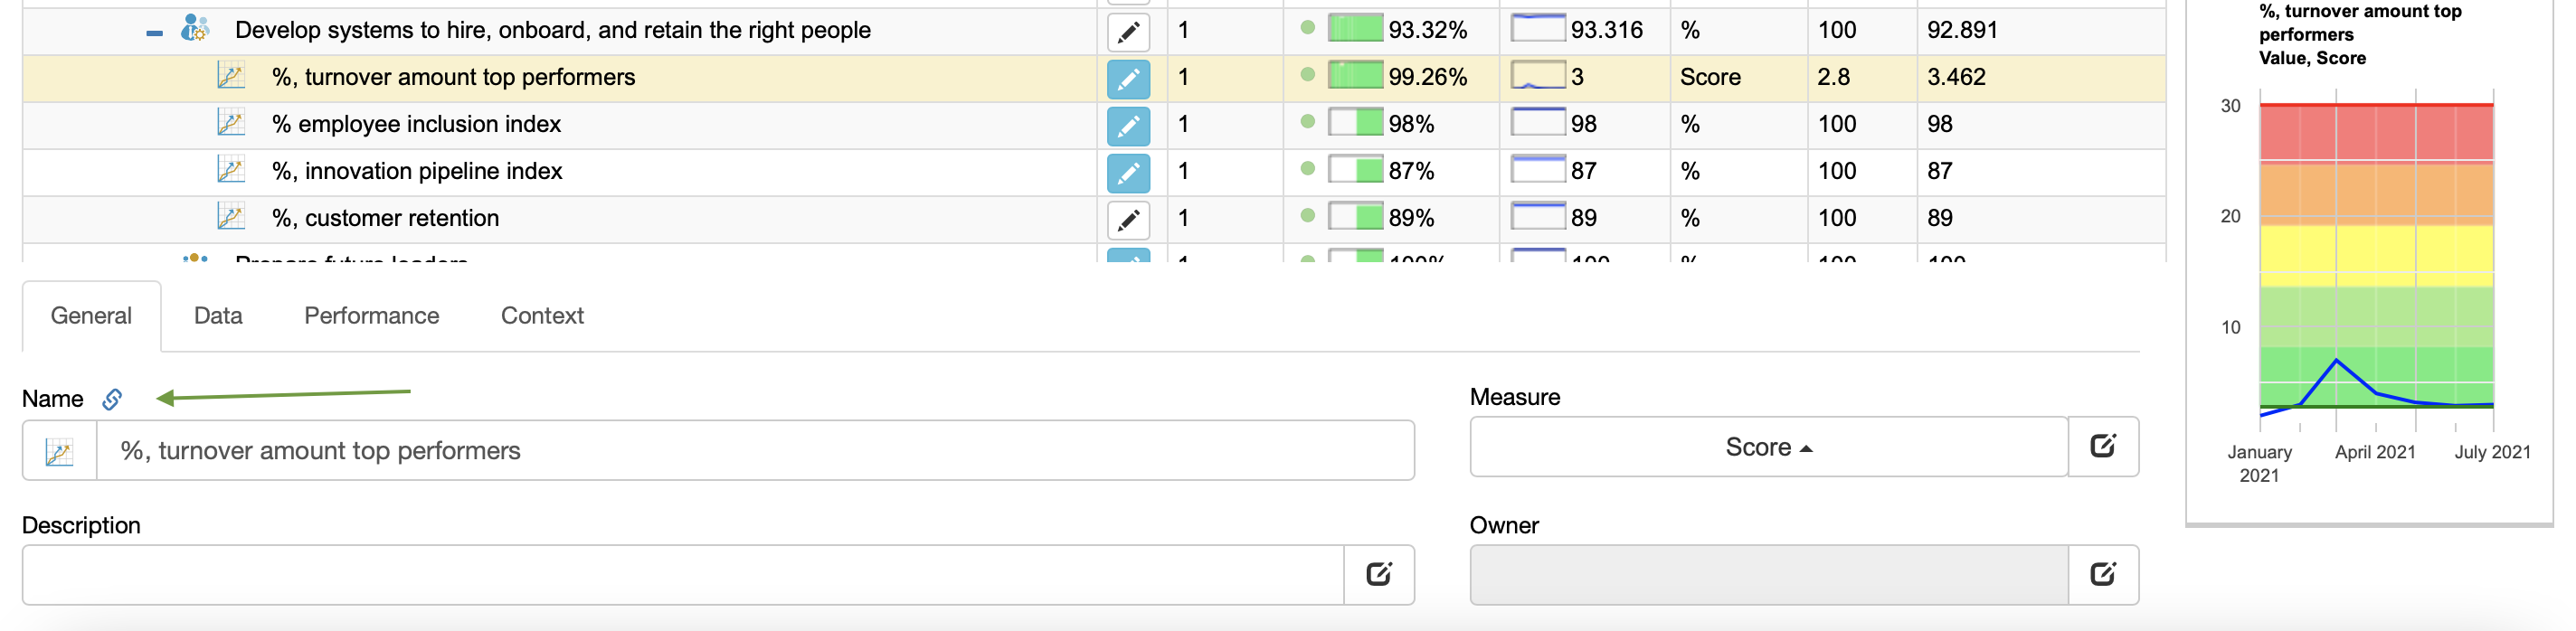
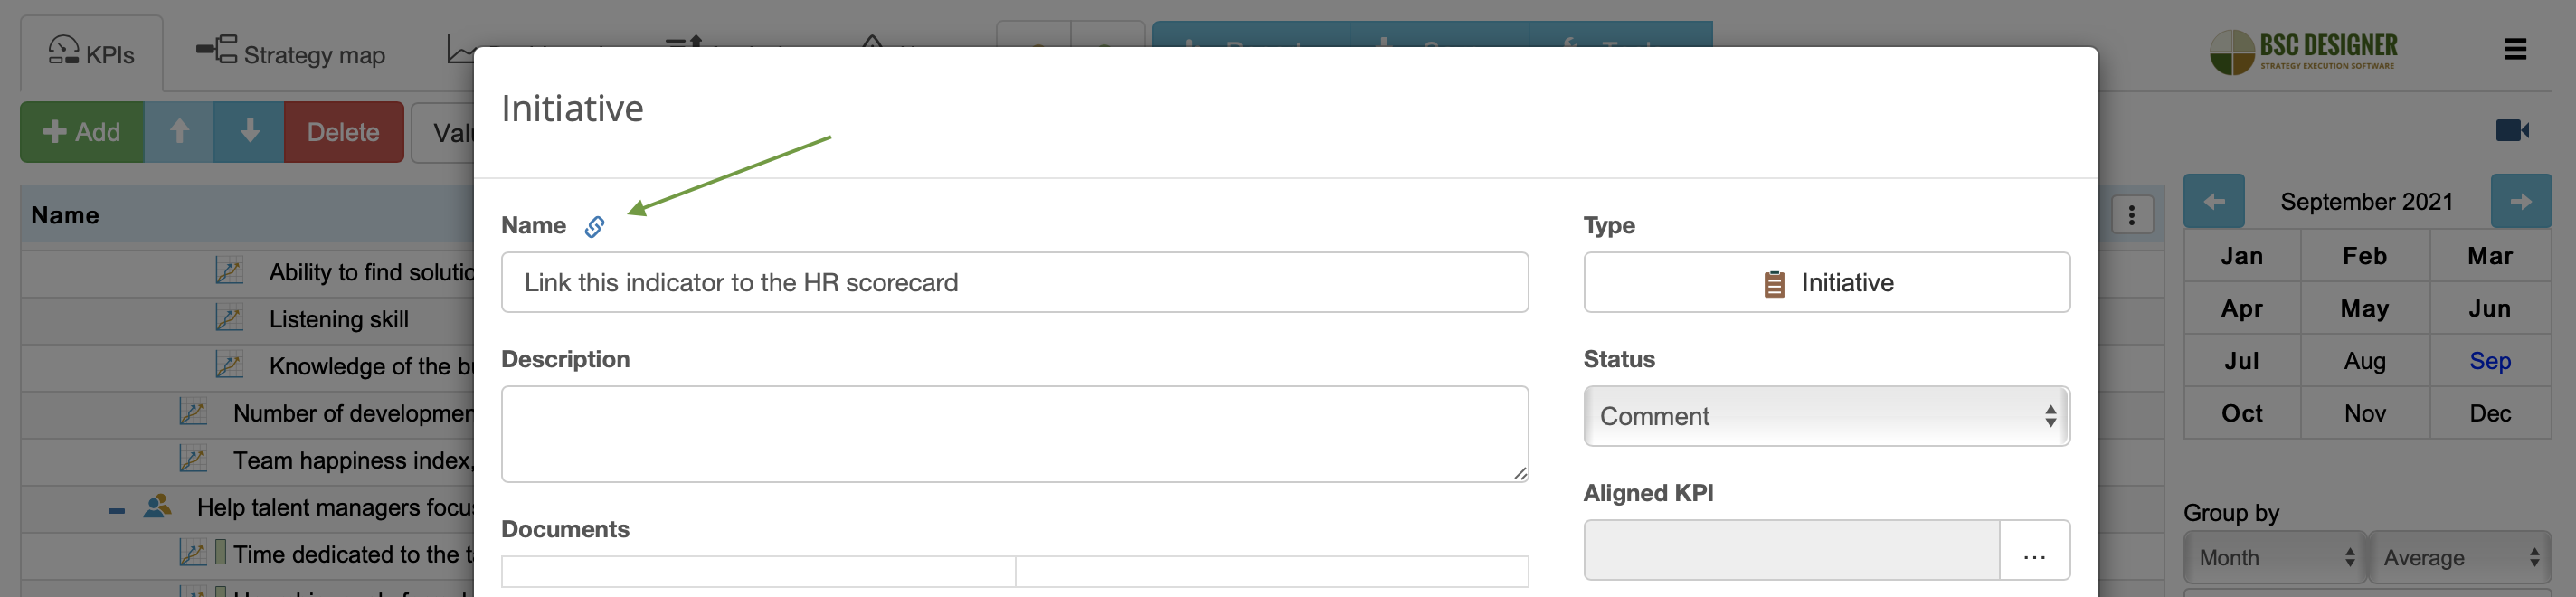
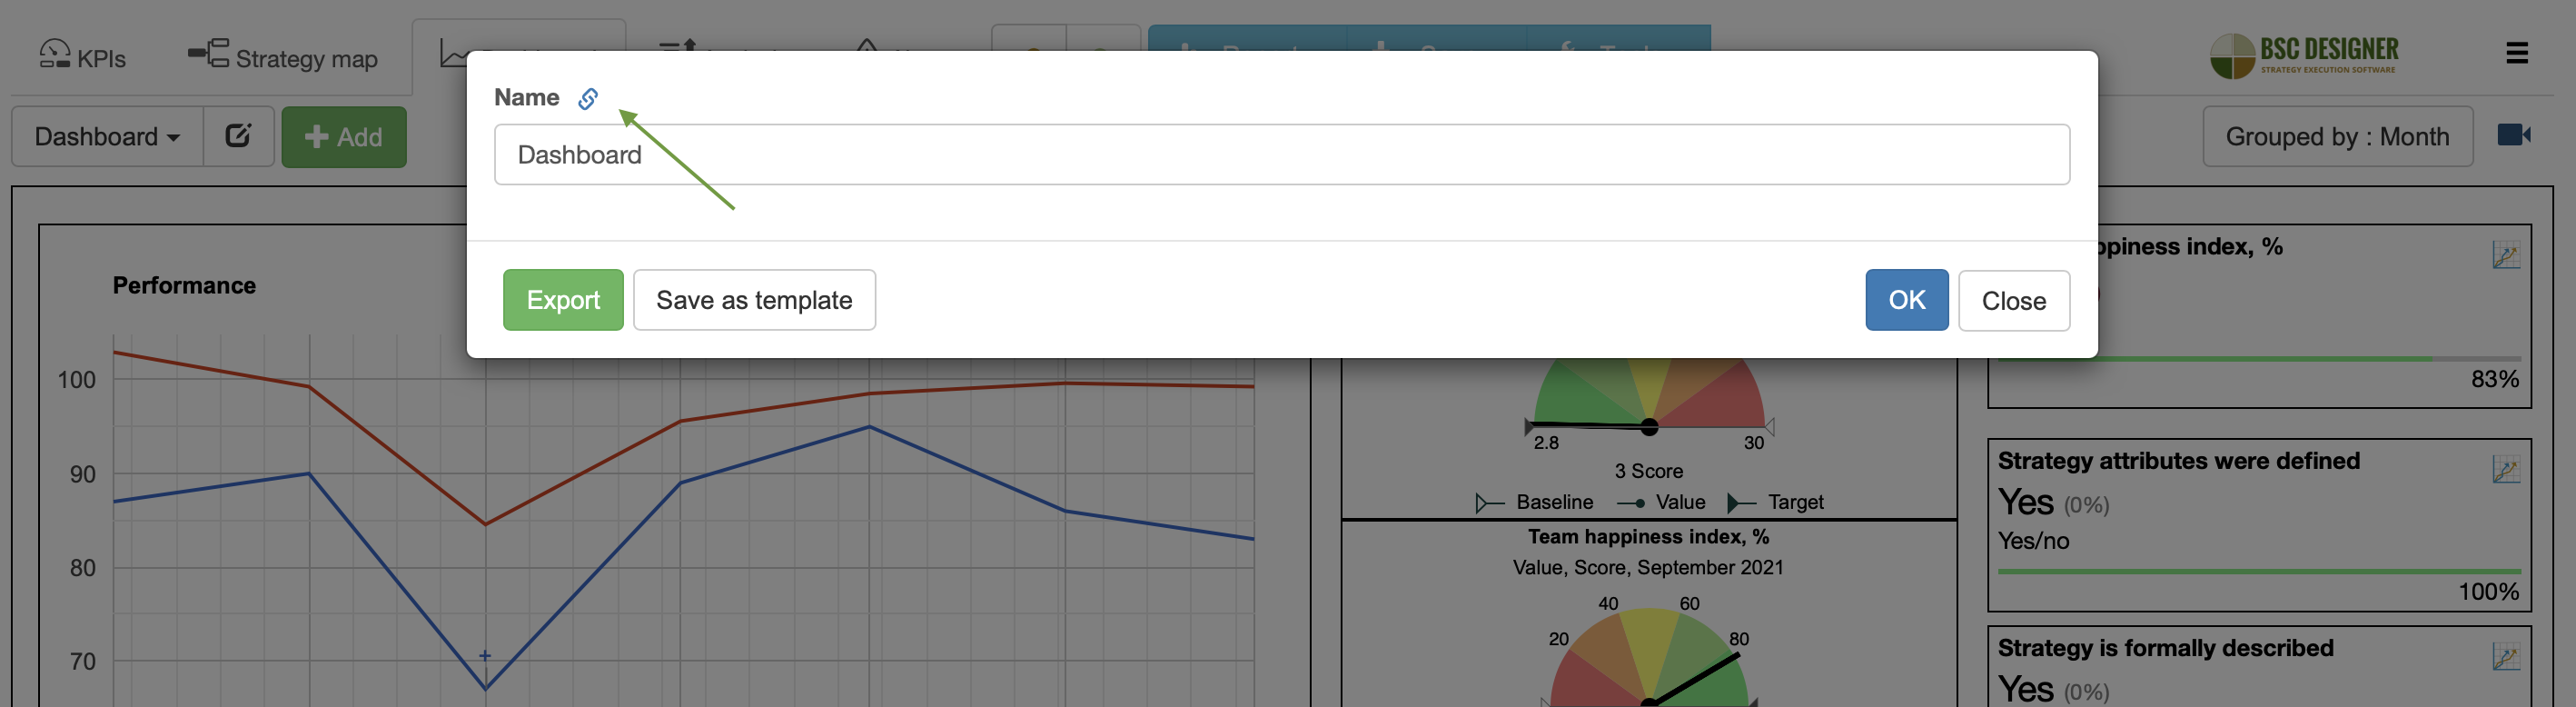
- Direct links to the KPIs, initiatives, dashboards, strategy maps. Simply click on the Link button next to the name field to get the direct link copied in clipboard:
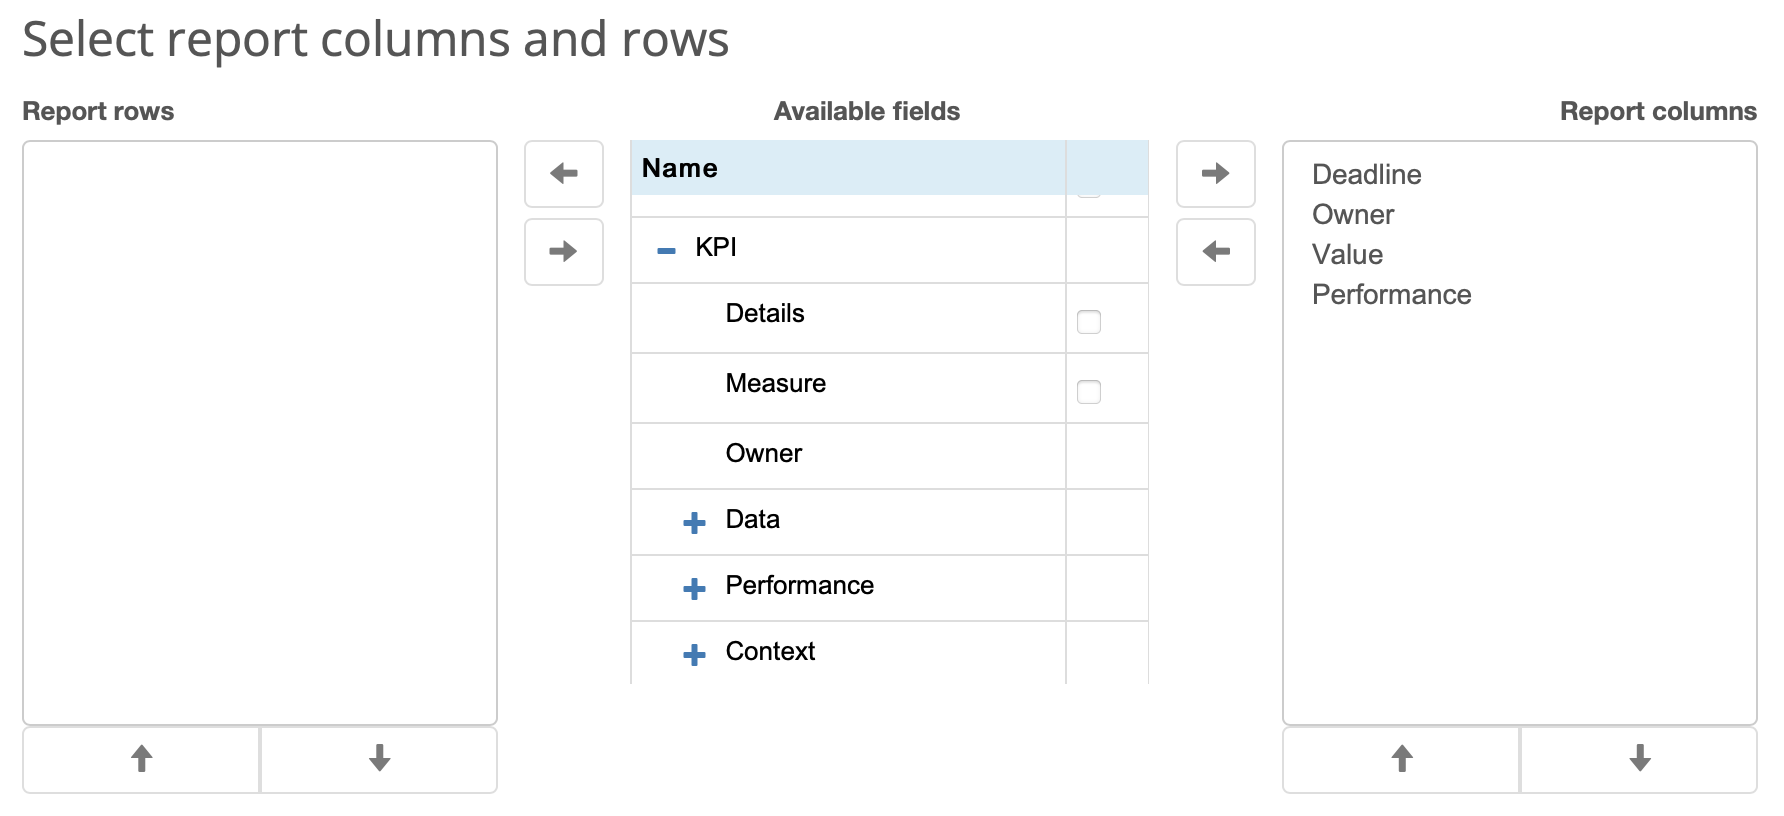
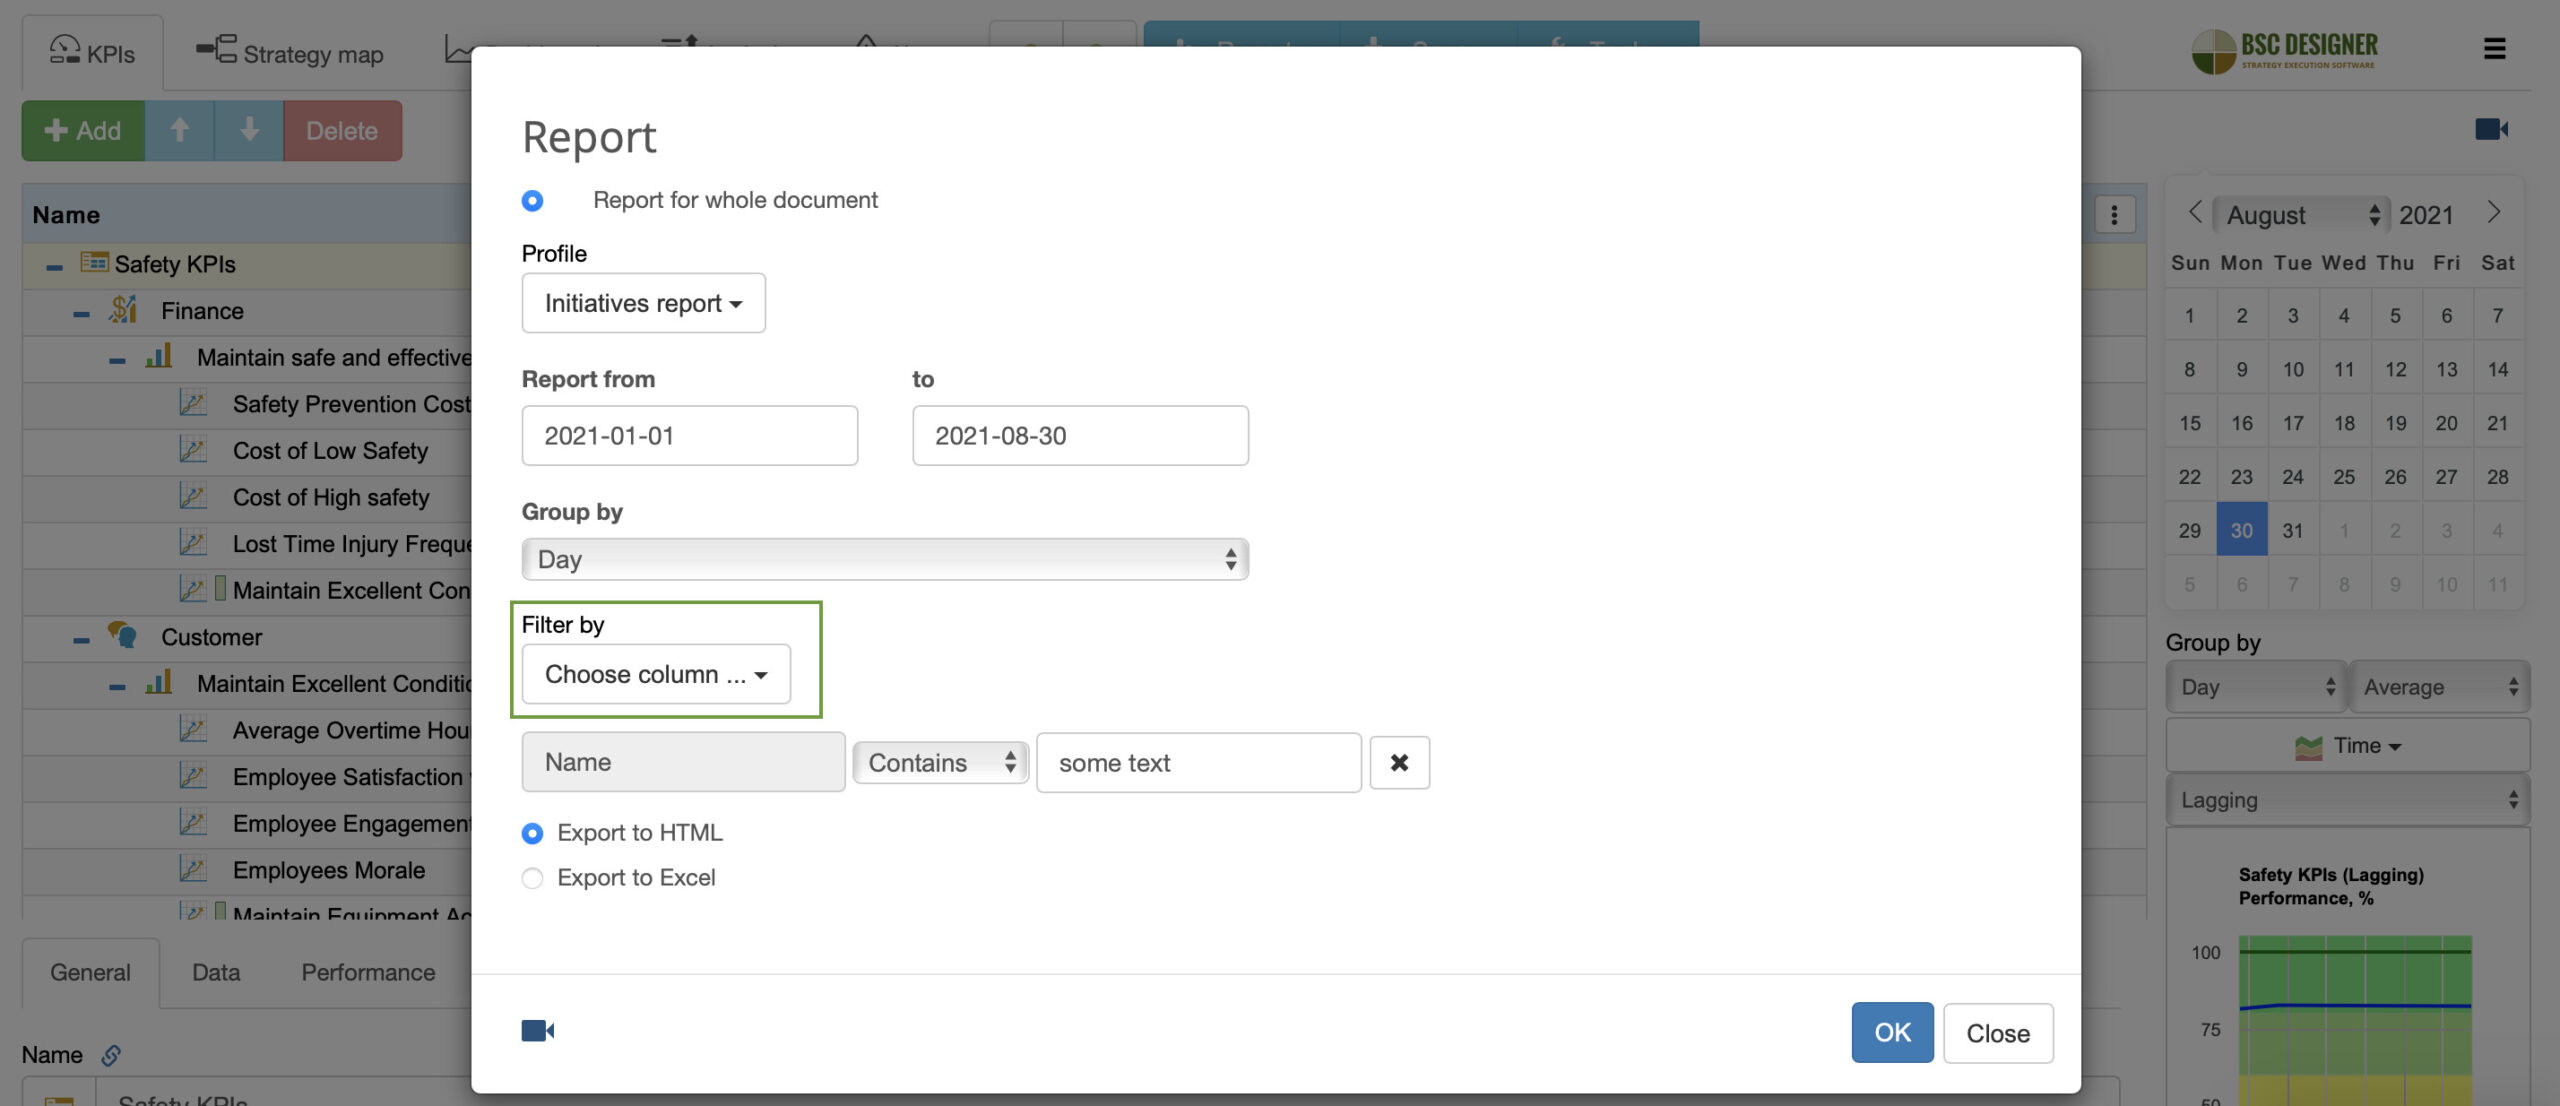
- Custom filters for the reports. Any columns that a report profile includes can be filtered:
- More filters for the reports: create reports for perspectives only
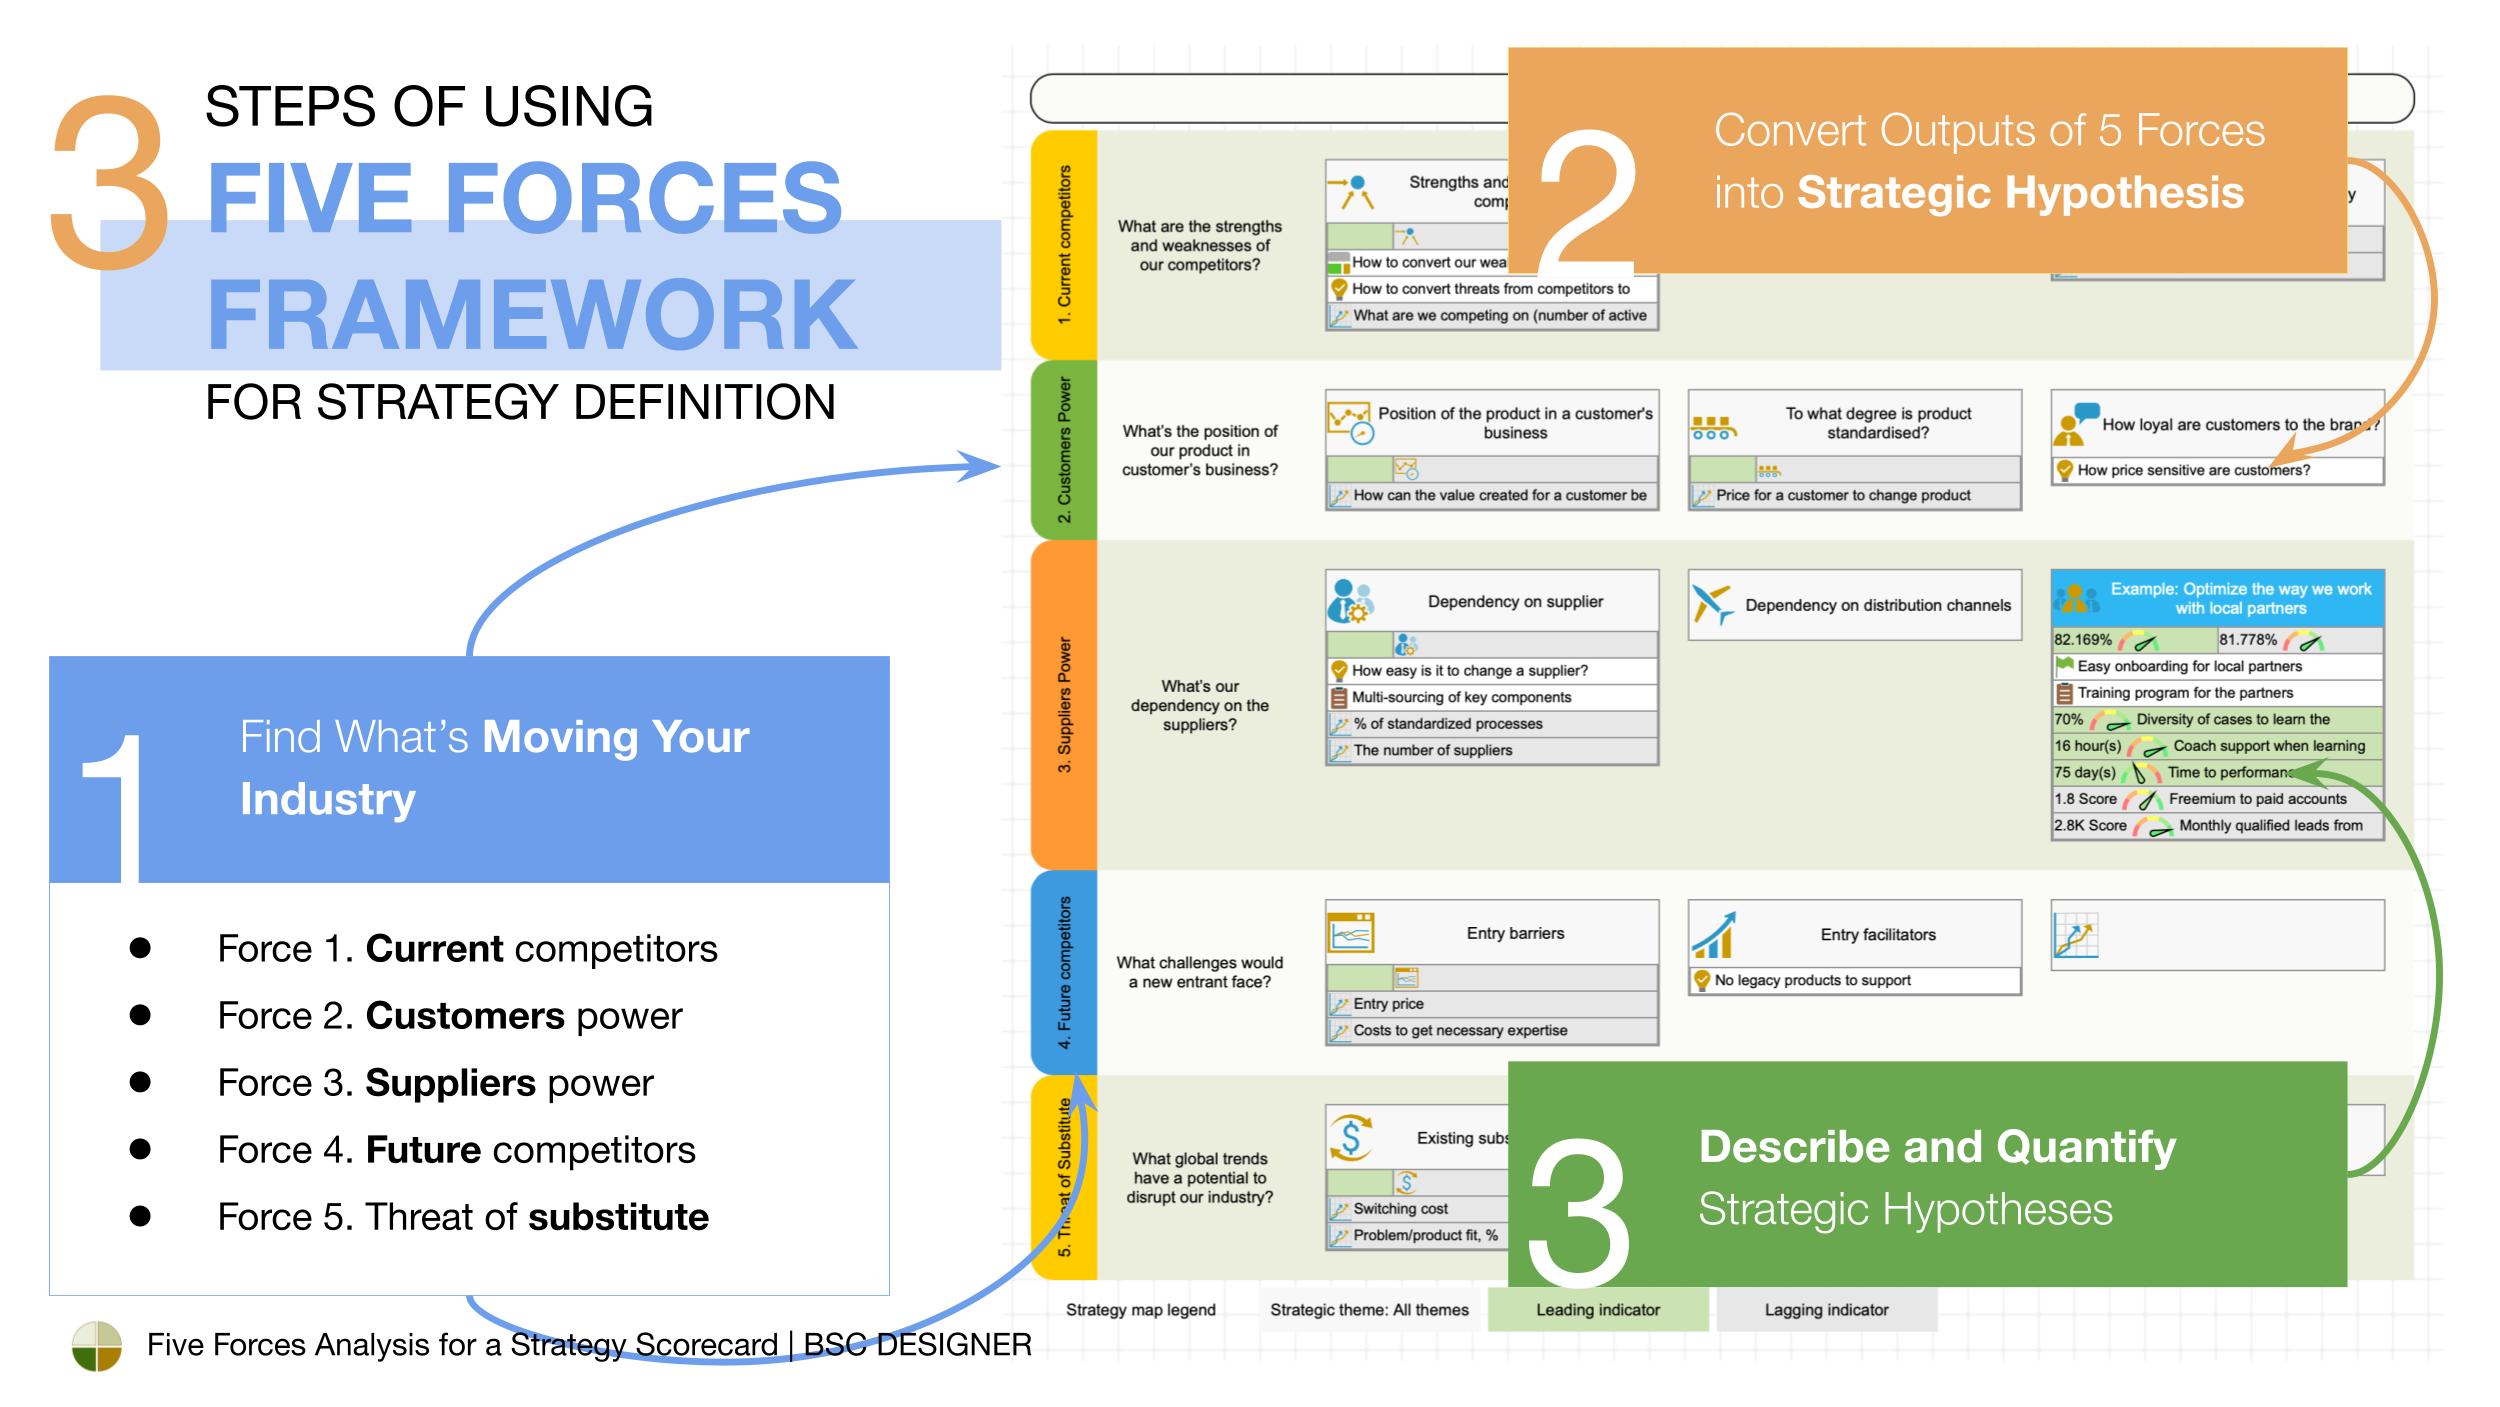
- Porter’s Five Forces template added to the free templates
- Better support of right-to-left for Arabic version of BSC Designer
July 2021 updates:
Custom fields in BSC Designer Online:
- Users can now add custom fields (like tags, risk, etc.) to their KPIs/goals
- To configure custom fields go to the go to Settings > Workflow tab
- Once configured, to enter data into the custom fields, users can click on the “Edit” button next to the description field:
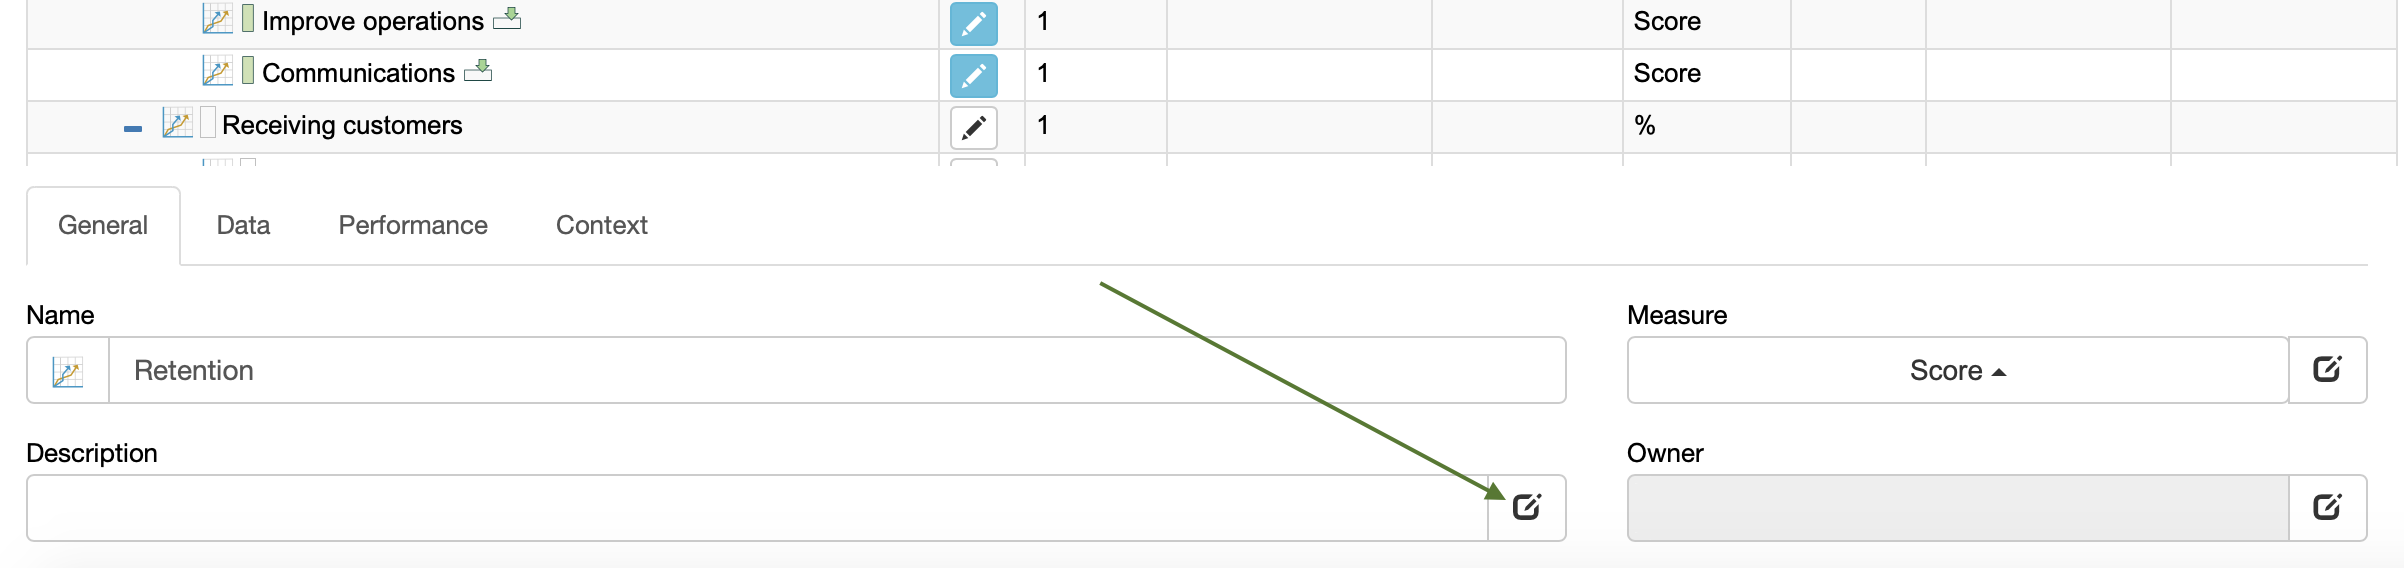
- Custom fields are available for import/export, as a culumn in reports, as a column for KPI tree
PRO replaced with BSC Designer Online
Following the growing demand for SaaS version and almost no demand for Windows desktop version, BSC Designer Online (cloud-based) completely replaced BSC Designer PRO for Windows:
- Owners of BSC Designer PRO permanent licenses and subscriptions can still use the existing version, basic support (e.g. license activation) will be provided.
- For free Balanced Scorecard software (ex. BSC Designer Light) users can now enjoy a Free Plan of BSC Designer Online
- For free viewer of .BSC scorecards (ex. BSC Designer Reader) users can now view their scorecards under Free Plan of BSC Designer Online
If for some reason you need to download older versions of BSC Designer, check the version archive here.
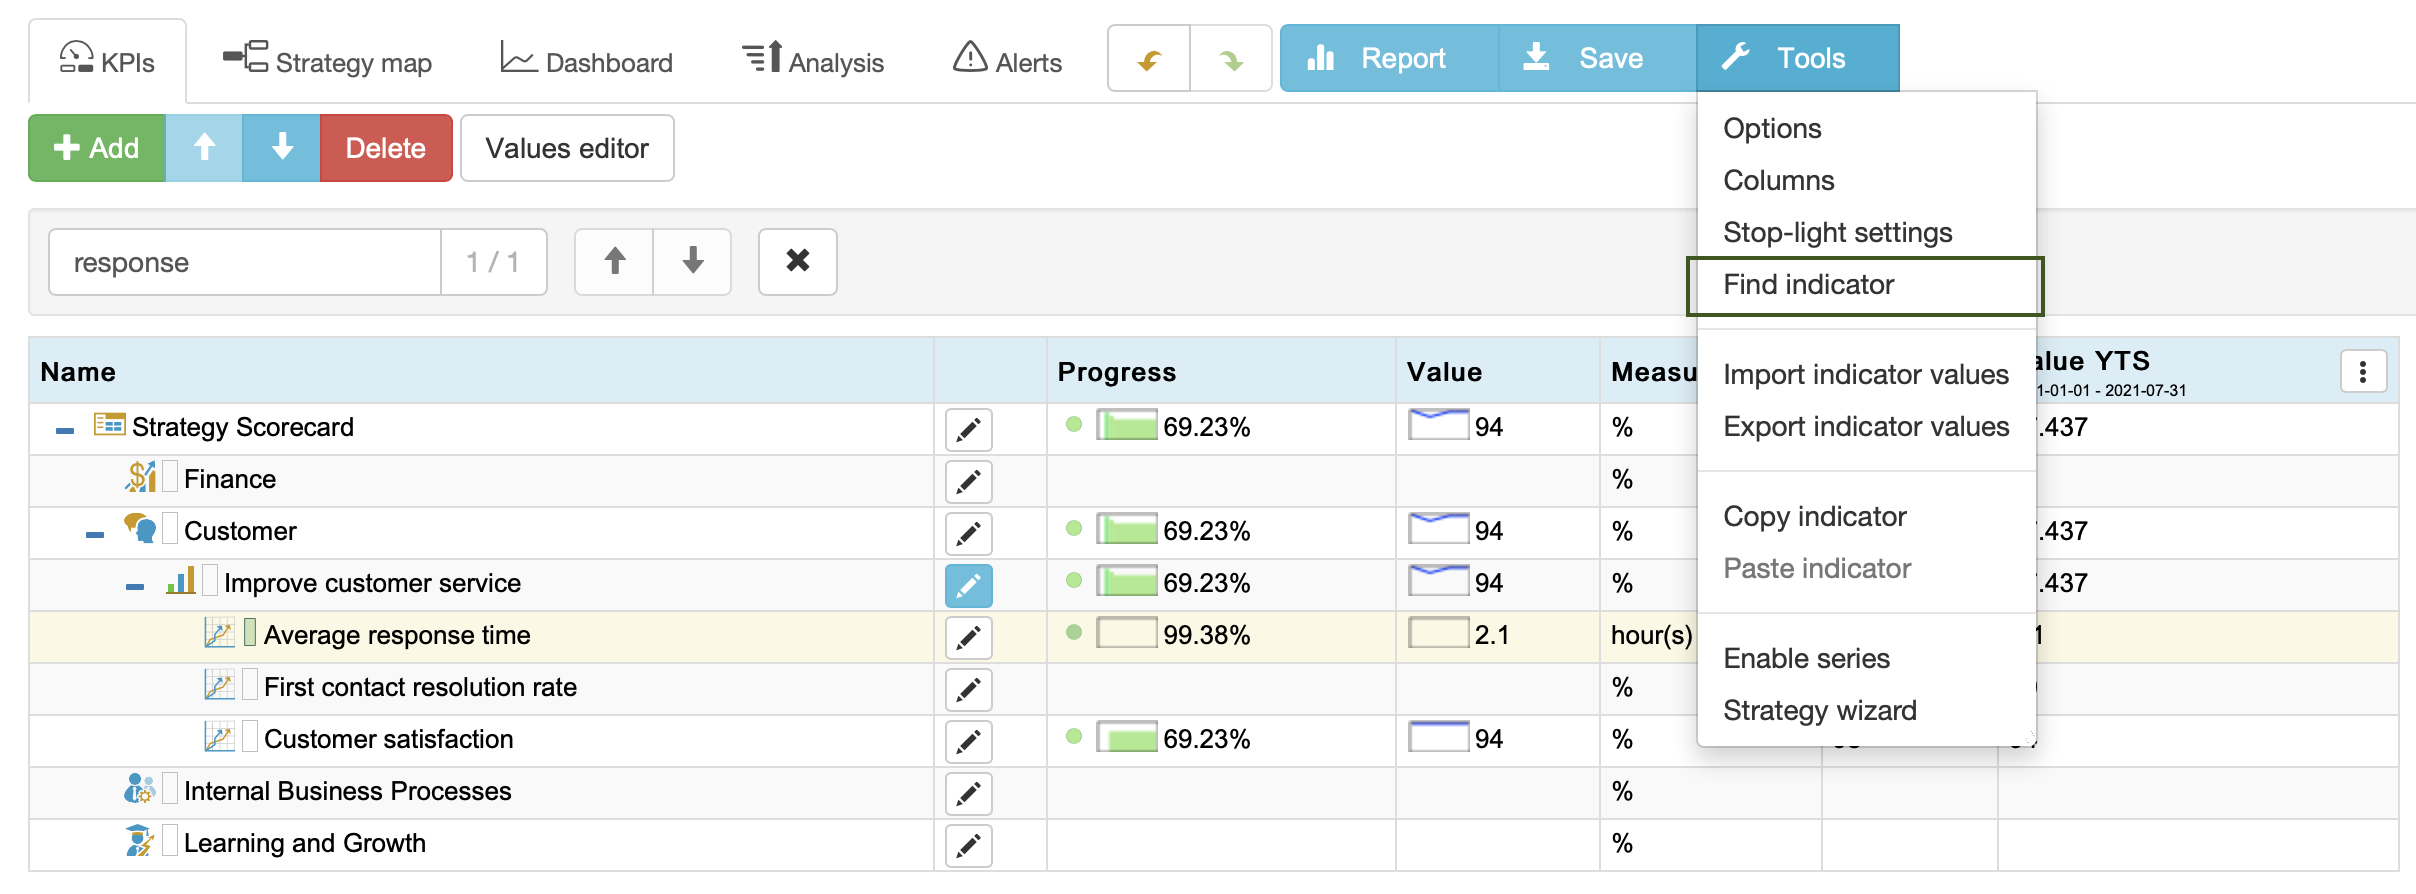
June 2021 updates:
- Search function for indicators added:
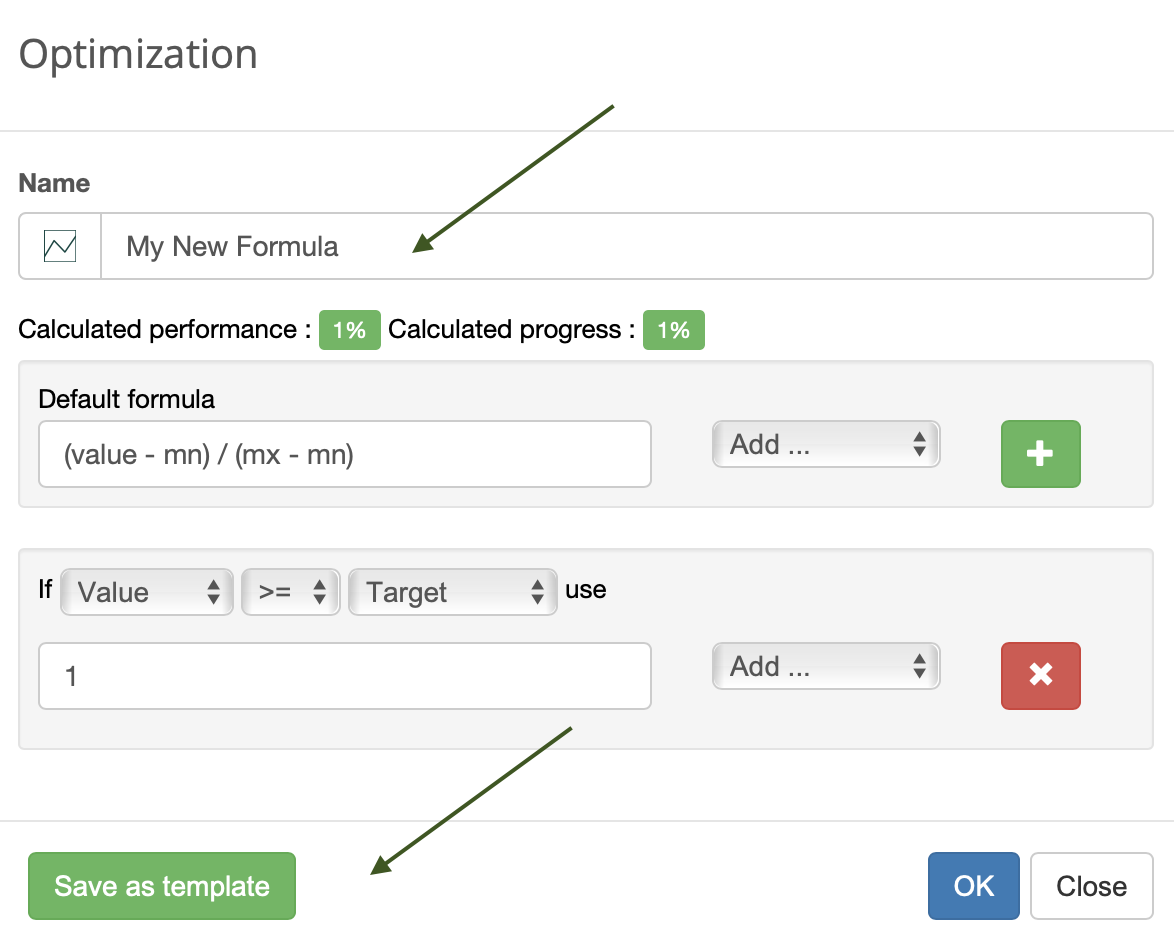
May 2021 updates:
- Save performance formula as a template so that other users in the account can use it:
- Grouping by weeks and days added to the charts
- Chart’s legend for xTS data improved
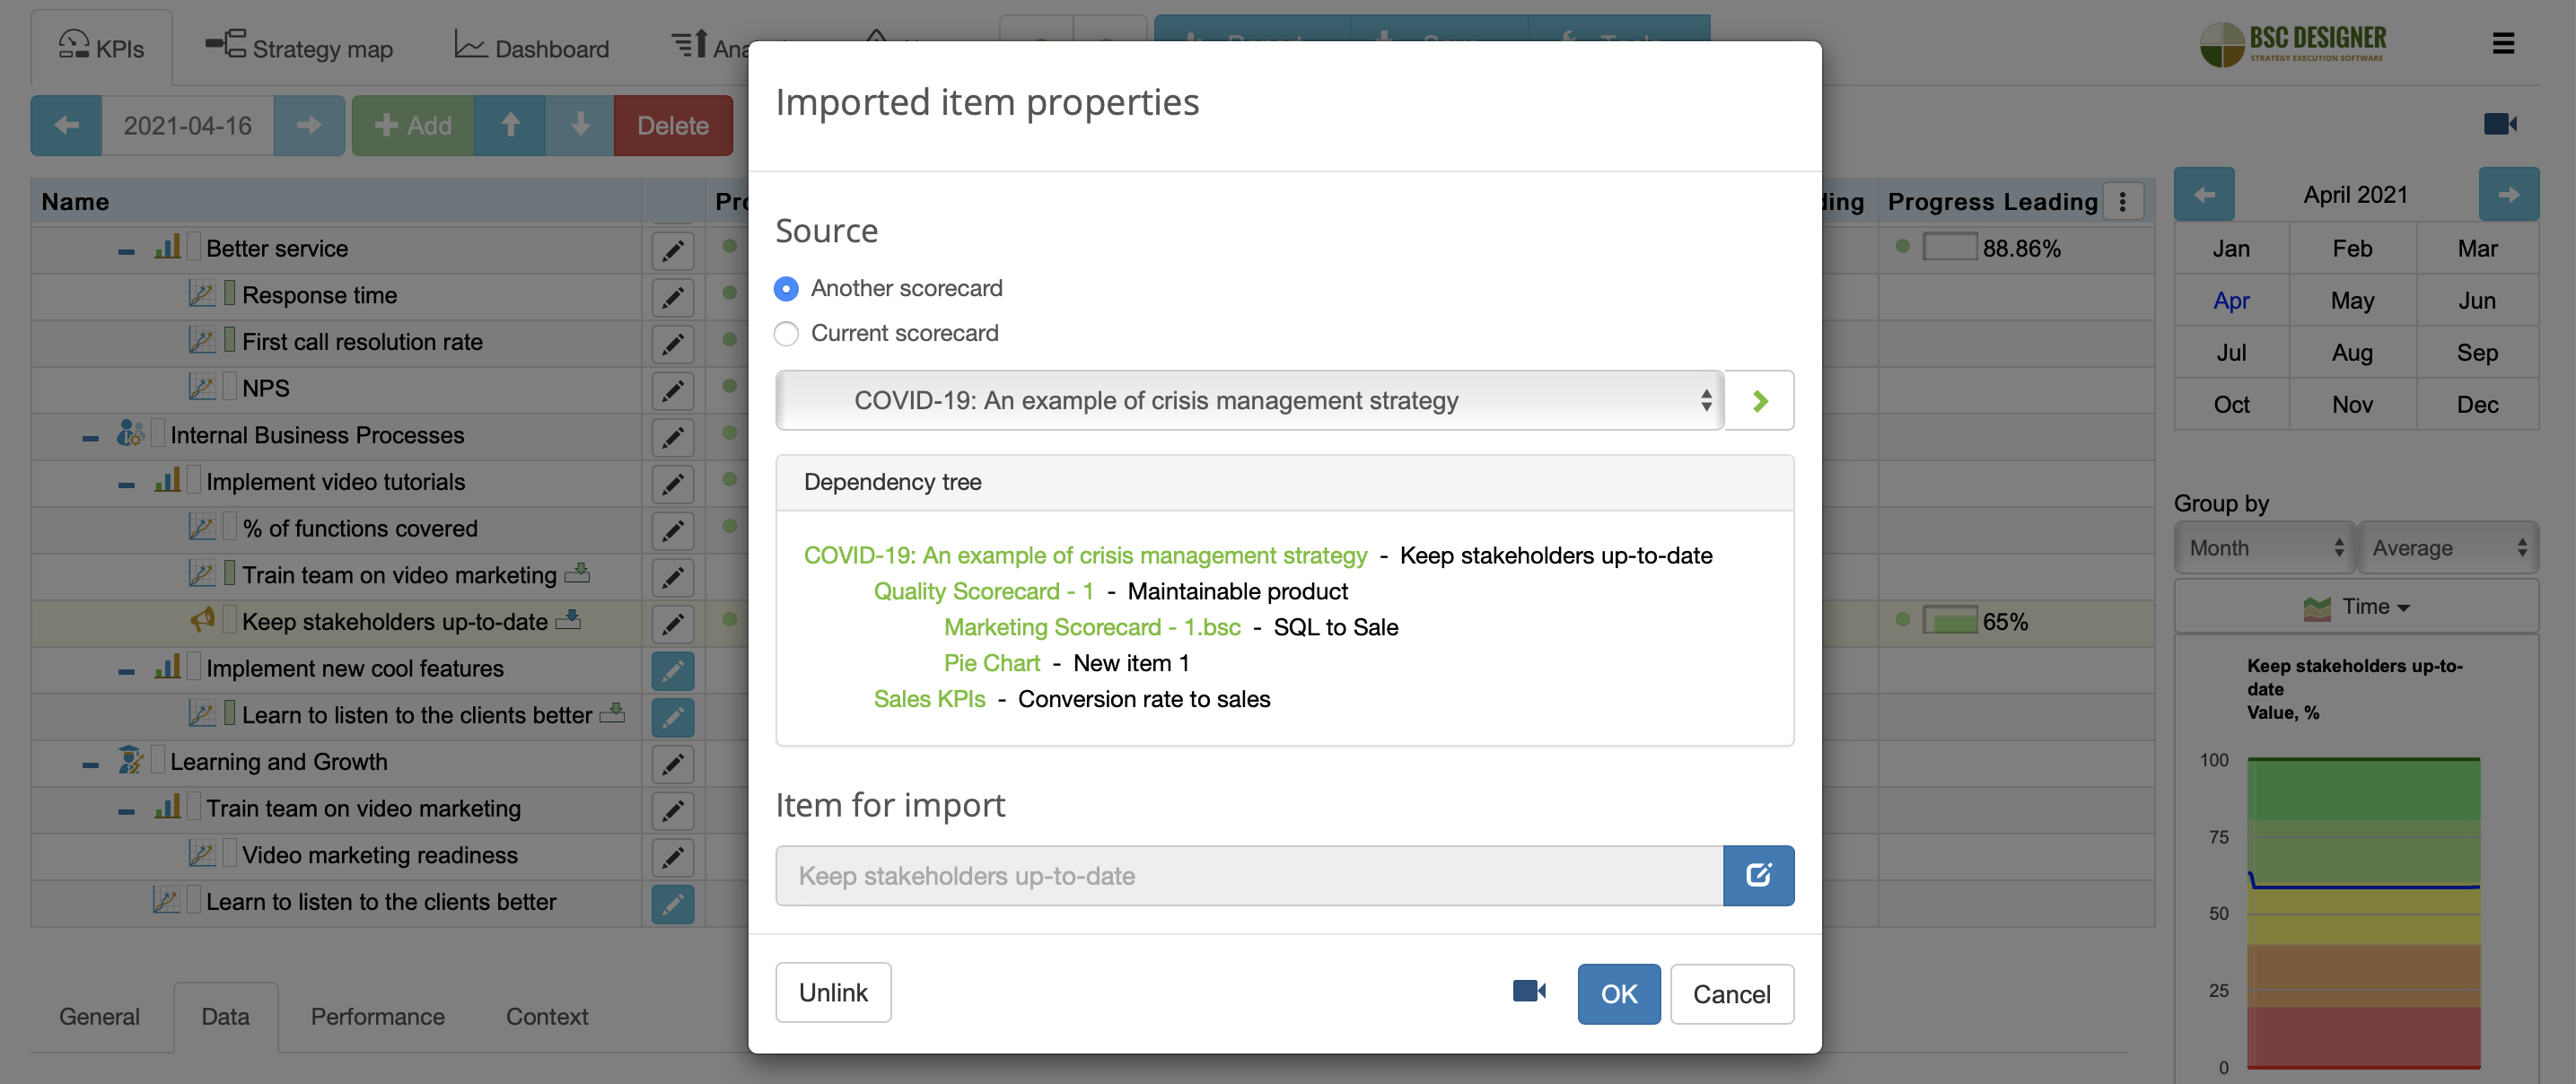
April 2021 updates:
- Dependency tree for the imported indicators
- Invoices inside webbsc.com (see Settings > Subscription > Invoices).
March 2021 updates:
- Widgets section added to the My Scorecards
- Count field is now available in report and for KPIs columns
- Unlink button for imported indicator to reset its state to default one
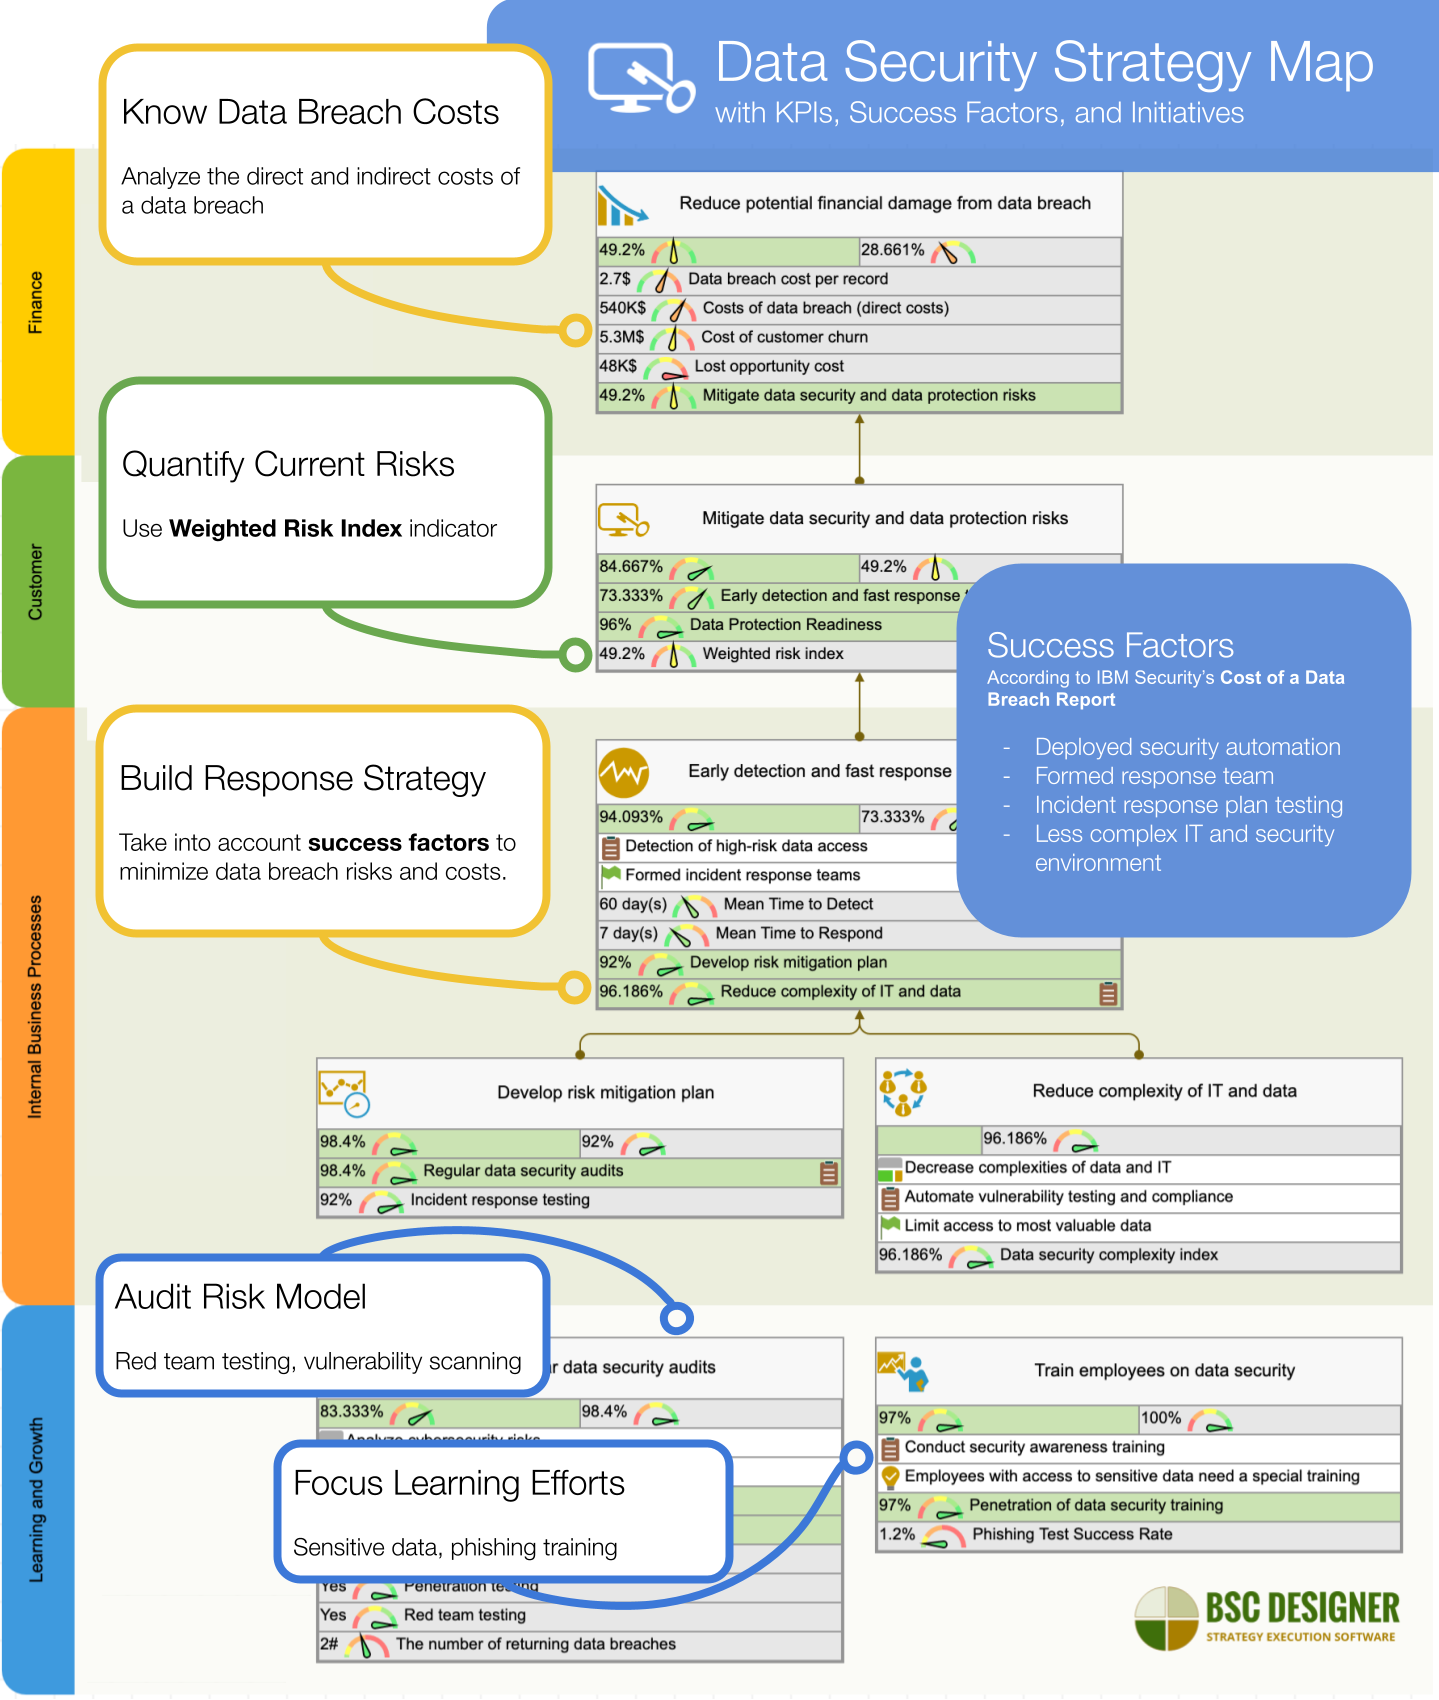
- Cybersecurity scorecard with example of KPIs added to the template available in BSC Designer Online:
February 2021 updates:
- KPI icons updated to the perfect vector format
![]()
January 2021 updates:
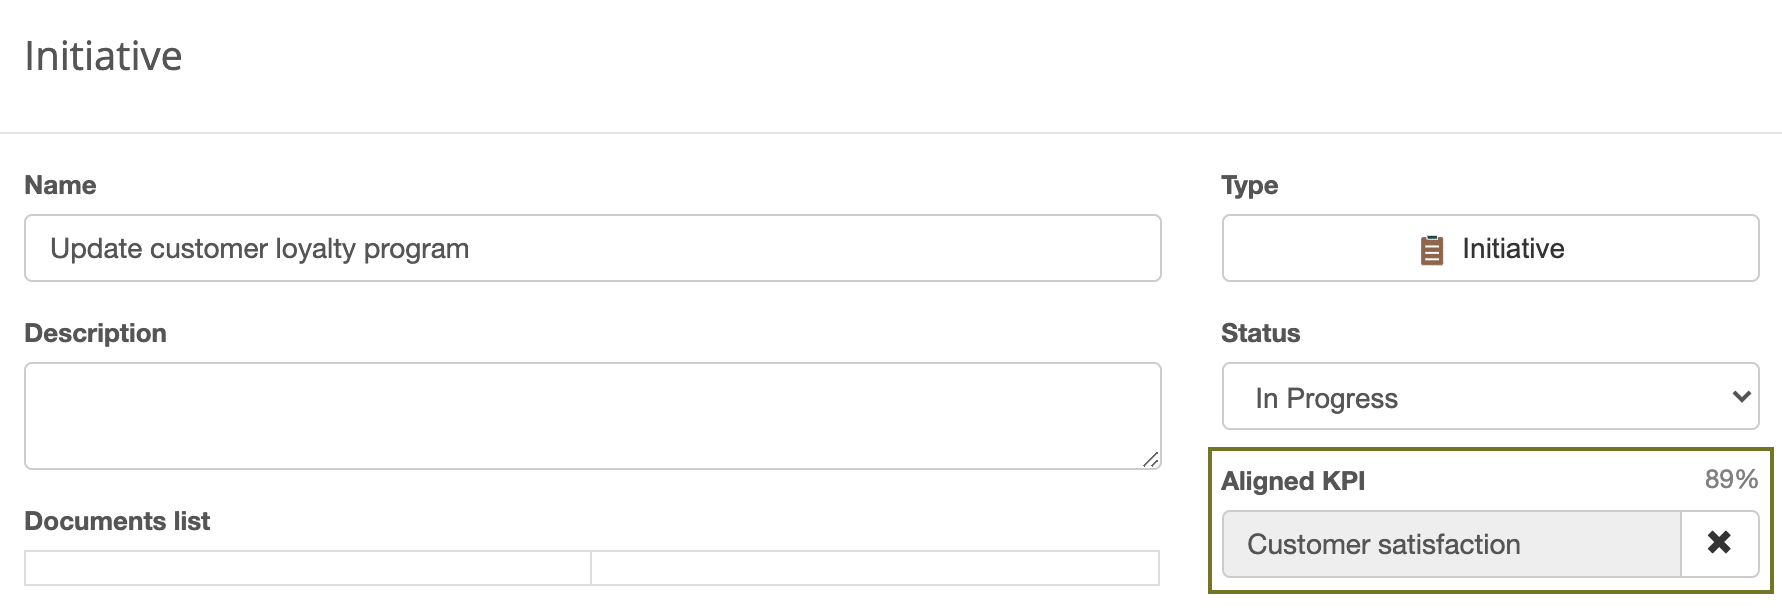
- A possibility to align KPI with an initiative:
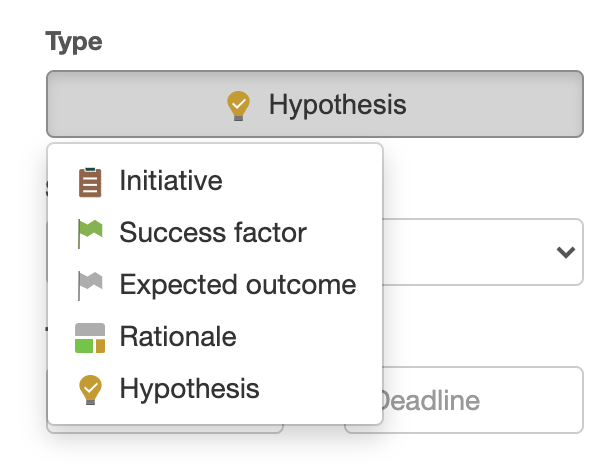
December 2020 updates:
- Now there are different types of initiatives to better describe business context:
- Improved speed and deliverability of alerts and other email notifications
- Full support of xTS columns in the reports
- Sign-in with Google added
- Strategy map wizard – revised and updated
November 2020 updates:
- Trash bin for My scorecards section
- Automated analysis of strategy map quality was implemented in BSC Designer Online. Find quality index in the top right corner.

- More properties of the initiatives (budget, attached documents, timelines, statuses) can now be imported/exported to CSV or Excel
October 2020 updates:
- Properties of the initiatives are now supported when importing/exporting from/to Excel
- Tracking scorecard deletion/creation events for audit trail log
- Fiscal year support in BSC Designer Online (see Settings > Organization > Fiscal year starts)
- Stop-lights for YTx and QTx performance added
- Dates on chart axis adapt to the grouping period
September 2020 updates:
- Values editor is now available for all users (view-only and power users)
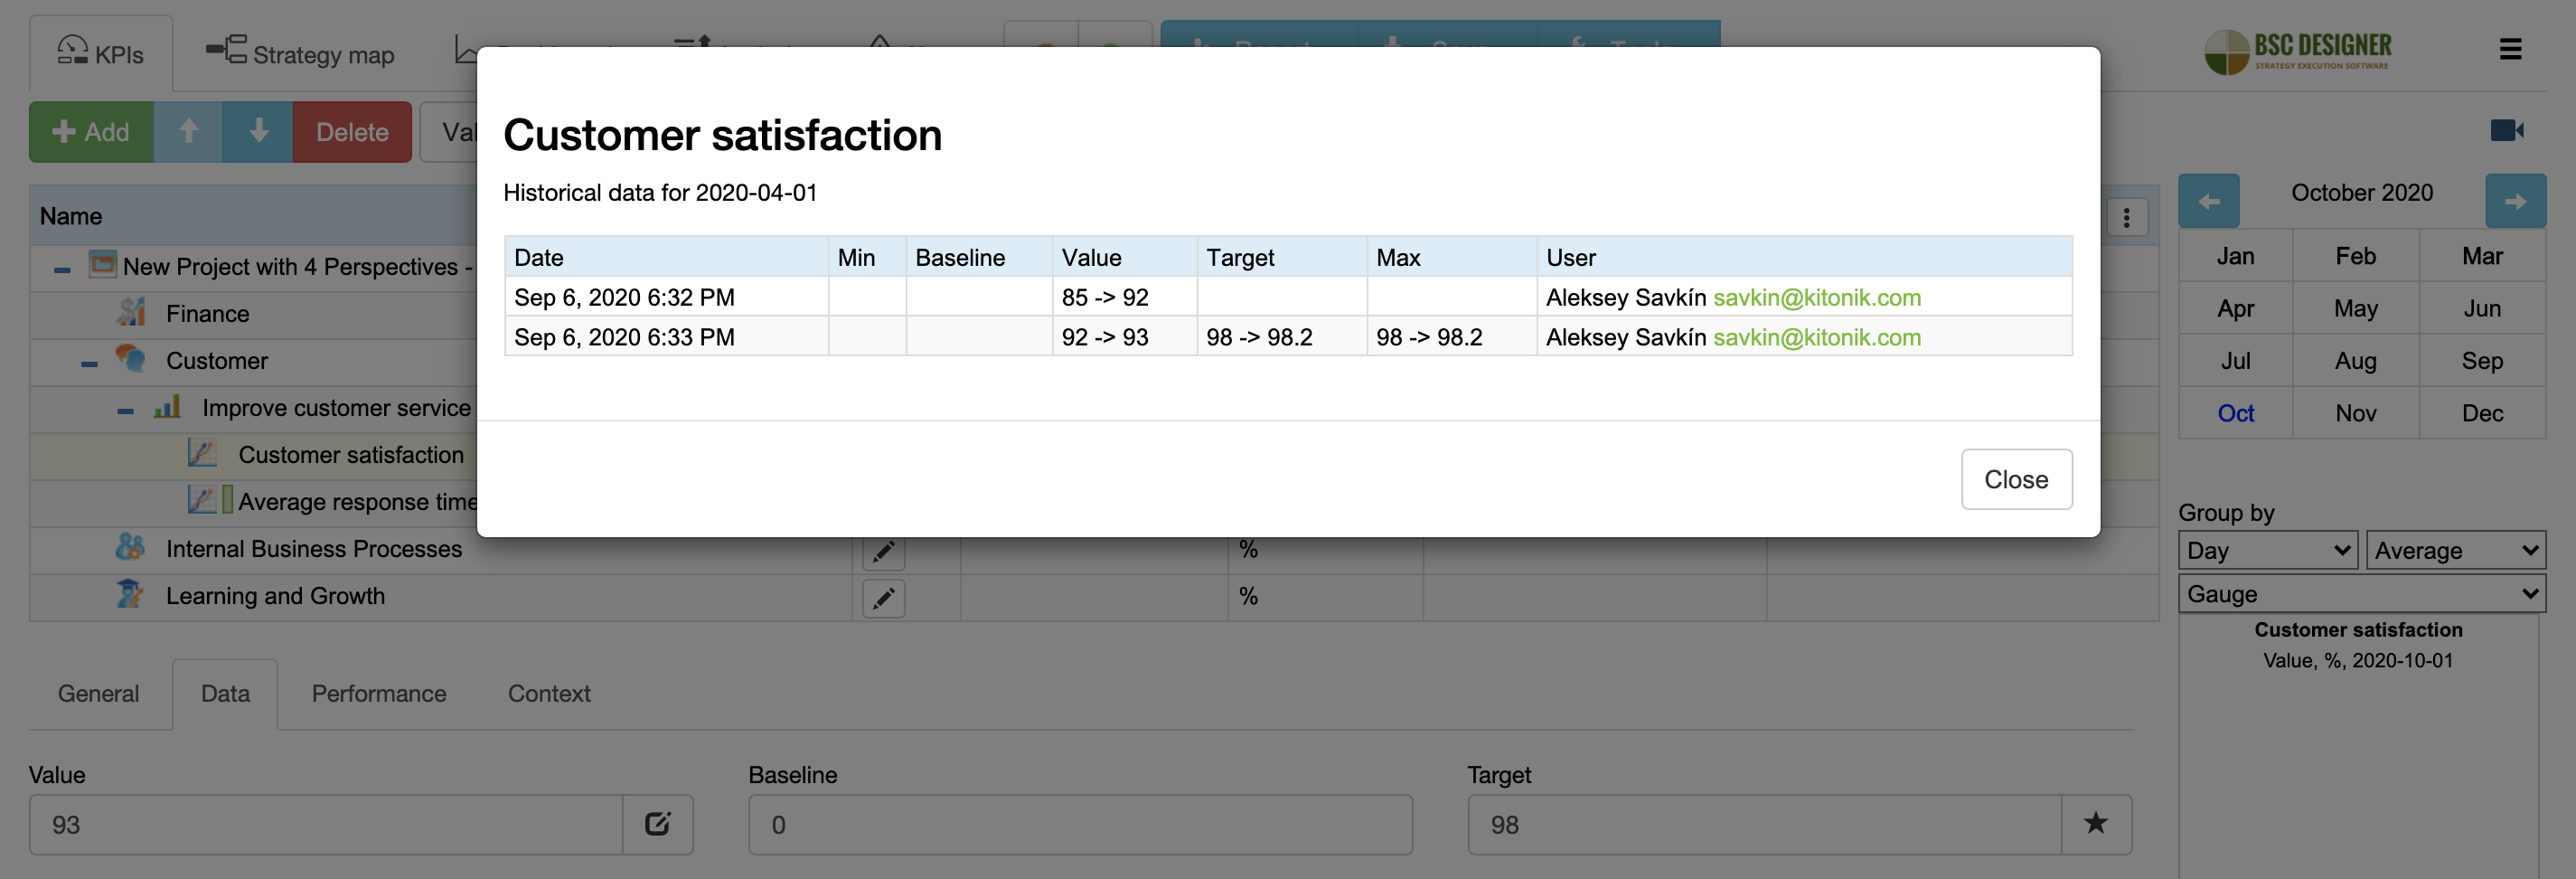
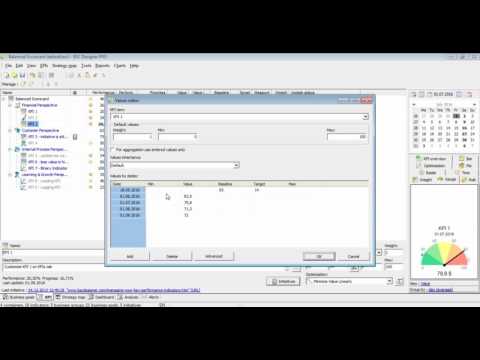
- Keeping track of changes to the values. Users of BSC Designer Online can now activate a special logging function to keep track of all changes of the values of a KPI (see Users > Log > Settings > KPI Value Modified). Once activated, a
 “History” button will appear near the value in Values editor. Click on this button to access detailed change log that includes change date, changed value, a user who introduced the change:
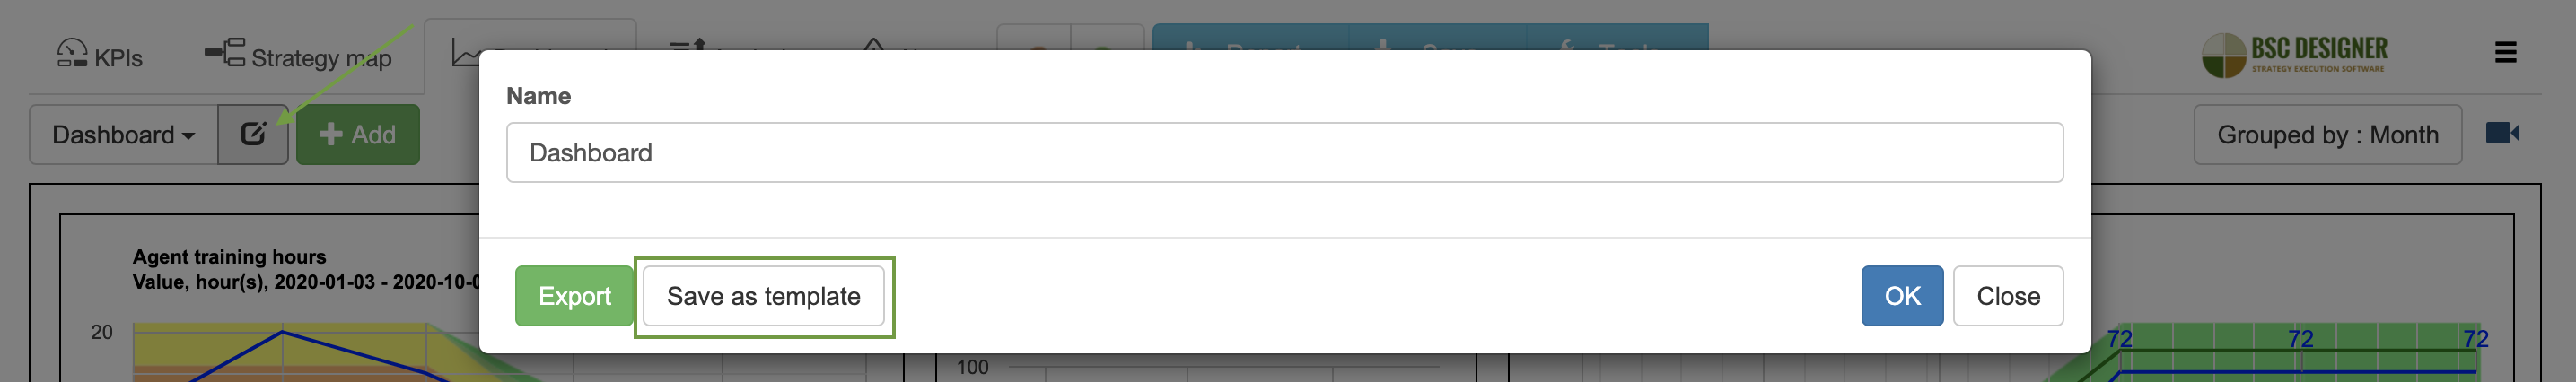
- A possibility to create dashboard templates and reuse them for other scorecards. The created template will be available in the drop list with the names of the templates. Manage templates on Settings > Workflow tab > Templates. Create template by clicking “Save as template” button in the template settings.
- Next update date is now calculated for indicators that don’t have data yet
August 2020 updates:
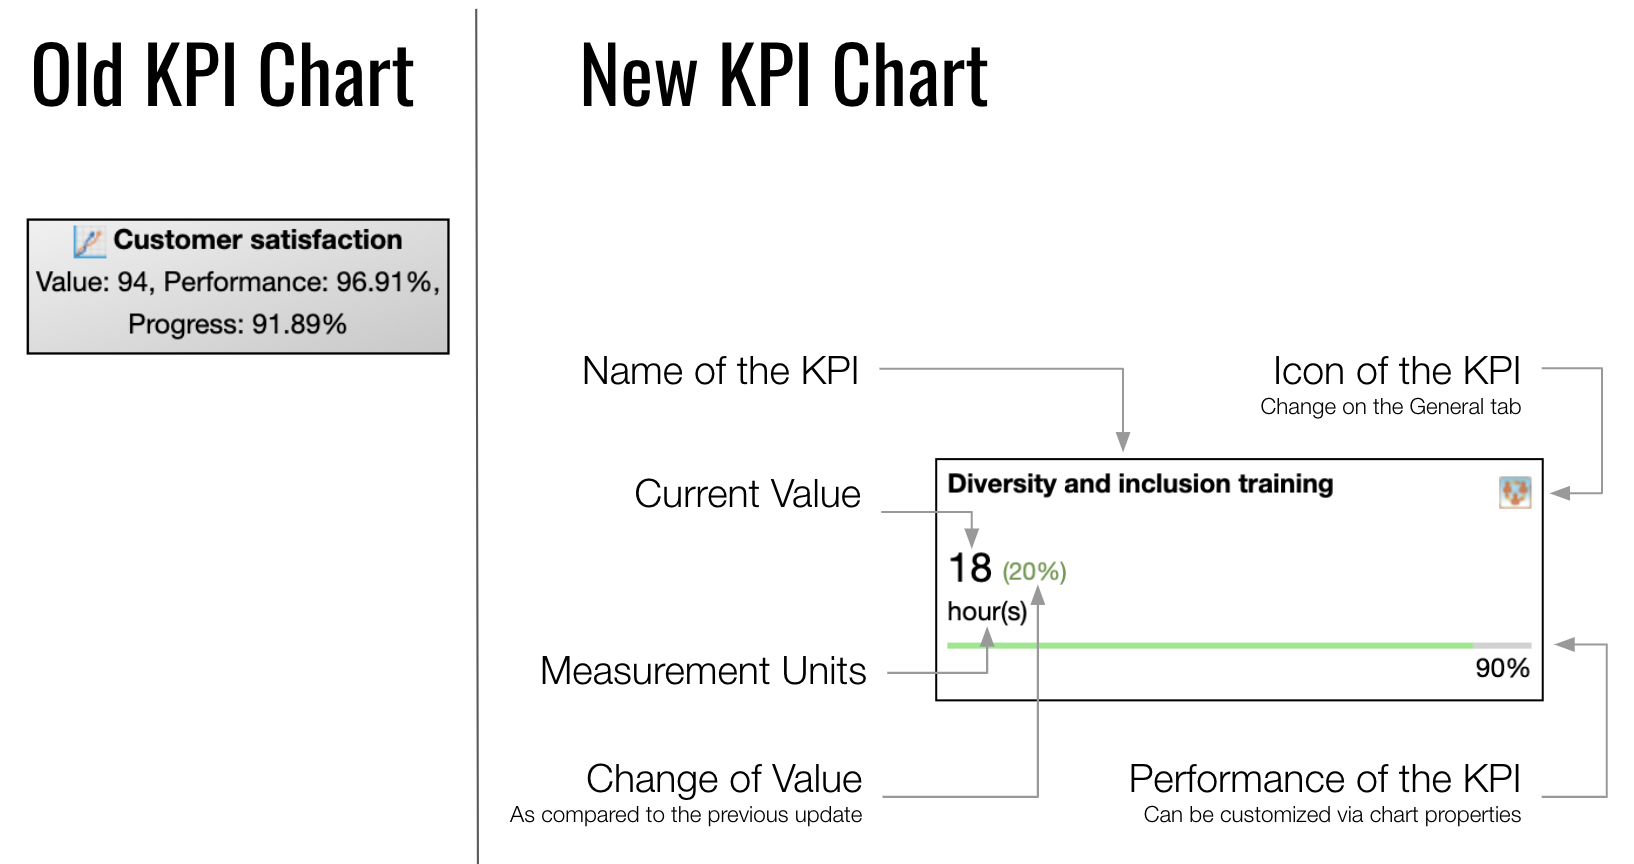
- KPI chart improved in Online (will be updated in PRO soon):
- Faster adding users to the account via invite link (Online)
- Faster rights assignment to the users in the account (Online)
- Adjusting time period for the Values chart on the dashboard
July 2020 updates:
- Easier update of existing charts on the dashboard tab
- Show annotations settings for the Time and Bar chart
- xTS and xTD is now fast calculated using non-cached data
- Fixed: translation of binary measurement units
- Some keyboard shortcuts added (Shift + N to create a KPI on the same level)
June 2020 updates:
- Better calculation for YTD taking into account inheritance of the target value
- xTS is now calculated more correctly until the end of the selected interval
- Now all the reports are available from a single point menu (click on the “Reports” button on the toolbar)
- More accurate calculations for YTS values, “n/a” will be shown for the cases when no cached value for YTS of imported indicators is available
- Links to the source document of imported indicators
- New update intervals Half-Yearly and Once implemented in PRO (previous implemented in Online)
May 2020 updates:
- Half-yearly update interval for the indicators is now supported
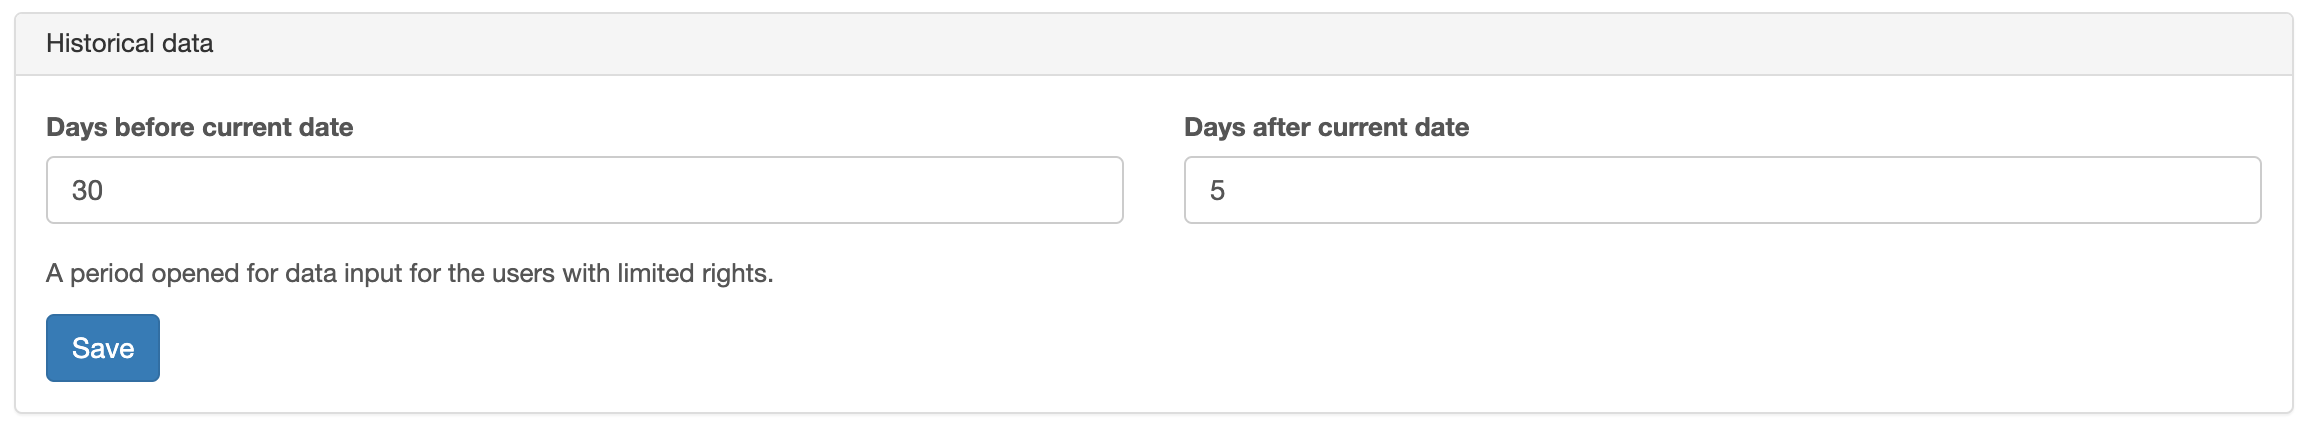
- More flexible access to historical data, users can now specify the interval when historical data can be changed
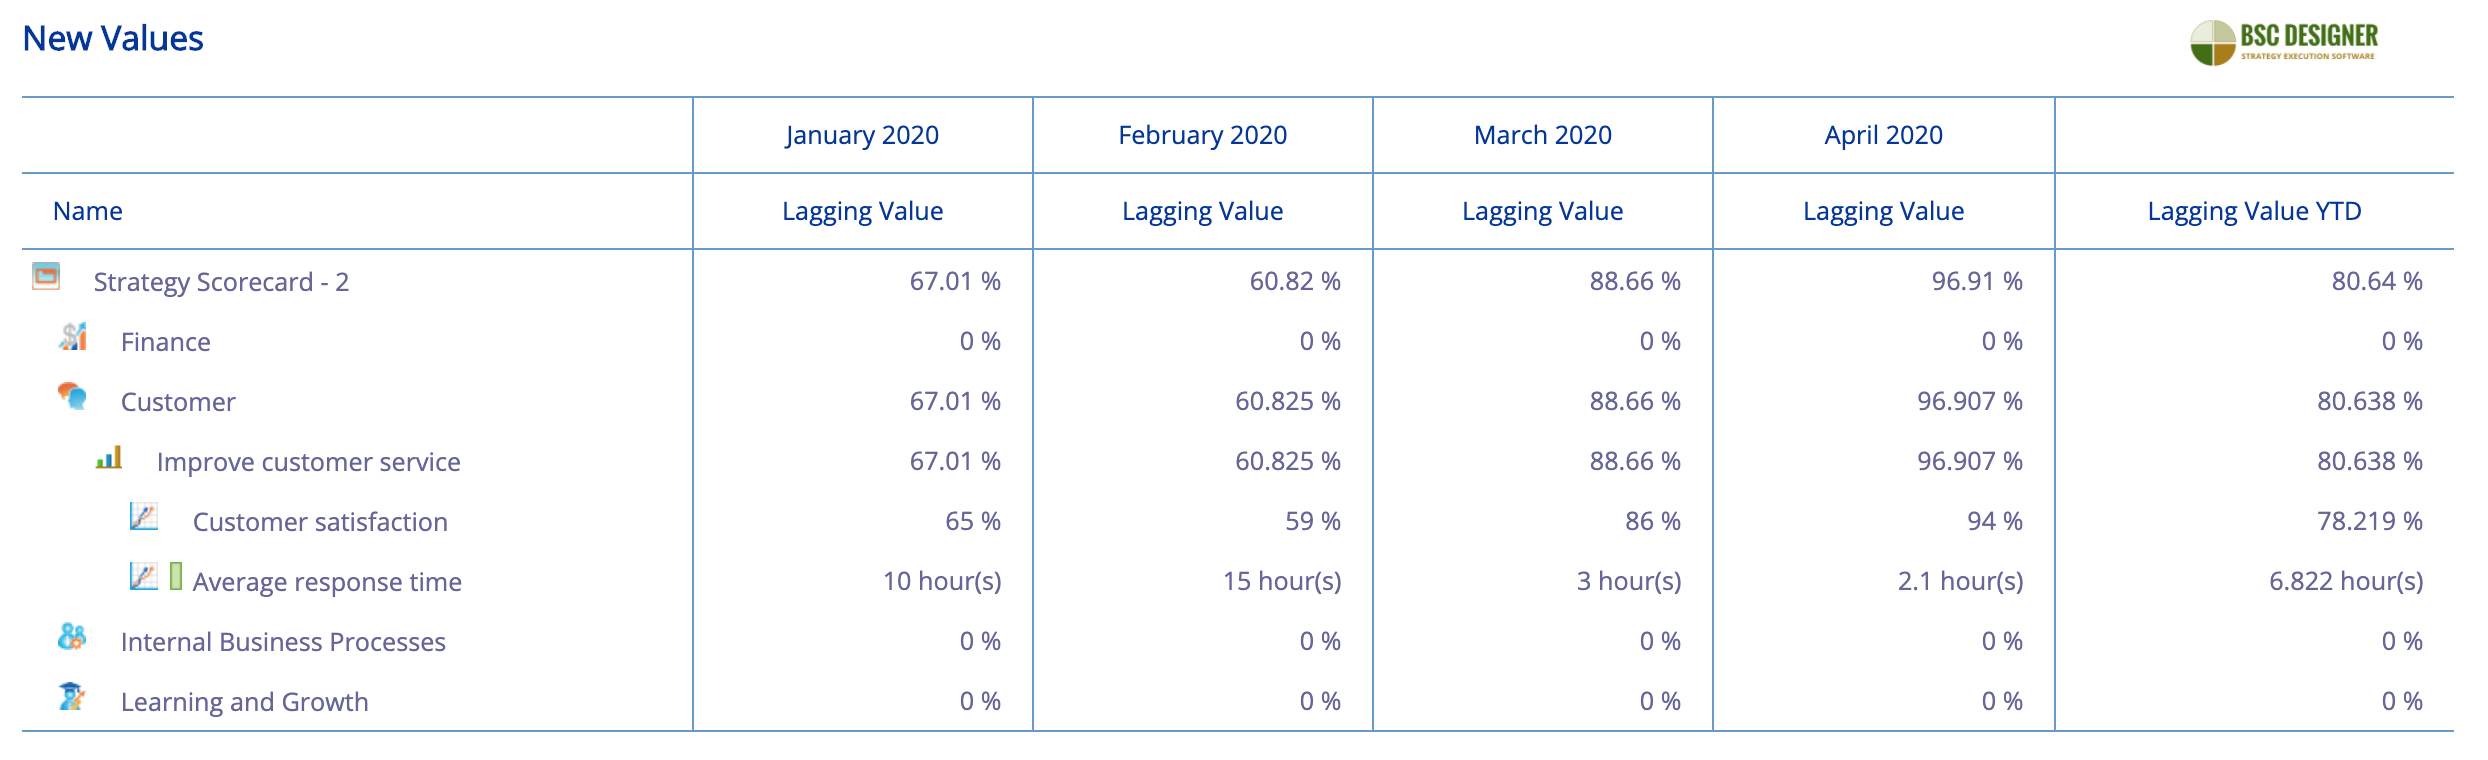
- Goal and KPIs report (in Online) now supports running dates
- Supporting imported values for export to Excel/CSV
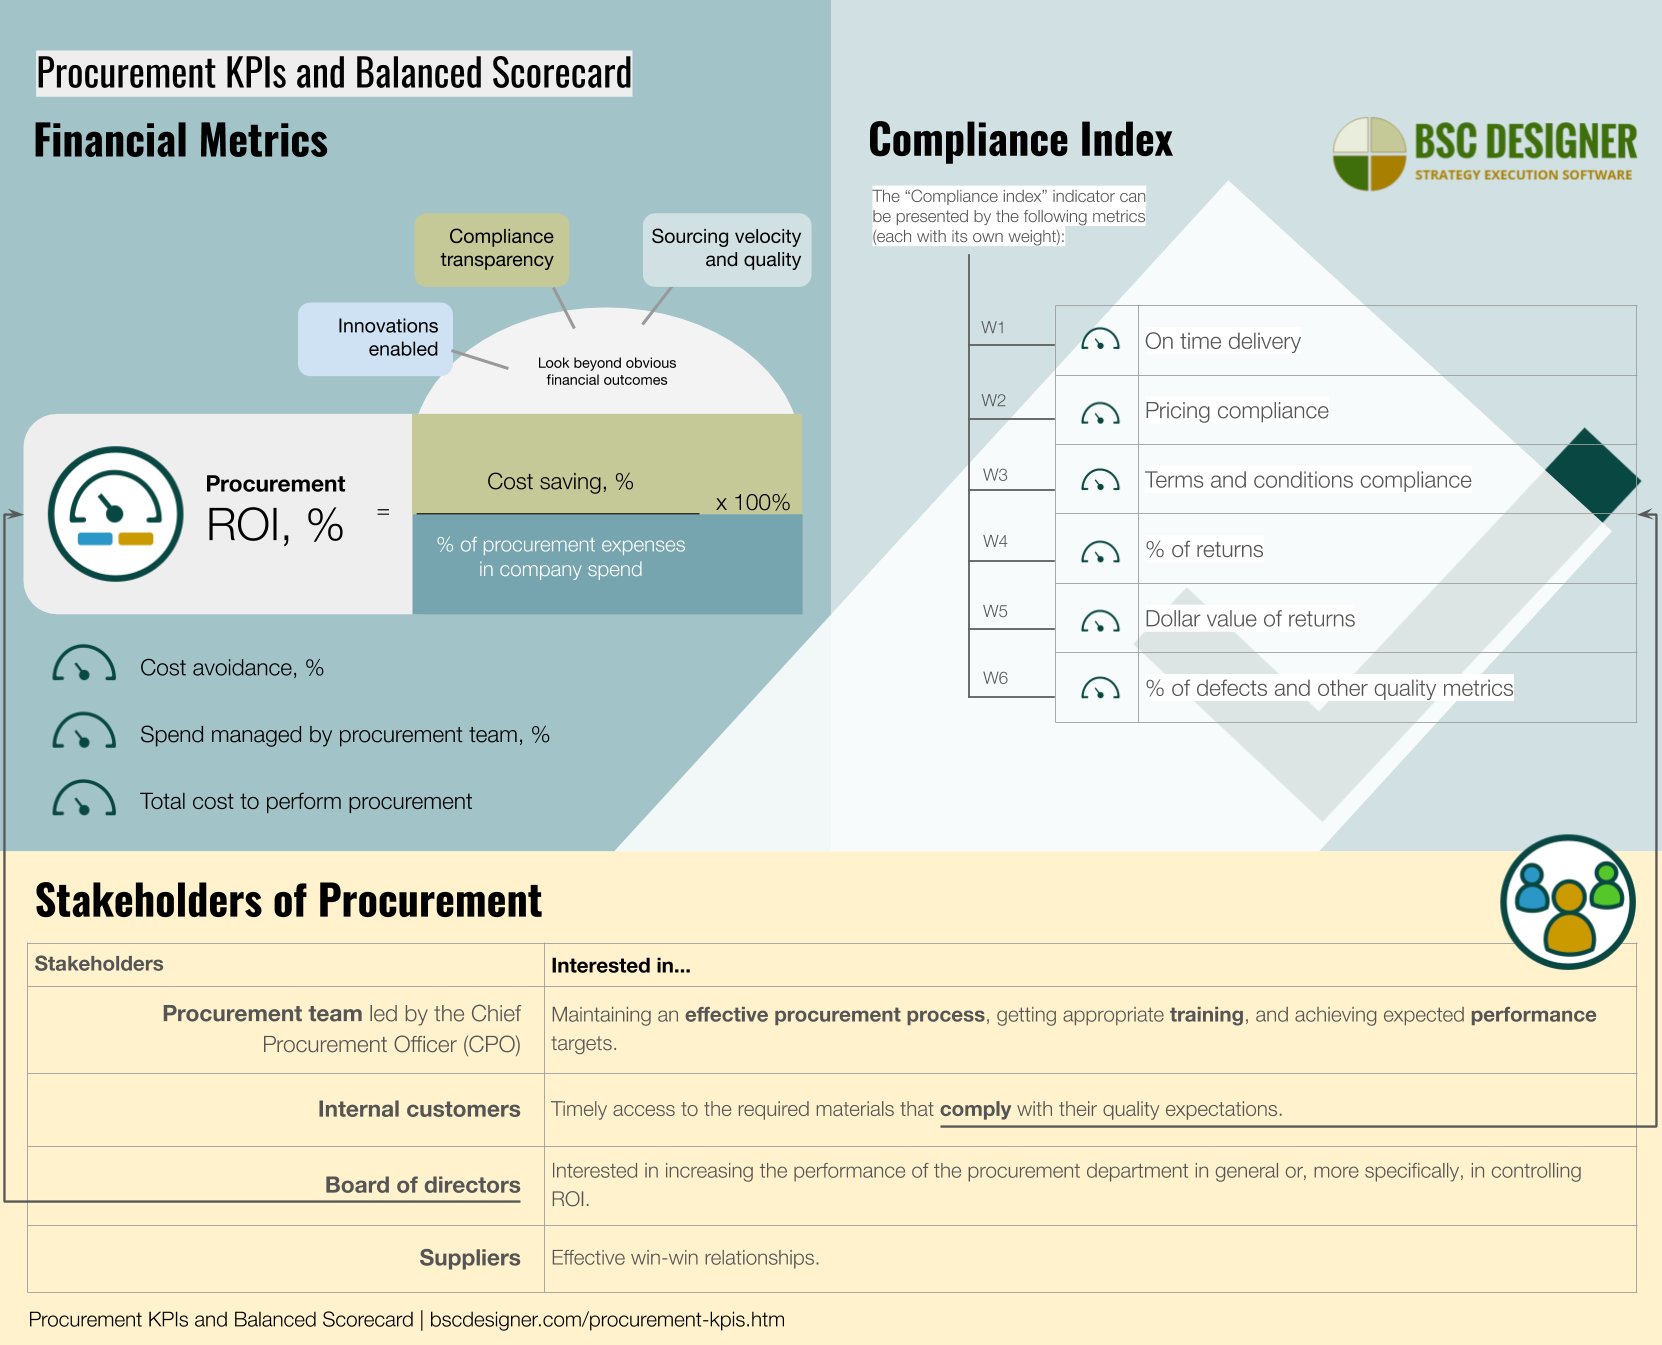
- Procurement scorecard template released (available in Online and PRO)
- QTD, YTD columns improved with periods in the tagline
April 2020 updates:
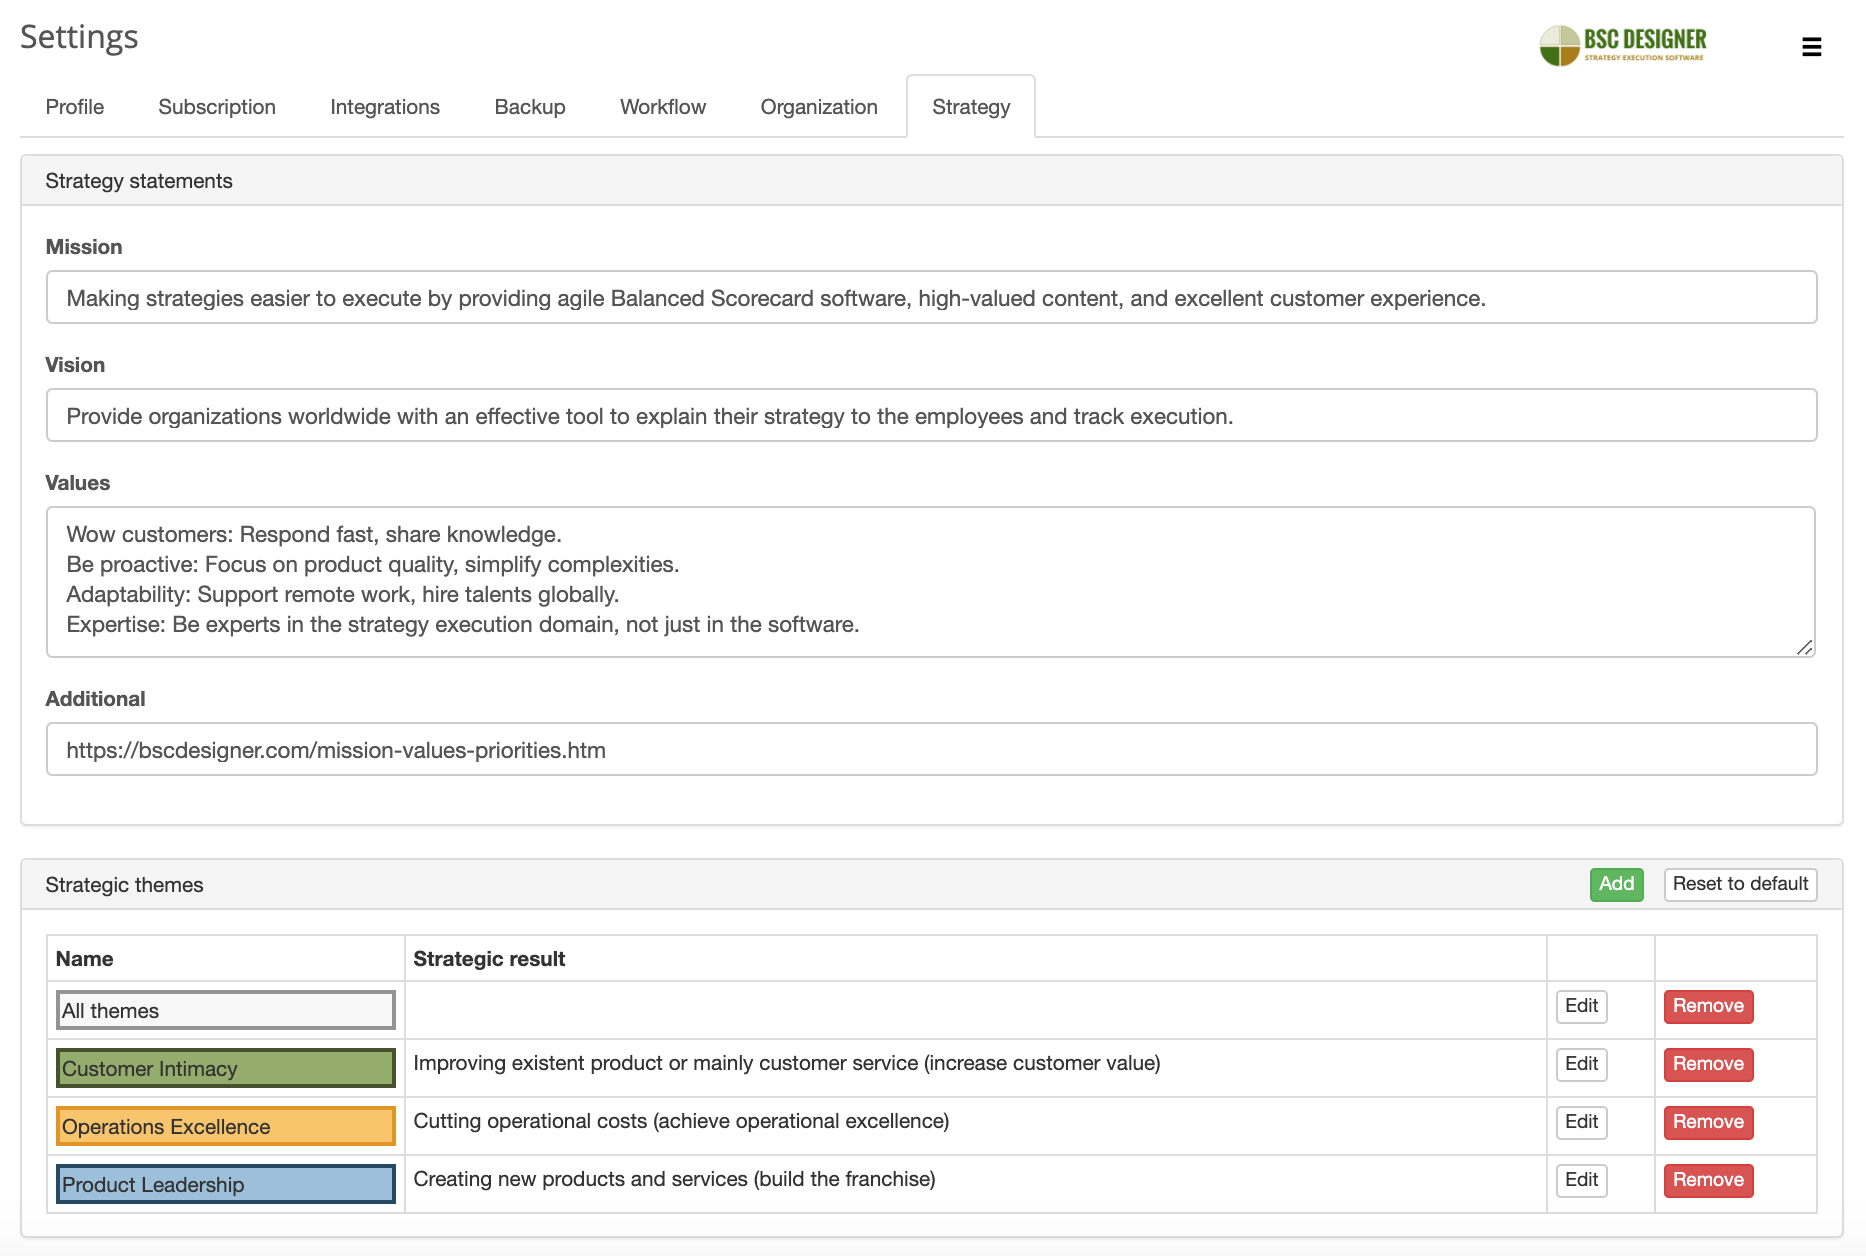
- Global settings for strategy attributes like mission, vision, values and strategic themes (see the Options > Strategy in Online and Application Settings in PRO)
- Keeping the header of the KPI tree always visible
- Overview and Gauge charts optimized for retina displays
March 2020 updates:
- Excel format option for Goal and KPIs reports
- Comments columns and dialog for KPIs tab
- Smarter object position lock for strategy maps
- Update information columns for the KPIs tab and reports
- Keyboard shortcuts added to BSC Designer Online
- COVID-19: Business Continuity Strategy Template added to account templates
- Corporate governance added to the account templates
- Remote team KPIs added to the templates
February 2020 updates:
- Owner property for the goals/KPIs (Online and PRO)
- PESTEL template added to the framework templates
- A template for Pareto analysis added
- Better processing of Web SQL Indicators (null value in return supported)
- Items count column for KPI tree – helps to find the hot spots of a strategy
- Budget column for KPI tree – helps to have an overview of the initiatives’ budgets
January 2020 updates:
- High DPI export for strategy maps (Online and PRO versions) – to use crisp-clear strategy maps in your presentations
- Informative messages will now disappear on timer (Online) – something that will provide a more user friendly experience
- The currency that is selected as a default currency is now selected as a default for all new initiatives
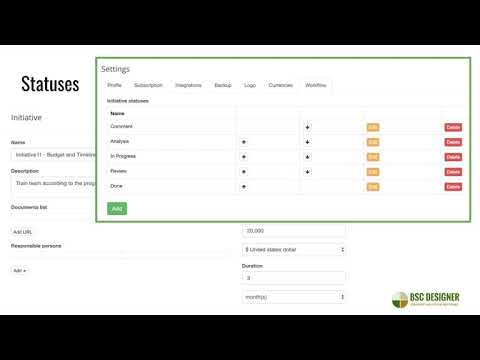
- Statuses in the initiatives (Online and PRO) – use default statuses or add your own
- Some minor usability improvements in the Values editor dialog
- Freemium limit updated from 2 to 5 scorecards
- Smarter lock for strategy map objects is released
- Local currencies will be added automatically to new accounts on sign-up
- Scorecard name in organizational structure and inside the scorecard are now synchronized
December 2019 updates:
- Initiatives dialog updated with the possibility of specifying timeline and duration separately
- Initiatives (all) and initiatives (current) columns for the KPIs table to display initiatives sorted by the date
- Copy and paste indicators for BSC Designer Online (see the Tools menu)
- Bug related to loading currencies list for initiatives fixed
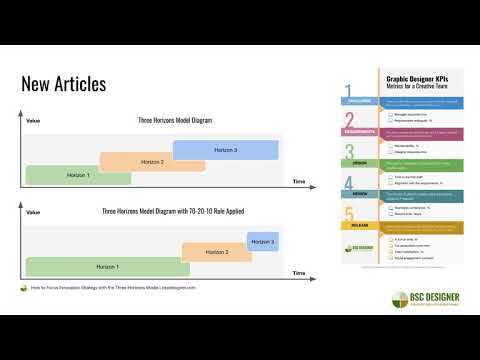
- Graphic designer KPIs template added to the templates list
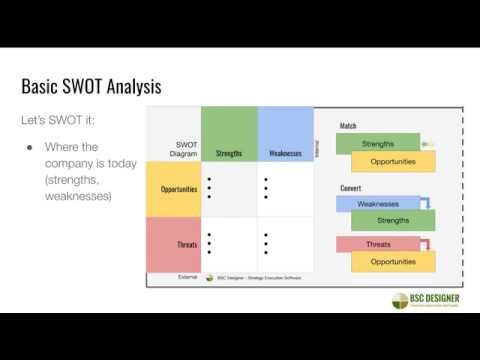
- New SWOT+S framework template added to the templates list
November 2019 updates:
- API now accepts API keys as authorization token; API keys can be created on the Integrations tab
- API updated with measure_units and accept_data parameters to provide more opportunities to enter data in a scorecard
- A new Three Horizons framework added to the New > Templates > Frameworks in Online (samples folder in PRO)
- Can now import initiatives from Excel spreadsheets in Online and PRO
- Better processing of KPI values formatted as % and currency when importing from Excel
- Risk diagram improved: automatic logarithmic scale applied to the impact axis, high-resolutional display support
- Ability to opt in/out from alerts notifications by user
- Logo added to the HTML-based reports in Online
- Ability to show description column in the KPIs tree
- Ability to cancel subscription and delete account added
- Report design updated (better text wrap for dates, values with measurement units), better look when printed
October 2019 updates:
- Free plan for BSC Designer Online released
- Interface updated to the most popular (minimalistic) style
- Less used functions, like Imported Indicator and SQL Indicator were moved to the Data sources dialog (see the video review)
September 2019 updates:
- Major speed optimization update for both Online and PRO
June 2019 updates:
- Y2D, Q2D columns for the KPIs tab in Online and PRO
- Performance calculation for empty goals updated
- API is now available for all power users
- Minimalistic UI is now default for new accounts
- Target/baseline logic for indicator with minimize optimization function
May 2019 updates:
- Adjustable columns in KPI tree (BSC Designer Online). See the Columns option in Tools menu.
- Excel import bug fixed for values with minimize optimization
- Better logic for charts on the strategy map (no data = no charts in zeros)
- Better support of imported indicators in formulas
- “Default” strategic theme is now renamed to a more relevant “All themes”
- Crisp-clear strategy map (you’ll see the difference on devices with High DPI screens)
April 2019 updates:
- Zapier integration released. The APP is in private state, so you will need this invitation link.
- Webhooks added to BSC Designer Online, BSC Designer PRO will support webhooks if team work is managed via BSC Designer Online. Learn how to use webhooks.
March 2019 updates:
- Strategy Map Wizard now supports existing goals
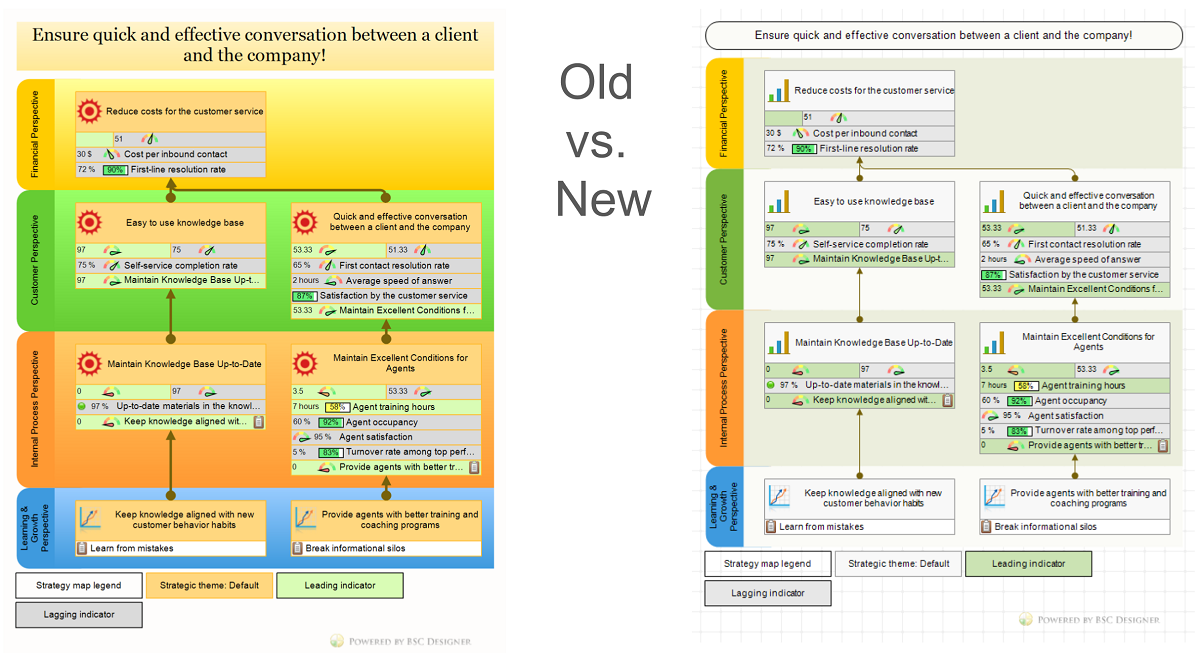
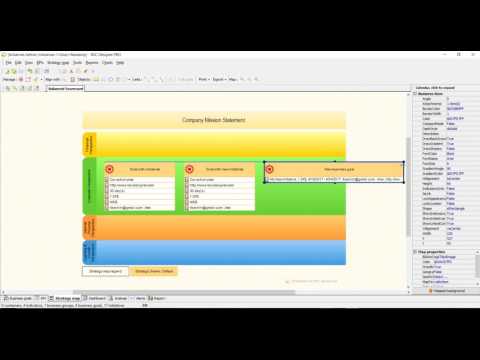
- Strategy Map Design Updated in BSC Designer:
February:
- Allow/block access to the historical data – support in data series
- Adding KPIs directly to the map is now easier
January 2019 updates:
- Interface icons for the tabs
Version 9.1. Release date: November 27, 2018
- Goals and KPIs tab merged in BSC Designer PRO
- Main tab icons updated in BSC Designer PRO
- Master for moving goals from old Business Goals tab to a new KPIs tab added
- “Save as…” logic updated – existing scorecard can not be overwritten
- Validation of non-ANSI symbol in permalinks
- Suggestion to link leading and lagging parts when two indicators are linked visually
- Command line support for “Goals and KPIs” report
- Possibility to select default measure units for new indicators
BSC Designer Online. 11 June, 2018
- New report for KPIs: customization + 3 default profiles (Cost of Strategy, Efforts vs. Results, Action Plan)
- Budget and time initiatives are available for indicators
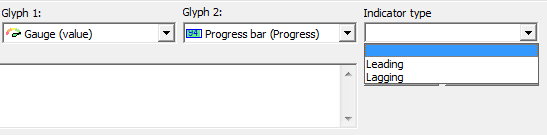
- Indicators can now be leading and lagging (setup directly on KPI tab)
- Leading and lagging type of indicator is taken into account when calculating the performance of parent indicator
- A strategy map based on KPI tab only with leading and lagging performance data for the goals
Version 9.0. Release date: 28 January, 2018
- Target planner (a button next to the “target” field) now has “Round values” option
- Better alerts: now the stoplight alert can be defined as <= or >=, for example a stop light “<=yellow” means that it will fire for “red” and “yellow” stoplights
- Online: a checkbox that allows to activate automatic scheduled update of the exchange rates for the currencies
- Online: better support (adding/removing indicators) of the charts with multiple indicators
- “Save” function in BSC Designer Online was improved. The program will now manage the situations when the Internet connection was lost.
- More intuitive selection from the list of options in BSC Designer Online
- Perspective is pre-selected when the new goal is created from the strategy map
- Alerts for the stop lights cover all dates including dates in the past
BSC Designer Online. 3 December, 2017
- Excel reports problems on Mac fixed
- Data inheritance logic updated for the cases when only target/baseline values were entered
BSC Designer Online. 19 October, 2017
- Strategy map wizard released in BSC Designer Online.
Version 8.9. Release date: 7 October, 2017
- Web SQL Indicators are now updated automatically using the “update interval” data
- RESTful API for BSC Designer Online
- PRO and Online: Import from Excel by GID of indicator (useful when the name of the indicator is changed)
- Better touch-screen support for Dashboards tab in PRO
- Date labels on the charts in PRO updated – diagram resize is taken into account now
- Online: direct editing of the dates in Values editor
- PRO and Online: individual settings for indicators aligned with different business goals
- Online: bar charts added to the KPIs tab
- Online: better links alignment for the vertical objects
- Online: description fields for KPIs and business goals are now multi-line
- Online: baseline and target values are now visualized on bars chart
- Online: target planning function actualized to take into account indicator update interval
- Online: better SQL indicators
- Online: product manual localized in German and Portuguese
- Online: Strategy Scorecard Wizard added into the “Tools” menu
Version 8.8. Release date: 24 April, 2017
-
- Initiatives dialog improved – initiatives are now more like tasks, instead of separate comment, budget, and duration initiatives, there is now a one initiative entity that includes all mentioned properties; there can be many initiatives; there is now a function that helps to merge several old initiatives into a new one:
- Chinese translation actualized
- Progress/performance is now displayed for the aligned indicators on the business goal tab
- Radar diagram is now more user friendly when more indicators are displayed
- Better dates visualization on the charts in BSC Designer PRO
- Updating SQL indicators via command line (see “Updating SQL indicators” in the manual) in BSC Designer PRO
- Additional option for Analysis tab: analysis can be applied to all elements, to the indicators, or to the containers only (both in PRO and Online)
- Custom measure units in BSC Designer Online
- Export to Excel in BSC Designer Online
- Full support for currencies (needed for the budget initiatives) in BSC Designer Online
- Faster permissions management in BSC Designer Online
Version 8.7. Release date: 19 December, 2016
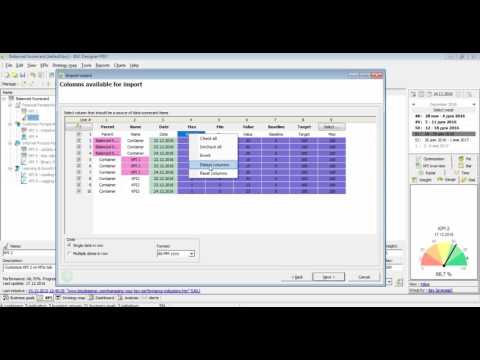
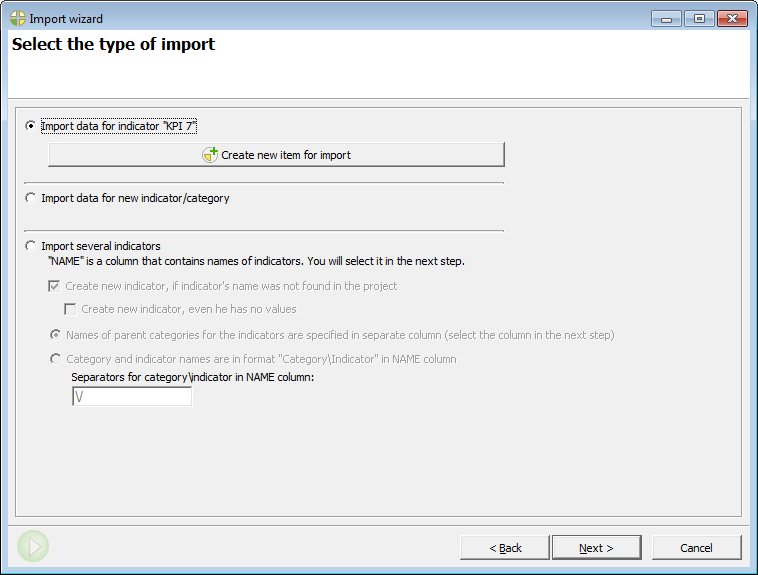
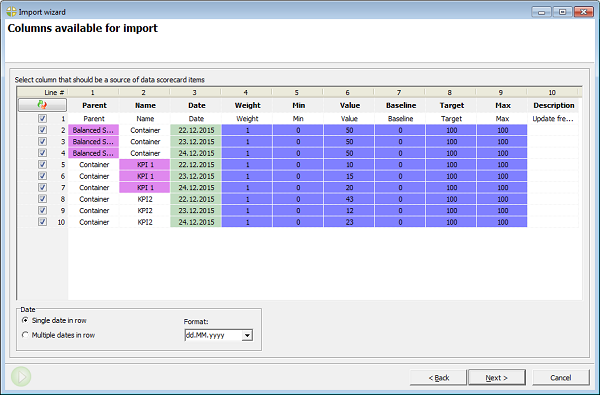
- Importing from Excel is now much more user-friendly. We reworked the import wizard from scratch. Instead of having 2 steps heavy loaded with options, the same functionality is now supported in one simple dialog, compare:
Before Step 1:
Before Step 2: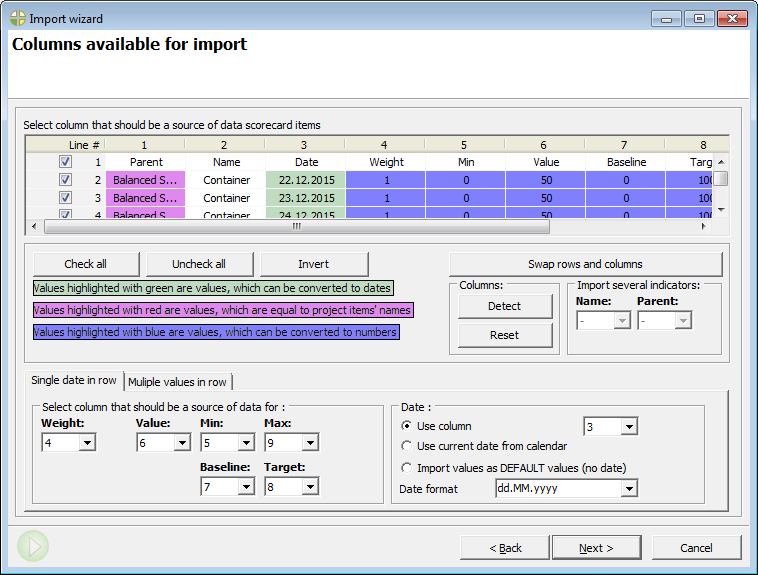
Now:
- Instead of having two different initiatives “Remark” and “Comment” now there is one “Comment” that includes the functionality of old “Remark” (date specific comments) and “Comment” (comments that are not linked to any specific date).
BSC Designer Online Update. Release date: 16 December, 2016
- Better import from MS Excel spreadesheets. Check out the details in the new video.
- Scorecard and KPI sharing function updated. Check out the details in the new video.
BSC Designer Online Update. Release date: 4 November, 2016
- Better dashboards – easier resize and relocation for the objects
- SSL certificate was installed, so update your links to https://www.webbsc.com
- Russian translation of the interface as well as the manual added
- Issue with the default browser dialogs was fixed
- Two types of initiatives – comments and remarks were merged into one comment, and you will still have remark’s functionality (date specific comments)
- Email alerts will include a corporate logo from your account
Version 8.6. Release date: 19 September, 2016
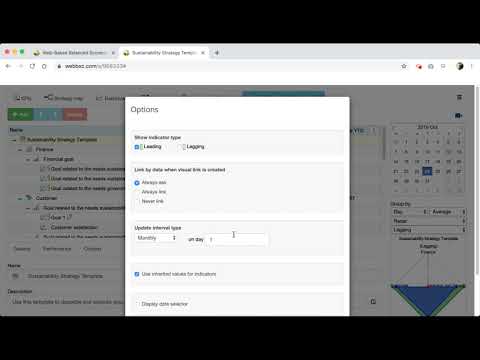
- A new option that allows to specify how the software should treat dates without data: should it show inherited data (data available from the previous time point) or show only the data that was entered. The new option is available for each indicator in KPIs > Edit Values. The default value can be customized in File > Document Properties > Grouping tab.
- Import and export functions for Excel spreadsheets improved to avoid possible confusion by the indicators with the same name.
- Autosave feature for the projects added; users can adjust autosave interval in menu Tools > Application options > General.
- Additional information is added into PowerPoint report. “Start value” and “End value” columns now show the dates for the respective values:
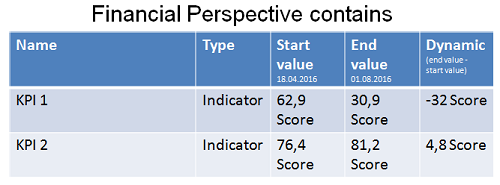
- Cosmetic updates of some charts – update of “KPI Overview” chart; a legend added to the big version of the “Gauge” chart.
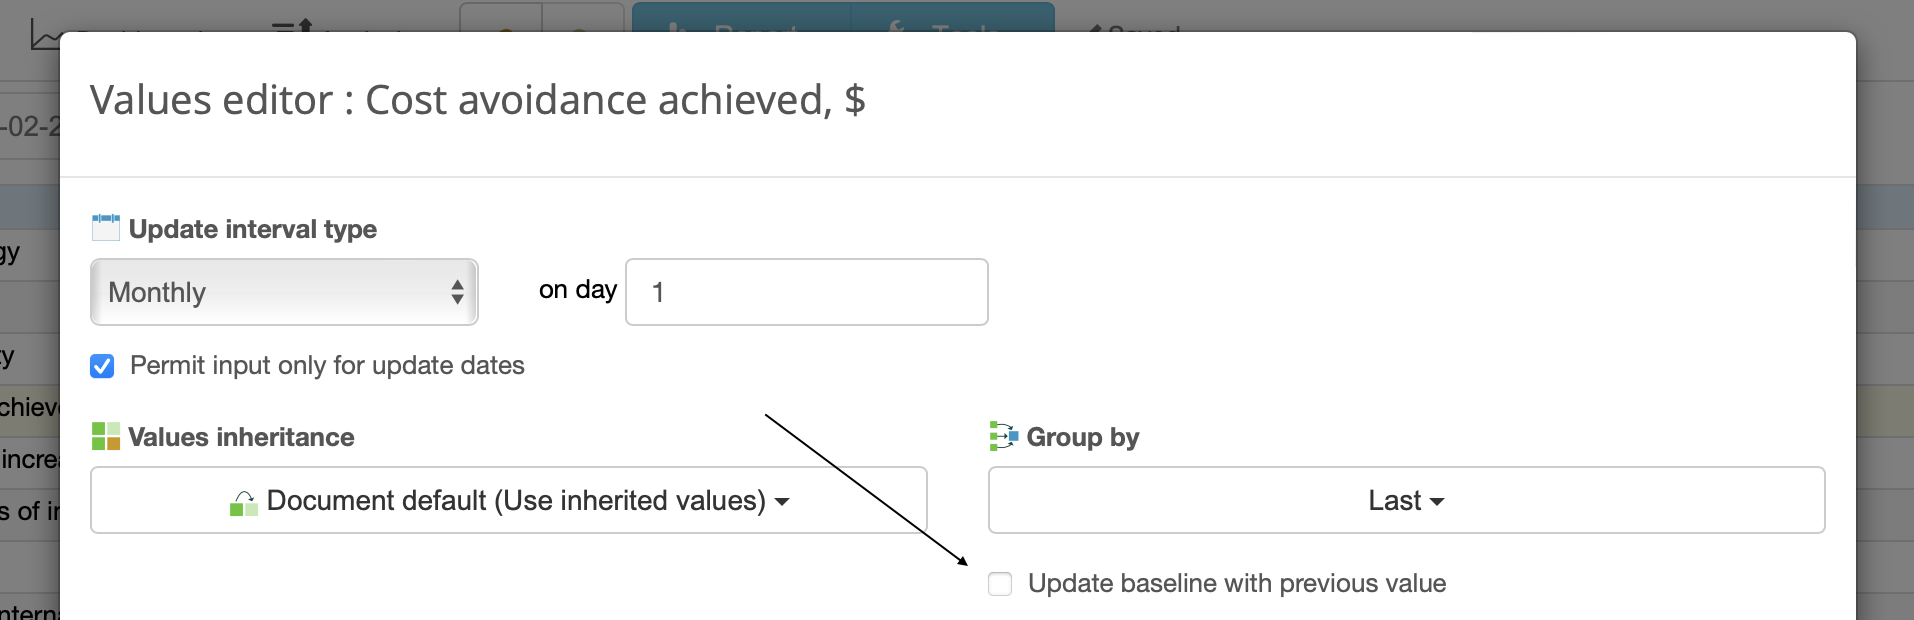
- Strict control over the selected update interval. For example: if a KPI’s update interval is monthly on 1st day of the month, and “permit input for only for update dates” checkbox is on, then the software will do what you want it to do – it will allow enter KPI data only into the dates allowed by update interval. If some date is not allowed by the selected update interval, then it will be marked by red color in the Values Editor.
BSC Designer Reader released. Release date: 9 August, 2016
- This is a version of BSC Designer that allows to have a view-only access to the .BSC projects created in BSC Designer PRO. Download it here.
BSC Designer Online Update. Release date: 19 July, 2016
- Easier management of the larger projects and larger organizational structures as KPI tree, business goals tree, and organizational structure can now fold and unfold.
- Ability to upload and add images to the strategy map.
Version 8.5. Release date: 21 June, 2016.
- Background colors on Time diagram are now responsible to the changes of min/max
- The large versions of “Time” and “Bar” diagrams (those that we can when double click on small charts) now have “Show data labels” checkbox.
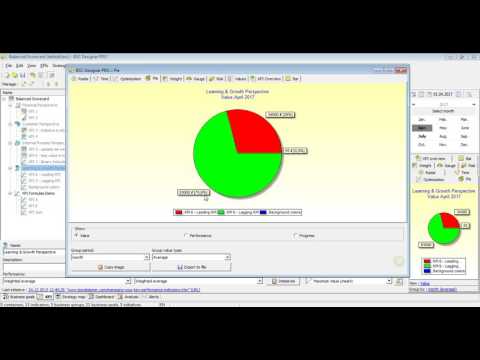
- The large version of “Pie” diagram now visualizes not just values, but the sector percentage.
- Better weight management for KPIs. The property “max weight” was removed; now the software finds out the max weight automatically. Newly calculated weights will coincide with weights calculated when “max weight” property existed. Respectively, “Balance indicators” button was removed as manual balancing is no longer required.
- Weight diagram was updated as well, now the values are presented in % values.
- Better KPI formulas. A calculation formula used for a KPI’s value will now be used for its baseline, and target. If the value of “KPI 3” is calculated as “KPI 1” + “KPI 2,” then the same formula will be applied to the “Baseline” and the “Target.”
- “Accumulated value” column was removed, now all the accumulated is displayed when respective “group by” period is chosen.
- Spanish translation of both PRO and Online versions was polished.
Version 8.4. Release date: 9 May, 2016
- Multi-currencies for budget initiatives and “Budget and duration” report
- Strategy map legend updated
- Full-screen mode for strategy maps
- Copy object style on strategy map
- Interface with Google Calendar and Google Task updated (it is possible to add records into Google Calendar and Google Tasks via “Initiatives”)
- Import of the data for KPIs from Excel that takes into account update interval
BSC Designer Online Update. Release date: 4 May, 2016
- A possibility to limit access rights to the certain fields of a KPI only (user can change value, but not target and baseline)
- A possibility to turn on logs for account
- Easier data backup and restore
- Geo maps are now supported in online version
Version 8.3. Release date: 7 February, 2016
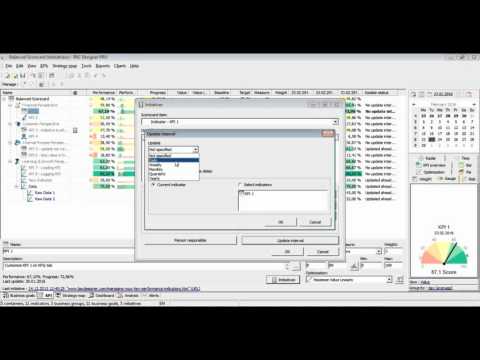
- More flexibility with update intervals – modify update intervals in bulk, new “Update status” column for on KPIs tab.
- Easier to customize a stop-light: when customizing a stop light you will see not only performance, but value figures.
- More flexible algorithms for containers’ value, it now creates data for dates where child items have values.
- Multiple select for persons in the alerts and responsibility list.
- Improved “Ignored in formulas” function – now you can have pure data items (without performance or progress). Old “Ignored in formulas” check box is now renamed to “Raw data indicator.”
- Easier Excel templates for your scorecard. Prepare your scorecard in BSC Designer, export it into MS Excel spreadsheet, update data, and import it back into BSC Designer with updated data.
- Binary indicators – the performance of indicator is 100% when the “value” is >= “target”; the performance is 0% when the “value” is less than “target”
- The program will now remember your choice of charts and diagrams for specific indicators and containers
BSC Designer Online update. Release date: 31 January, 2016
- “Overview” strategy map is now there. Like in PRO version, in Online one can create “Overview” map for KPIs and for business goals.
BSC Designer Online update. Release date: 8 December, 2015
- Dashboards from .BSC project are now fully supported in BSC Designer Online. View project dashboards and create your own online. Mobile devices with touch interface (tables and smartphones) are also supported.
Version 8.2. Release date: 13 November, 2015
- Ability to use “progress” and “performance” in the formulas for KPIs (in both Online and PRO versions). Now it is really easy to use BSC Designer for the calculation of the bonuses that are linked to the performance indicators. Learn more…
- More flexible KPI data re-use. Now if you plan to re-use some of your KPI structure you can easily clear selected data from KPI.
- Name and weight of the imported indicator can now be customized according to user needs or can be taken from the source project.
- BSC Designer Online is now localized in Spanish, Portuguese, Arabic.
Version 8.1. Release date: 25 September, 2015
- Schedule report generation and upload to company’s FTP automatically
- Container’s min, max, baseline, target can be calculated using child data
- BSC Designer Online: organization scheme is now supported
- BSC Designer Online: value editor
- BSC Designer Online: biggest gain/loss analysis
Version 8.0. Release date: 30 June, 2015
- Strategy execution cost can now be calculated with budget initiatives.
- Indicator’s weight can be a floating point number, e.g. KPI’s weight like 0.2 or 1.7 is now supported.
- A possibility to save strategy map in print-friendly high resolution format.
Version 7.9. Release date: 2 June, 2015
- Notification via company’s mail server. A possibility to send out notification emails and alerts via company’s mail server. The previous versions used an account in BSC Designer Online to send out email notification. With this version you can choose between using your account in BSC Designer Online, and using mail server of your company. Check out more details in Tools > Application Options > Teamwork.
- Accumulated values on KPI tab. New columns “Accumulated value” and “Accumulated performance” for KPI tree are now available. They display the summary for KPIs without a need to generate respective reports. Customize grouping interval in File > Document Properties > Grouping. To customize grouping type (average or sum), right click on the indicator and select “Grouping type.”
- BSC Designer Online Server. BSC Designer Online can now be installed on company’s server. BSC Designer PRO can be seamlessly integrated with BSC Designer Online or Server.
- Possibility to clone strategy maps. Right click on “Strategy map” tab and select “Clone” option.
Version 7.8. Release date: 23 April, 2015
- A possibility to specify the indicator’s type (leading or lagging) for indicators that are aligned with business goals on the “Business goals” tab:
- Auto-refresh button on the “Strategy Map” toolbar allows you to switch to a manual or automatic update of the strategy map preventing user from doing unnecessary clicks.
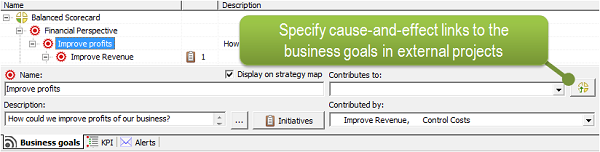
- The new “Link to the external project” button allows you to specify a cause-and-effect link to a business goal in an external .BSC project.
- In Tools > Application options > BSC Online > BSC Online Site URL it is now possible to specify the URL to the online storage BSC Designer Online or a version of BSC Designer Online that is running on a local server.
- A possibility to automatically place an organization’s vision on the strategy map
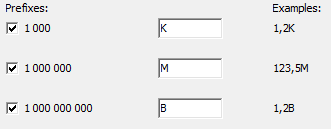
- New formatting tab in Tools > Application options > Formatting allows specifying a decimal symbol, digit grouping symbol, and prefixes:
- “Analysis” report added that will contain the results from the “Analysis” tab
- A possibility to export the content of “Dashboard” tab to an image
- A person responsible can now be assigned not only to the KPIs, but to the business goals
Version 7.7. Release date: 20 January, 2015
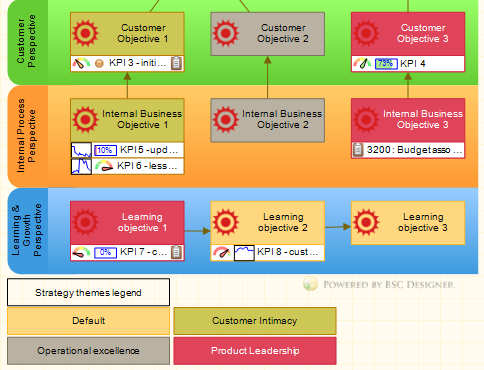
- Strategic themes for business goals and strategy map are now supported
- Collaborative work on BSC project is now supported
- Better alignment between BSC projects: specify cause-and-effect links to the business goals in external projects
- Links to the business goals in external projects are visualized on the strategy map
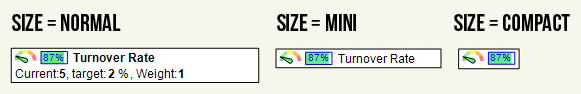
- KPIs on the strategy map now have three display modes:
- KPIs aligned with top level perspectives (Financial, Customers, etc.) are now visualized on “Balanced Scorecard” strategy map as a separate block of KPIs:
- BSC Designer no longer requires the value to be between min and max interval.
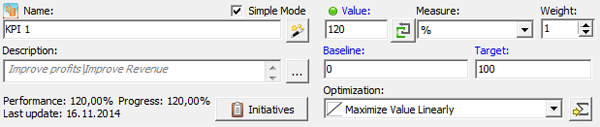
- Simple Mode for KPIs. KPI in Simple Mode doesn’t have min and max properties. Baseline and target values will be used to calculate both progress and performance.
- Excel cells with percentage formatting are now exported correctly
- Font settings (Tools > Application Options > KPIs) are now affecting not only KPI tree, but the columns of the KPI tree as well
BSC Designer Online. Update date: 17 November, 2014
- Merge function in BSC Designer was released. It now allows several participants to work on the same project simultaneously. If upon saving project some conflicting changes occur, BSC Designer Online will suggest to resolve appeared conflict.
Version 7.6. Release date: 24 October, 2014
- SQL data source now supports :UpdatePeriodStart and :UpdatePeriodEnd parameters. Example: an indicator has a monthly update interval. Select October 2014, in the calendar in BSC Designer. If BSC Designer finds :UpdatePeriodStart and :UpdatePeriodEnd parameters, it will replace them with 1.10.2014 and 31.10.2014 respectively.
- Main tabs now can be renamed. To rename the tab right-click on it and select “Customer Names.” For example, non-profit organizations might rename “Business goals” to just “Goals.”
- The colors used on the charts can now be customized in Tools > Application Options > Chart colors.
- Nice large 32×32 icons for business goal are now supported on the strategy map
- New video manual available for Reports
Improved initiatives display on strategy map:
- Initiatives can have a “Title”, if no title is specified initiative will use description or file name text.
- The list of initiatives now has “Show on map” column, if checked the initiative will be displayed below business goal on strategy map.
- Use “Move up” and “Move down” to change the order of initiatives.
- Bug fixed: strategy map printing and custom objects grouping.
Version 7.5. Release date: 26 August, 2014
- Easier alignment of objects when moving and re-sizing on the strategy map
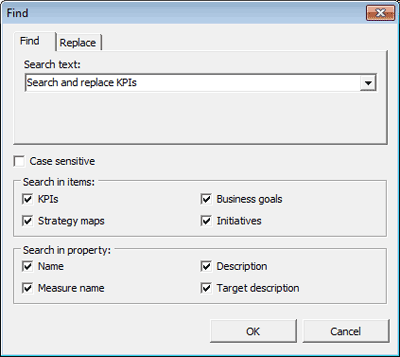
- Feature-rich search and replace functionality
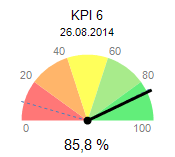
- New design for a gauge chart
- Ability to export strategy maps with transparent background
- Smarter placement algorithms for “Balanced Scorecard” type map
- More freedom in customizing objects’ style with DashStyle property
- New bar chart diagram
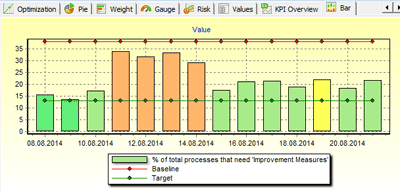
Version 7.4. Release date: 16 July, 2014
- New video manuals for the most popular functions were prepared:
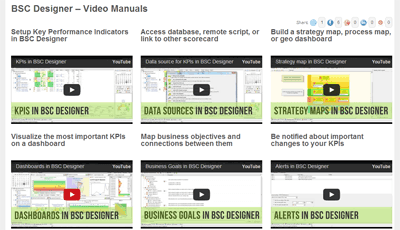
- A KPI can now be a container for other indicators. Use it to summarize the values of child items. Learn more in the video manual.
- Data source dialog helps to link your KPIs to a specific data source:
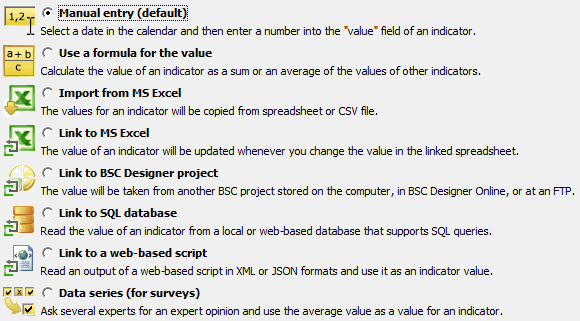
Learn more in the video manual.
- “Overview” strategy map was updated:
- Target planning wizard now supports update intervals specified in initiatives.
- Biggest/gain loss analysis added to the “Analysis” tab:
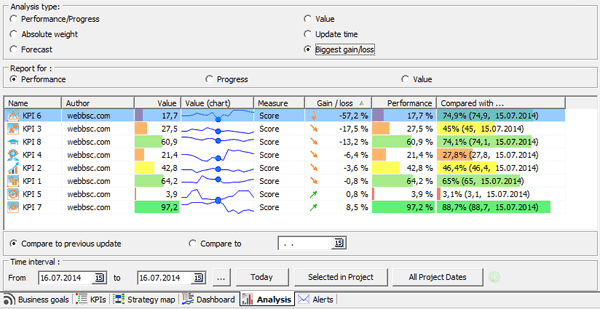
Learn more in the video manual.
- Columns in the “Analysis” tab now have a stop light background. Learn more in the video manual.
- Forecast analysis is now improved to show the interval of expected values for a time point. Learn more in the video manual.
- More default performance formulas for KPI. Easier choice of the default performance formulas:
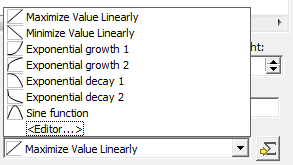
- Business goals, KPIs, strategy map tabs redesign.
- Updated video manuals added.
- Localization support was improved.
BSC Designer Online. Update date: 2 April, 2014
- Radar chart added – displays performance data for categories with more than 2 indicators;
- Analysis tab added – allows to find poor performing indicators and indicators with highest absolute weight.
Version 7.3. Release date: 2 April, 2014
- Initiatives report updated with many features.
- New type of indicator to access XML and JSON formatted output, use it to access external data sources.
- “Business goals report” shows strategy map, all business goals and linked KPIs.
- “KPI structure report” shows all KPIs and their categories with details.
- Initiatives of “comment” and “remark” type can now be associated with diagrams.
- Initiatives are now displayed in reports.
BSC Designer Online. Update date: 28 January, 2013
- The long awaited Excel report is now available in BSC Designer Online. It is similar to what you have in a desktop edition. A .BSC project can be exported to an Excel spreadsheet where formulas together will your values will be used for calculations.
Version 7.2 Release date: 24 January, 2014
- Any HTML report can now be published to company’s FTP server.
- “Balanced Scorecard” type of the strategy map was improved. Now you’ll need a few less clicks to rebuild a strategy map.
- A Dashboard function is improved in BSC Designer. Now on a dashboard one can combine charts that depend on selected KPI and charts that are fixed to a single set of KPIs.
- A new type of record “Person responsible” added to “Initiatives.”
BSC Designer Online. Update date: 14 January, 2013
- Plan target values feature was added. It works similar to what we have in BSC Designer PRO.
- As in PRO edition, it is now possible to specify a case-and-effect connection between business goals.
- It is possible to build up strategy map automatically. The supported type of the strategy map is “Balanced Scorecard.”
Version 7.1. Release date: 17 December, 2013
We have a very positive feedback from our old users about the latest update of BSC Designer. In version 7.1 you will find even more useful features for using a strategy map.
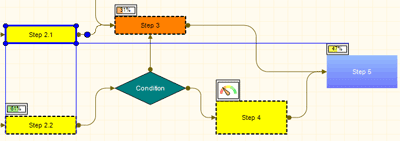
- In 7.0 BSC Designer was able to create a strategy map automatically by using information about your business objectives and making an alignment between business objectives and KPIs. The result always looks nice, but in most cases it needs to be customized according to specific requirements. In the new version there is a “Pin” button that will fix the state of the object. The next time BSC Designer will rebuild a strategy map and it won’t change the position and the visual style of the pinned objects. This applies to business objectives, KPIs and links. In this way you can always use BSC Designer’s placement wizard to automatically put all of the objects on the strategy map and customize the map according to your needs. BSC Designer will remember the customization for pinned items and won’t change them during the next rebuild.
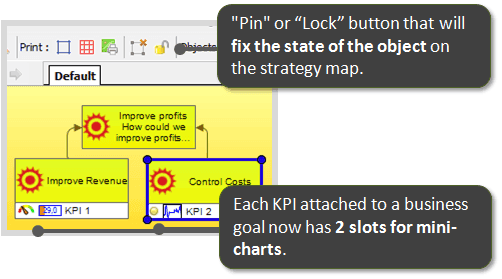
- Each KPI is attached to a business goal and now has 2 slots for mini-charts. For example, you can use a stoplight and a progress baror a gauge diagram with a value chart. To customize these settings select a KPI that is attached to a business objective on the “Business Goals” tab and select appropriate charts and diagrams in the drop list.
- We changed the order of the tabs. We have changed the order of the tabs below. Now the first tab is “Business goals,” then you have “KPIs” and then is a “Strategy map.” It looks like a small cosmetic change, but it is really important as the Balanced Scorecard starts with business objectives, not with KPIs.
- In the previous version we had a fixed default dashboard that displays data for the selected KPI and adds a possibility to add custom dashboards for specific KPI items. In the latest version you have a single dashboard where you can add diagrams and charts according to your needs. For example, you can add a “Performance” diagram for a specific KPI. And you can add another “Performance” diagram that will display the data for the KPI selected in the list on the left.
Version 7.0. Release date: 3 December, 2013
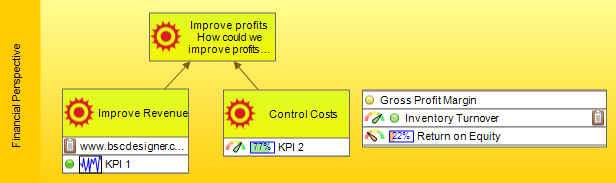
- Cause-and-effect links supported. Now if you choose a business goal you can specify what this business goal contributes to.
- Business goals are now multi level, in older versions you could attach KPIs only, but now you can attach an initiative document to a business goal as well.
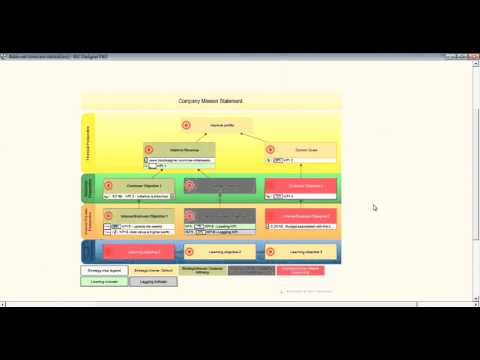
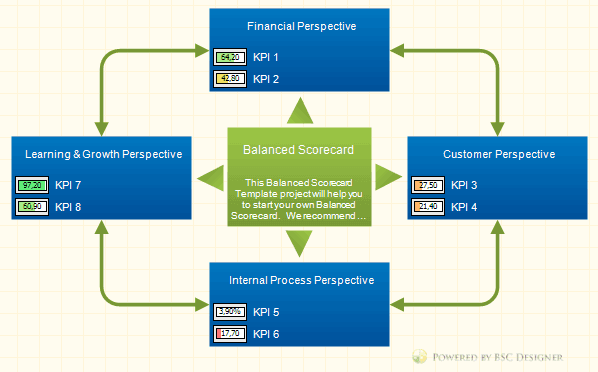
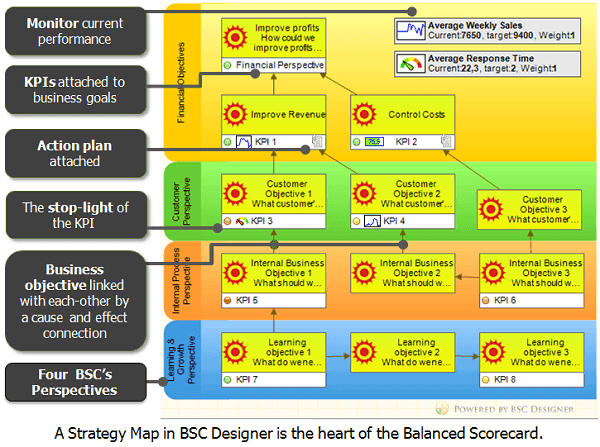
- Build a strategy map for the Balanced Scorecard. BSC Designer can now build a strategy map for the Balanced Scorecard automatically. It creates first level perspectives and places them within the business goals. It uses cause-and-effect links between business goals and connects them accordingly.
- There is a new formula button next to KPI target field. It allows to plan value growth according to your strategy.
- Alerts. There are new tab Alerts. They are used to send out notifications about important changes of KPIs. To enjoy this feature you need to have a BSC Designer Online account as BSC Designer Desktop uses it as a mail server.
- Placement wizard is updated. Strategy map placement dialog was updated. The most popular placement styles are now on the main tab now, and you can still use other placement styles, and they are on the “Others” tab now.
- On the “Strategy Map” tab you will find two buttons that allows creating a few business goals and assigns a KPI to them. In this way you won’t need to switch from a strategy map tab to business goals just to create a new business objective.
- Business goals with KPI. BSC Designer will show KPIs linked to business goals automatically by adding a KPI line under the business goal body. This is especially useful if you want to use the strategy map of the Balanced Scorecard as a hybrid of a dashboard and a scorecard.
- BSC projects with ready-to-use KPIs included: HR KPIs, Employee Engagement, 7-S Framework.
- Integration with BSC Designer Online is improved. Now if you work with documents stored in BSC Designer Online you need to do few less clicks to be able to access them
Version 6.9. Release date: 14 October, 2013 – the full support of storing your projects in BSC Designer Online.
- BSC Designer Online – strategy maps editor
- Support of strategy maps designed in BSC Designer Online.
- Minor problems with business goals fixed
Version 6.8. Release date: 14 June, 2013 – full integration with BSC Designer Online.
- Ability to import indicators from BSC Designer Online projects
- Ability to import projects from BSC Designer Online
To access new features click “New imported indicators” button on the toolbar and go to the “BSC Online” tab.
Version 6.7. Release date: 27 April, 2013 – store and manage your Balanced Scorecard projects online
- BSC Designer (desktop) is now able to connect to BSC Designer Online. You can store your projects in online version, view and edit them online and when advanced editing is needed you can check out the project with BSC Designer PRO (desktop). To use new function select Check in or Check out options in File menu of BSC Designer PRO.
Version 6.6. Release date: 8 April, 2013
- Possibility to add custom icons to KPIs or choose any icon from BSC Designer’s library – this allows to make your Balanced Scorecard visually appealing and give it professional look. Select KPI, find below “Name” edit box, next to “Name” there is an icon. Click on it to change it.
![]()
- Rich library of professional icons designed for BSC Designer Users
Version 6.5. Release date: 21 February, 2013.
![]()
- New icon collection available for all users;
- Now the icon of any KPI and the category can be customized;
- Strategy map preview for better Android integration. Use check box “”Save graphical copy of strategy map in BSC project file” located in File > Document Properties > Main. Saved maps will be available when opening BSC file on Android device.
- Strategy map exporting bug fixed
- Linking indicator to the value in Excel improved. Now BSC Designer scans Excel file showing available named range and match with indicator name. Now source cells in Excel file can be selected in a visual way. Access new function by selecting indicator and clicking “f” button next to the “Value” field.
- Business Goals tab improved. Now business goal and solutions have description.
- Initiatives can be attached to business goal or solution. These initiatives can be displayed in Initiatives report.
- Balanced Scorecard Wizard improved.
- Map with KPI improved with gauge and performance views for items; additional template maps added;
- Live info-graphic sample: 360-Degree Feedback;
- Live info-graphic sample: Hotel KPIs;
- Restyled html reports;
- Ability to link business goals to the map with KPI.
- Improved algorithm for GEO maps, now BSC Designer can automatically detect regions on the map.
- Initiative report added, now you can generate a report for all initiatives, as well as generate reports for the latest initiatives added or updated in BSC Designer.
- Importing single values from Excel – now a user can click “Formula” button next to “Value” field to link certain KPI with some value in Excel file. Flexible wizard provides different ways to specify this link.
- Online activation of BSC Designer license is now released, as well as manual activation via email.
- Geo mapping. Ability to load map of the country or any other image and link KPIs to certain locations on the map. Read more in the online manual.
- Custom stop-lights in BSC Designer. Now there is a small stop-light icon next to the indicator or category name. Click this icon to customize stop-lights value for certain indicator;
- Automatic update of baseline value. In Document Properties (menu File > Document Properties) you will find a new “Baseline” tab, where you can specify how the baseline value is updated. For example, a baseline can be set automatically equal to the value of the previous time point.

- New chart “Values” is now available in BSC Designer. This chart is a table that displays indicator’s values for certain dates;
- “Diamond” chart improved, now the chart will display information for categories with 1 or 2 indicators, as well as for the root category with many indicators.
 chart in BSC Designer")
- Naming of images in HTML reports updated, now file names are fixed, it will be easier now to integrate images from HTML reports generated by BSC Designer into 3rd party applications.
- HTML reports can now include company name, contact data and logo. Check Tools > Application Options > Company Info tab.
- Now a user can select any indicator, click “Initiatives” button and add budget or time initiative. Also, there is a new report that shows each indicator with its budget and time initiatives, as well as calculates the total budget for the project. Read more about budget and time initiatives.
- COM server allows flexible integration of BSC Designer with 3rd parties. Check examples in COM folder.
- QR-codes in BSC Designer allow you to quickly read a link in any mobile device.
- Integration with Google Calendar and Google Tasks. Select any indicator or category, click “Initiatives” button. Now you can click “Add to Google Calendar” or “Add to Google Tasks” button.
- Improved PowerPoint report now includes indicator’s description, target, initiatives; indicator’s captions now change color according to stop-light color for the indicator in the project.
Version 5.4. Advanced dashboard report. Now user can export custom dashboards to html report. Release date: 14 January, 2012.

Version 5.3. New version with custom dashboard – users are able to add diagrams for any item to the dashboard. Release date: 26 December, 2011.
Version 5.2. Strategy map for cascading projects + function to stop delegating indicators. Release date: 24 November, 2011.
- Strategy map for cascading projects and cascading indicators. Use “Placement Wizard” to create new types of strategy maps;
- Ability to stop delegating of indicator or category. Right click on delegated category or indicator and select “Stop delegating;”
Version 5.1. Ability to work with data series is now provided. Release date: 7 November, 2011.
Version 5.0. Custom measure units with text values are now supported. Release date: 30 October, 2011.
Version 4.9. Link width on strategy map depends now on item’s weight. Release date: 22 October, 2011.
Version 4.8. Enter data by months or years. Release date: 13 October, 2011.
- It is now possible to right click the calendar in BSC Designer and adjust it to enter data on weekly, monthly, quarterly, yearly basic.
- Data for charts can now be grouped by time period. Program can use for the time period the sum, max, min, average.
Version 4.7. Indicator formulas. Release date: 11 September, 2011.
- Values of indicates can be calculated as sum of values other indicators.
- Some indicators can be ignored.
Version 4.6. Indicators’ update control released. Release date: 20 May, 2011.
- User of BSC Designer can now specify required update interval in days for each indicator;
- Indicators that should be updated today and indicators that were not updated on time will be marked in the Indicators tree;
- It is possible to assign update interval in indicator using only PRO version. In Standard version update interval is in read only mode;
- The new type of analysis on the “Analysis” tab allows managers to find indicators that were not updated on time;
Read more about Indicators’ Update Information.
Version 4.5. UNICODE + Business Goals Manager. Release date: 01 February, 2011.
- UNICODE support, you will be able to type in your national encoding in BSC Designer, even if this locale is not installed in Windows.
- Business Goals tab, which includes the tree structure of business goals, business solutions and attached indicators;
- New strategy map objects and new look of strategy maps arrows;
Version 4.4. Delegation of several indicators. Delegation of the value only or the full delegation. Delegation into existing project with indicators. Release date: 23 December, 2010.
Version 4.3. Ability to delegate single indicators released. Progress bars and gauges added to the strategy map objects. Release date: 13 December, 2010.

Version 4.2. Chinese localization, export function updated (parent column added), dashboard updated (it is possible now to customize the set diagrams at the dashboard). Release date: 8 December, 2010.
Version 4.1. Analysis and forecasting released in PRO edition. Release date: 25 November, 2010.
Version 4.0. Grouping data by time periods released in both – Standard and PRO edition. Release date: 1 November, 2010.
Version 3.5. Risk diagram and risk reports, Strategy maps released. Release date: 25 August, 2010.
Version 3.0. Strategy maps released. Release date: September, 2009.
Version 2.0. Custom formulas, SQL indicators, released. Release date: May, 2009.
Version 1.5. Basic KPI Management and HTML report released. Release date: October, 2008.
Version 1.0. Brand new release based on Strategy2Act software. Release date: September, 2007.
BSC Designer is strategy execution software that enhances strategy formulation and execution through KPIs, strategy maps, and dashboards. Our proprietary strategy implementation system guides companies in practical application of strategic planning.