Banks can no longer base their strategy on financial indicators only. In this article, we will build a Balanced Scorecard for a typical retail bank. We will analyze emerging trends, possible response strategies, and relevant KPIs.
The content of the article:
![]()
Any business is about trust, and retail banks are losing points. The main competitors are the FinTechs companies. Learn more >
![]()
Mission statement, financial goals and KPIs, customer perspective KPIs, internal perspective, learning and growth perspective. Learn more >
![]()
Publicly available KPIs and strategies of the largest banks. Learn more >
Emerging Challenges for Retail Banking
Let’s have a quick look at the emerging challenges of a retail bank.
Any business is about trust, and retail banks are losing points.
The main competitors are the FinTechs companies that:
- Provide better user experience via smartphone apps and modern websites.
- Have a more transparent and, in many cases, more competitive pricing. Take money transfer, for example, where the adoption rate of FinTech1 increased up to 50% in 2017 with 67% anticipated for the next periods.
- Gain a part of customer’s trust2 by sharing unbiased financial advice via excellent online content.
- Understand customer needs and behaviour3 faster and more effectively having a big-data mindset in their DNA.
Retail banks:
- Still have a power of brands and offline presence.
- Still win in the niche of “keeping money safe” services.
What strategy can a financial organization develop to address these challenges? How can you describe and translate this strategy across the organization? How can you execute this strategy successfully?
One of the proven options is a Balanced Scorecard approach. Below, we will discuss how to capture the most important goals on the strategy map and track their execution by finding the best Key Performance Indicators.
Retail Banking Balanced Scorecard with KPIs
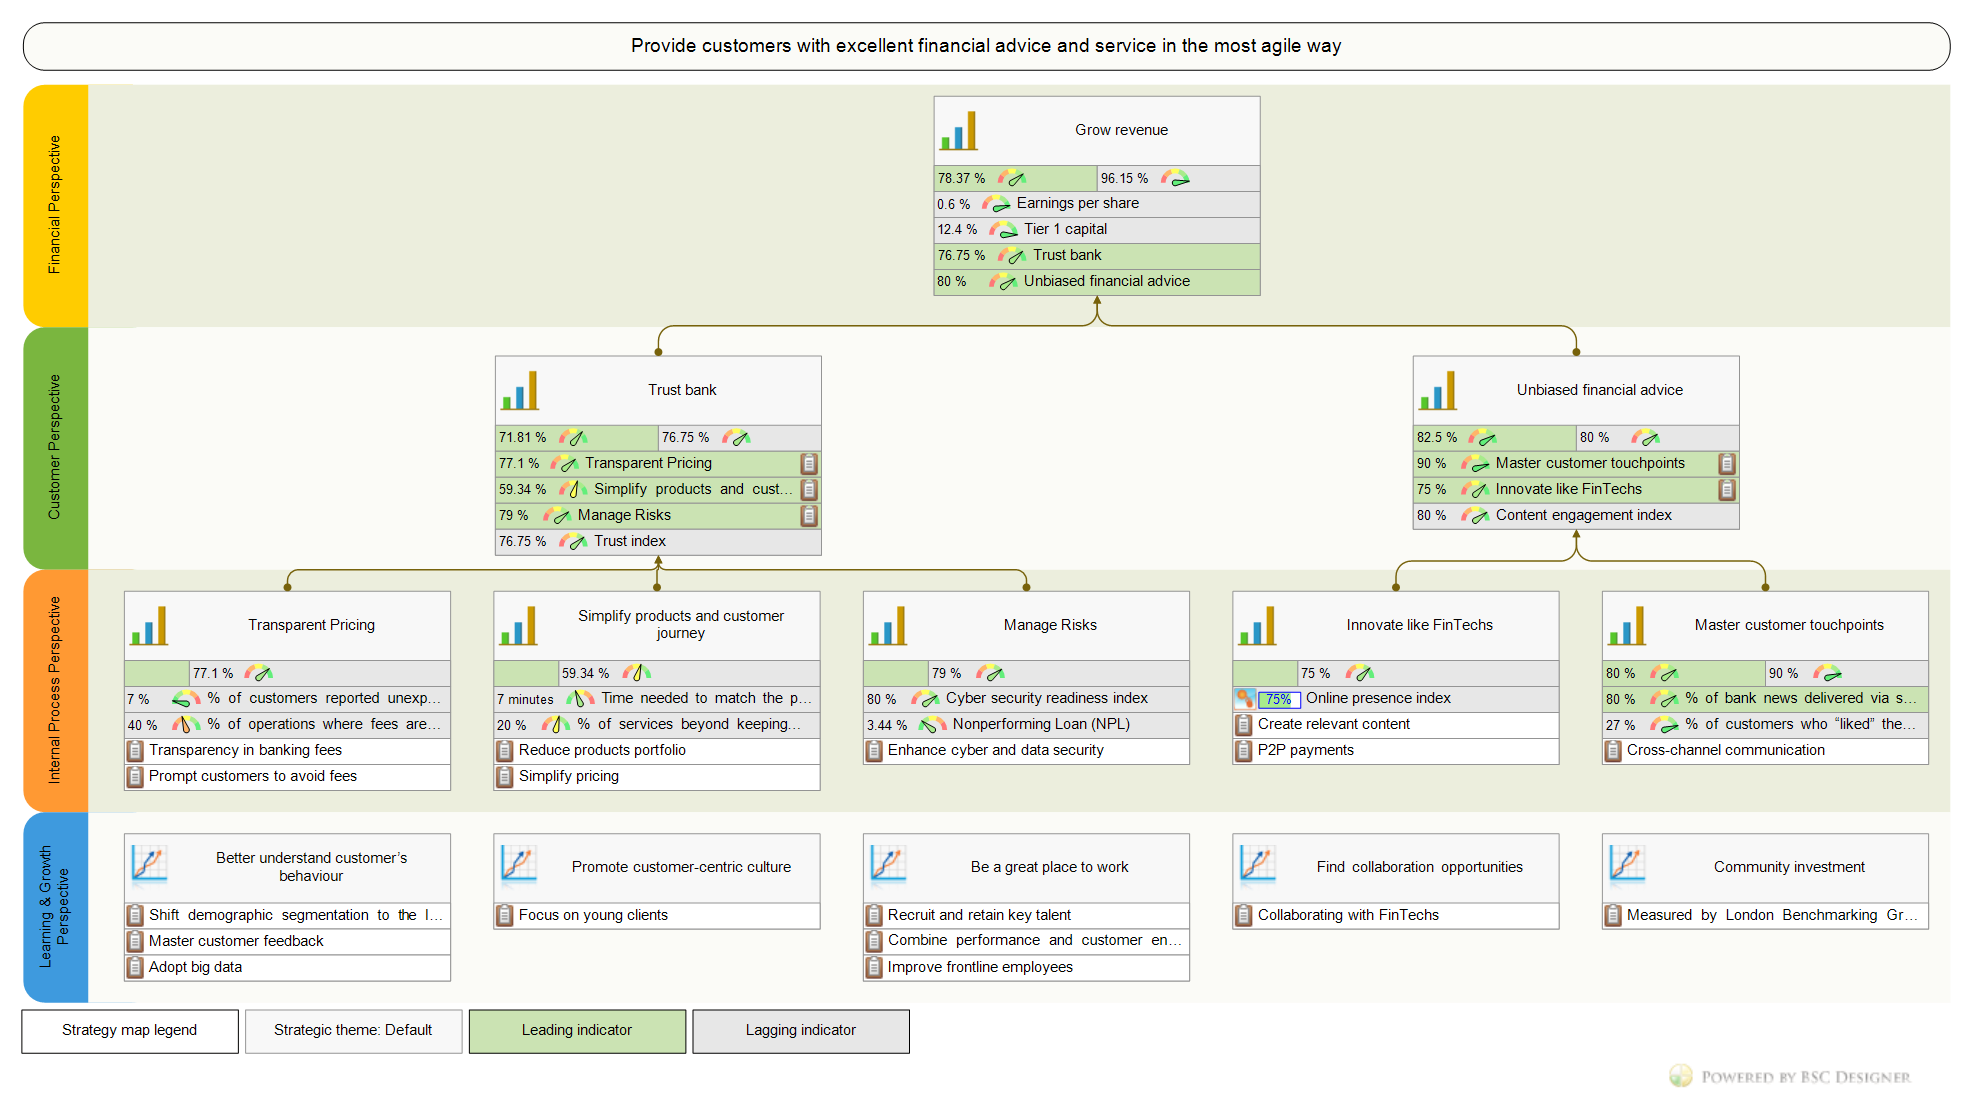
Let’s map the typical challenges mentioned above to the Balanced Scorecard strategy map. I’m going to use BSC Designer software to map the goals and align KPIs with them.
We will follow this plan:
Mission Statement
An inspiring mission statement is a must for a strategy map. In looking at the emerging challenges, we can conclude that a mission statement that focuses only on “keeping money safe” would be outdated. The focus has shifted from providing basic banking services to gaining trust and building a deeper relationship with clients.
For example, this mission statement might be a good starting point:
Provide customers with excellent financial service and advice in the most agile way
The strategy of the retail bank should be customer-centric, and it’s a good idea to underline this focus from the very beginning. For example:
- Bank of America repeatedly translate4 their purpose as “help make our clients’ financial lives better through the power of every connection we can make.”
- Barclays expressed a similar idea in a more dynamic way – they formulate their purpose as “Creating opportunities to rise.”
ING did even more; they formulated their mission as “empower people to stay a step ahead in life and in business.” And they actually track and report on the number of empowered customers (see the bank’s reference for the full list of ING’s KPIs).
Financial Perspective Goals and KPIs
Financial organizations have already implemented sophisticated KPIs for finance, so we’ll review the topic of ![]() financial metrics briefly.
financial metrics briefly.
A starting strategic goal for this perspective is:
- Grow revenue or
- Sustainable growth
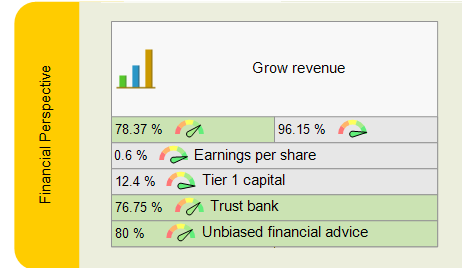
The classical measures in this case are:
- Tier 1 capital = Equity Capital / RWA (Risk-weighted assets). Bank’s core financial measure from the regulator’s point of view.
- Revenue (benchmark data for the largest financial organizations)
- Profits
- Noninterest expense, Interest expenses
The way the metrics are calculated might vary from bank to bank. For example, here are the KPIs for Deutsche Bank’s strategy where they focus their adjusted costs indicator on “noninterest expenses excluding impairment of goodwill and other intangible assets, litigation and restructuring and severance.”
A number of additional metrics could help to understand the bank’s financial health better:
- Return on Equity (ROE) = Net Income (Annual) / Shareholder’s Equity. Shows how well a bank uses investments. Similar to ROE: ROAE – Return on Average Equity.
- Return on Assets (ROA) = Net Income (Annual) / Total Assets. Shows how well a bank uses its total assets.
- Net Interest Margin (NIM) = (Investment income – Interest expenses) / Average Earning Assets. Shows how bank assets are performing.
- Nonperforming Loan (NPL) = Nonperforming loans / Total loans. The loan can be considered as non performing if the regular payment deadline was missed by 90 days. The benchmark value varies depending on geography. The world’s average in 2017 was 3.44%.
- Net Charge-off (NCO) = Total amount of loans in charge off / Total Loans. Shows the percent of debt owed to the bank that is unlikely to be recovered.
- Loan-to-deposit Rate = Total loans / Total deposits. Shows the bank’s ability to cover withdrawals.
- Efficiency Rate = Operating (noninterest) Expenses / Net Revenues. Indicates expenses as a percentage of revenue.
The Best Approach for the KPIs
The best approach for the KPIs (including financial ones) would be to formulate your strategy first, and then try finding the right way to measure it. I’ll demonstrate how to follow this approach below, and we also have a KPI System that helps to find the best KPIs for the most challenging business situations.
I would like to warn business professionals from copying the KPIs from some long lists. KPIs that are not aligned with an organization’s strategy will do more harm than good.
Still, in many cases, it’s a good idea to review what metrics other players use. For this purpose, at the end of the article, I’ll share a list of the largest banks with references to their KPIs.
Customer Perspective Goals and KPIs
The goals in the ![]() Customer perspective should answer the question “What clients want from our organization?” Reflecting the trends discussed above, we can formulate two strategic goals from a customer’s point of view:
Customer perspective should answer the question “What clients want from our organization?” Reflecting the trends discussed above, we can formulate two strategic goals from a customer’s point of view:
- Trust bank
- Unbiased financial advice
How to Quantify and Measure Trust in a Financial Organization?
We can start with a simple survey question:
- “On a scale from 0 to 10, how much do you trust your bank?”
Or build an index value using customer estimations of a bank’s:
- Competence,
- Stability,
- Transparency, and
- Value congruence
as authors of Banking System Trust5 suggested.
There are two main problems with such trust index:
- It is perception-based, not action-based. People might rate their trust to a bank highly but still move their money to another financial institution.
- It is lagging in its nature. It tells us a story of what has happened but doesn’t give a clue how to change the situation.
Action-Based Trust Index
If we want to address the “perception” problem, we need to formulate the questions that allow focusing on the action (more objective) part of the trust: if people don’t trust some operations to the bank, they fulfill their needs in some other way.
Quantify a trust index on questions like this:
What financial services have you used within the last three months that were not provided by the bank?
The quantified answer might be converted into this metric:
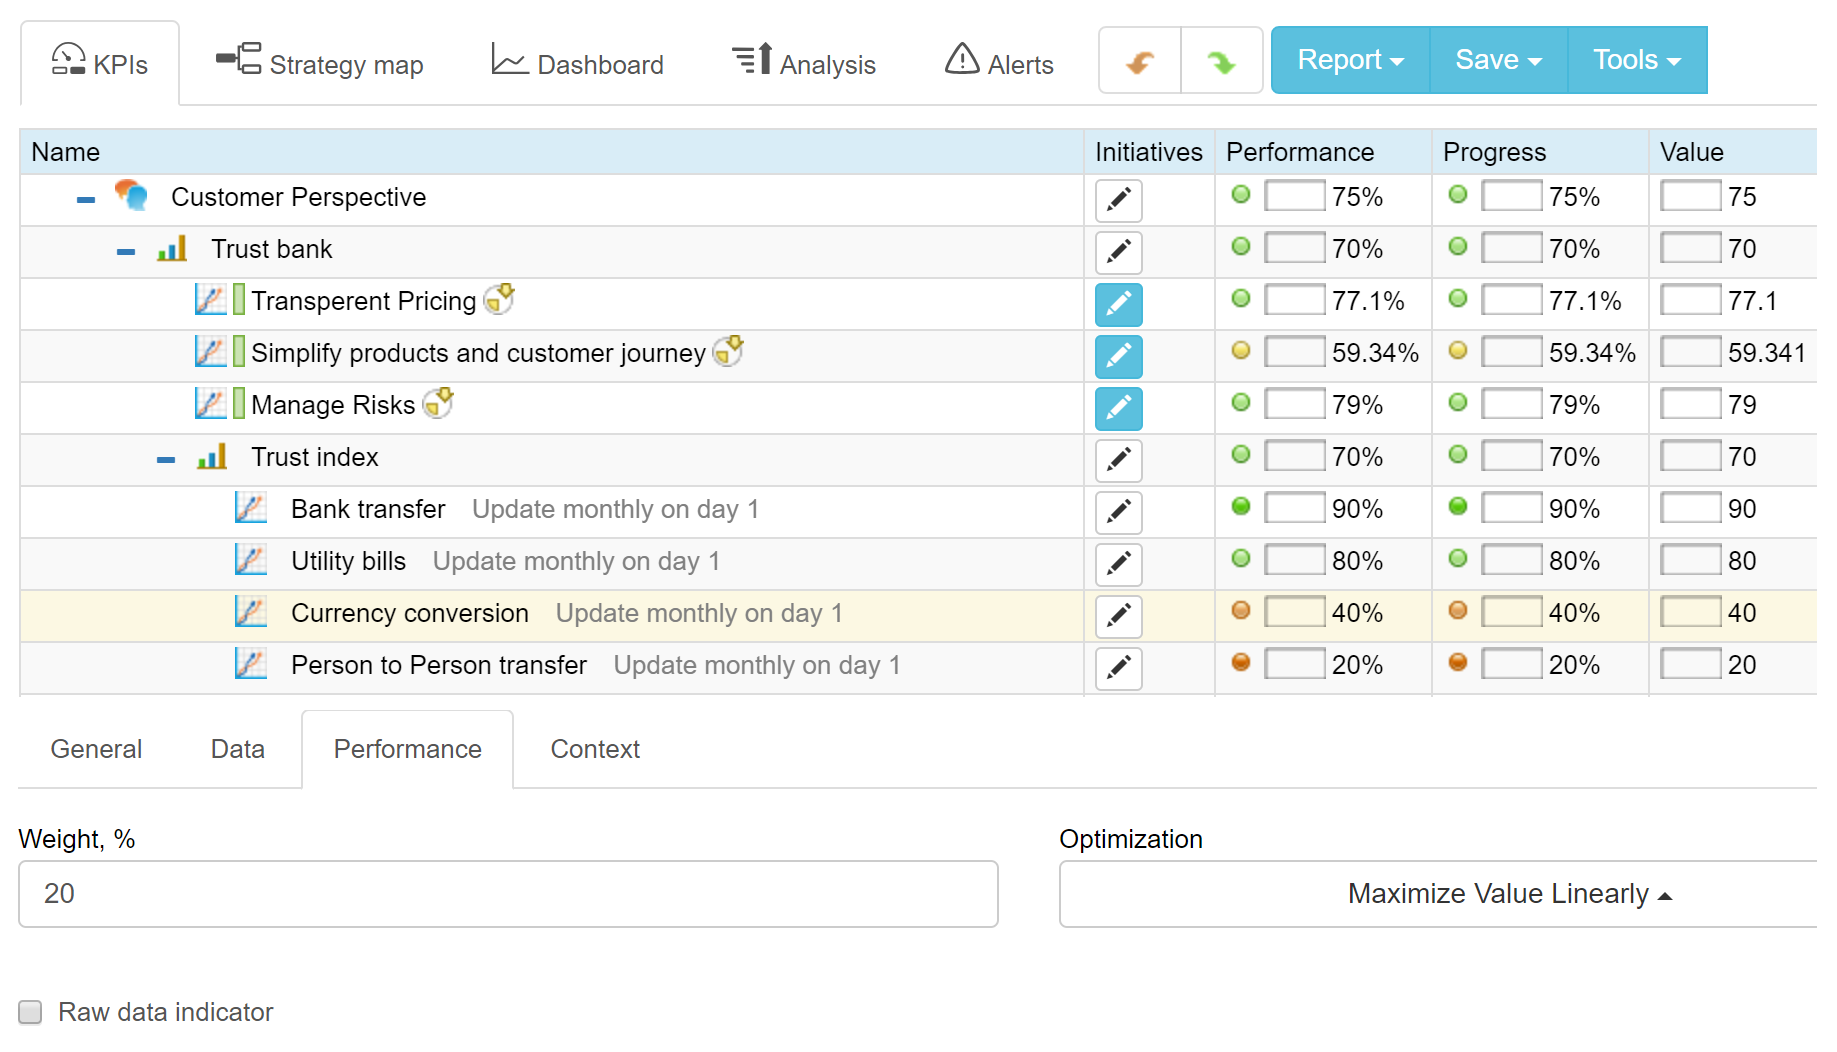
- Trust index, % = Operations provided by bank / Total number of financial service opportunities
Various financial operations can be taken into account with different relevant weight. For example:
- Bank transfer (Weight 40%)
- Paying utility bills (Weight 30%)
- Currency conversion (Weight 20%)
- Person to Person transfers (Weight 10%)
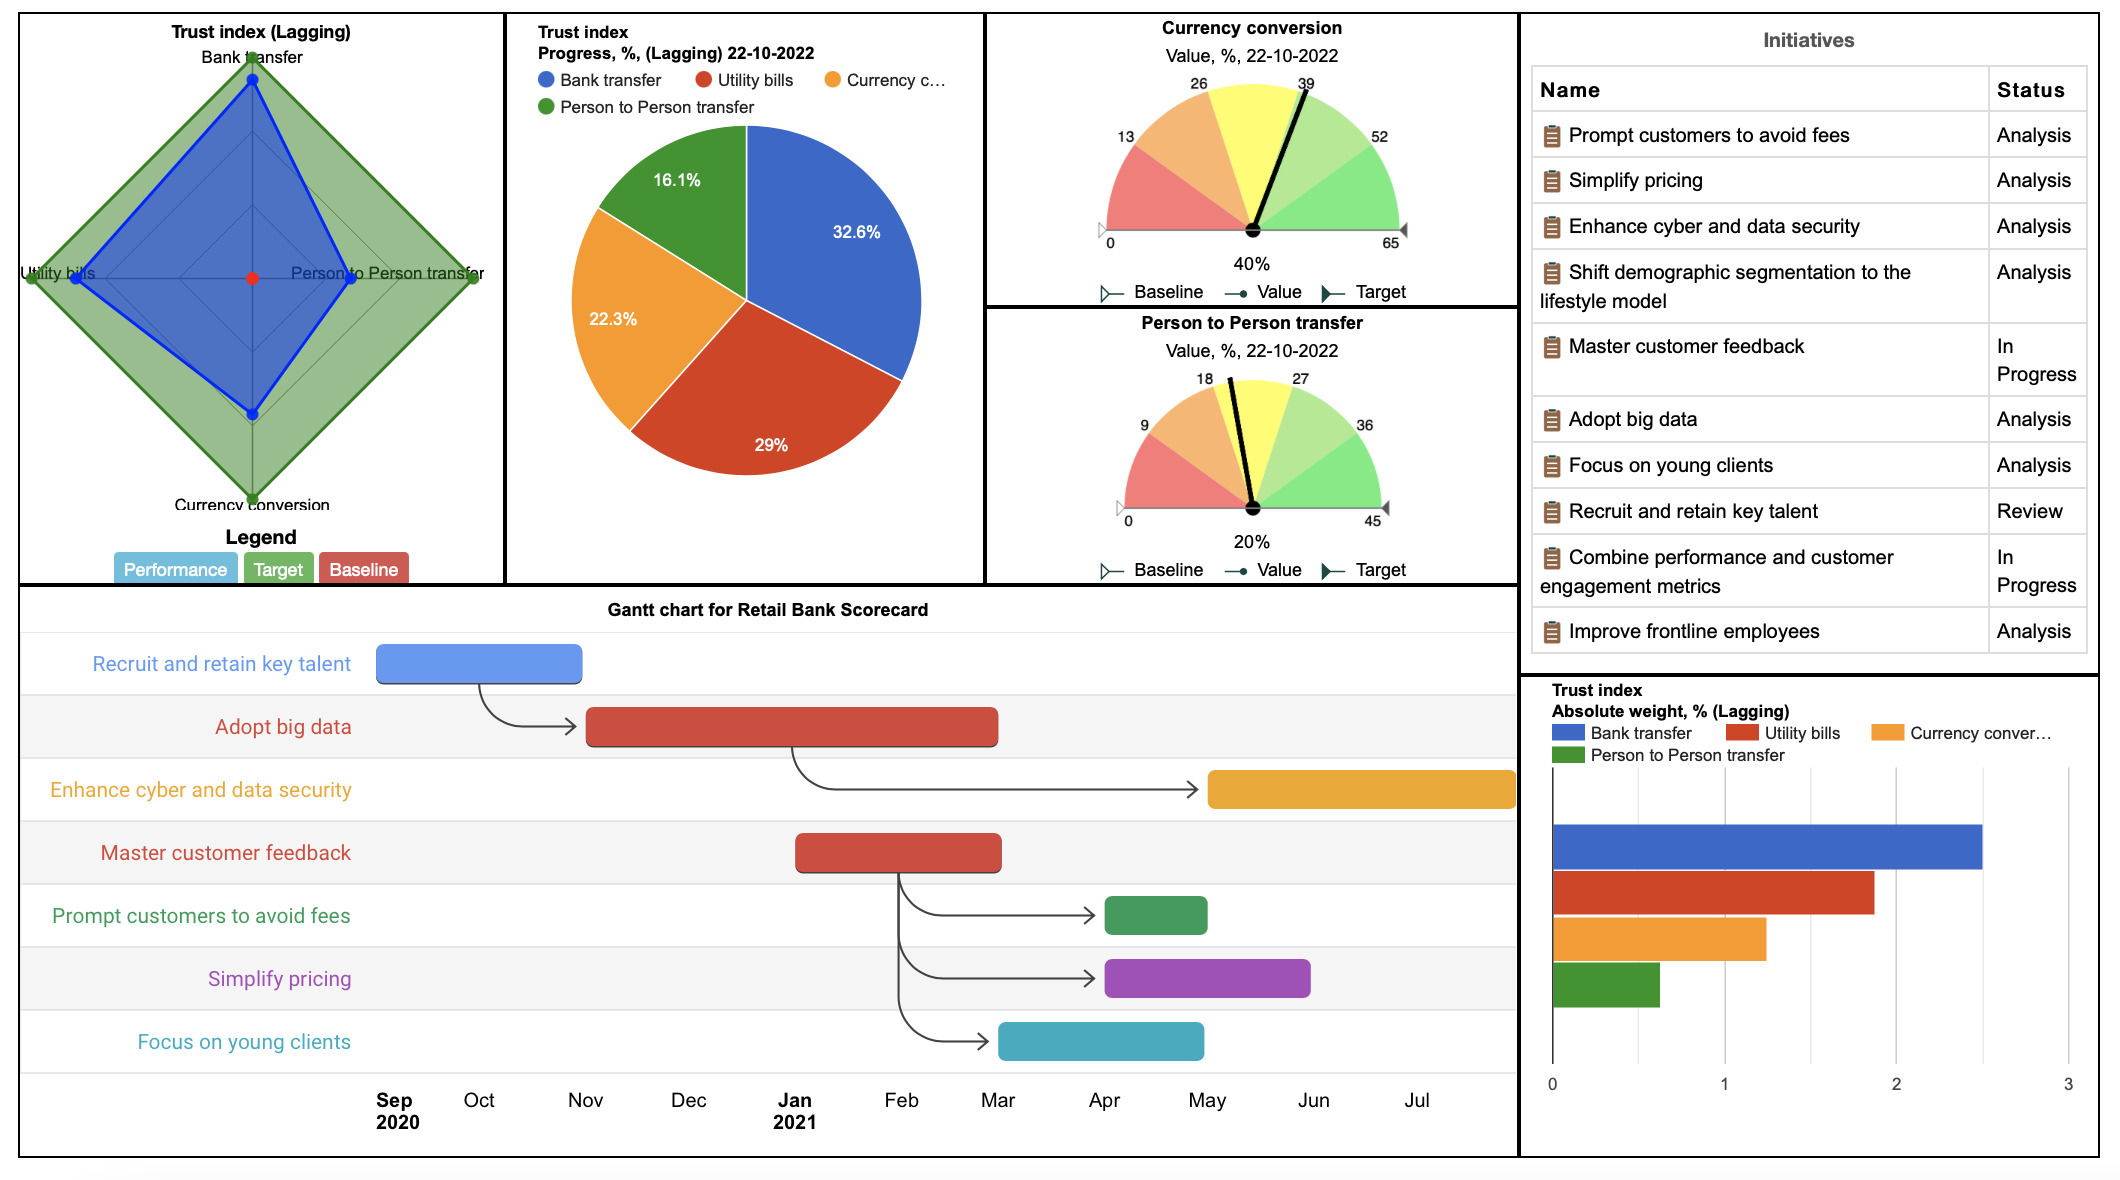
Now, we can fill in each metric with a percent of operations fulfilled by the bank. If the bank fulfilled all the operations, the trust index will be 100%. Let’s take some realistic numbers, for example:
- Domestic Money Transfer – 90% operations fulfilled using bank
- Utility bills SEPA payments – 80% operations fulfilled using bank
- Currency conversion – 40% operations fulfilled using bank
- Person to Person transfers – 20% operations fulfilled using bank
The weighted average of the values of all metrics, in this case, is 70% which gives us a number for the bank trust index.
In this example, we see that the bank did not gain the trust of its customers to provider P2P transfers, but the weight of P2P transfer in the total trust index is low. Following the example, if P2P payments become popular next year, then the bank will need to reflect this in the weight of this factor in the index, and respectively try to gain customers’ trust to provide this service.
Other Customer Metrics
Off course, we can track some classical customer metrics, like for example, suggested by PWC for banking domain:
- Customer penetration
- Customer retention
While it is useful to have these metrics on the corporate dashboard, their lagging nature might be a problem. For example, decreasing customer retention is a very strong signal, but it might be too late to rebuild trust with customers.
Measuring Unbiased Financial Advice Goal
What about “Unbiased financial advice” goal? The leading part will be connected to the lagging indicators from the “Internal” perspective.
What about the lagging part? How can we validate if customers are contacting the bank for financial advice?
The lagging part will depend on the results from the “Internal” perspective.
Instead of looking at short-horizontal lagging metrics, we will need to understand the long-term impact of the goals from the Internal perspective.
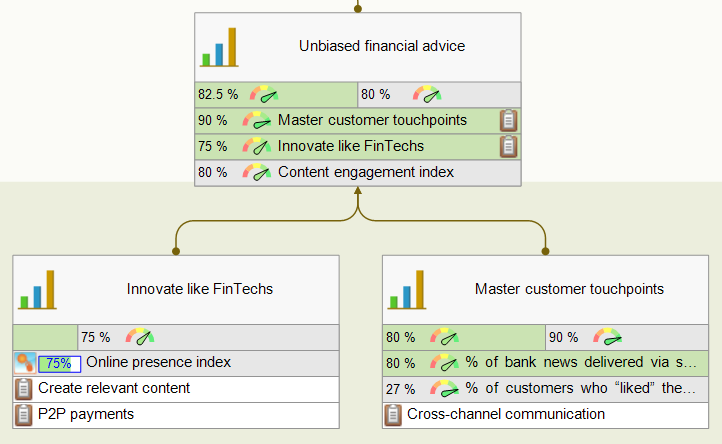
Let me illustrate this idea with the “Innovate like FinTechs” goal from the Internal perspective. It is linked to the “Unbiased Financial Advice” goal in the Customer perspective. One of the proposed initiatives for the “Innovate like FinTechs” goal is “Create relevant content.”Thinking in the context of “Create relevant content,” we can define two lagging metrics:
- A short-term lagging metric (a process output), for example, the number of qualified blog posts (appropriate words count number, relevant topics, good writing style) created quarterly.
- A long-term lagging metric – engagement index, that can include social media metrics, such as average reading time, % of re-shares, and likes.
The short-term lagging metric will tell the bank’s team if they did a good job creating content; the long-term lagging metric will work as an indicator of a long impact.
Following this logic, we can align the Content engagement index (a long-term lagging metric for “Create relevant content”) with the “Unbiased financial advice” goal as a lagging metric.
Financial Empowerment Example
ING is an excellent example of how a bank can convert the idea of giving unbiased financial advice into practice. They focus their activities on financial empowerment. They do it by supporting various initiatives from helping deaf customers to providing forecasting tools.
The “Number of customers that felt financially empowered” is reported among other non-financial metrics in their annual report.
Different Types of Customers
It also makes sense to discuss who are the customers of the bank.
For example, Bank of America in their report for shareholders focuses on three types of customers:
- People
- Companies, and
- Institutional investors.
Internal Perspective Goals and KPIs
In the ![]() Internal Perspective, we discuss how the needs of the customers can be fulfilled.
Internal Perspective, we discuss how the needs of the customers can be fulfilled.
Internal Goals to Support the “Trust Bank” Goal
According to the EY report, the main trust factors named by the customers were:
- Transparent bank fees
- Complexity of the provided products
- Data security
A response from the bank should focus on these factors.
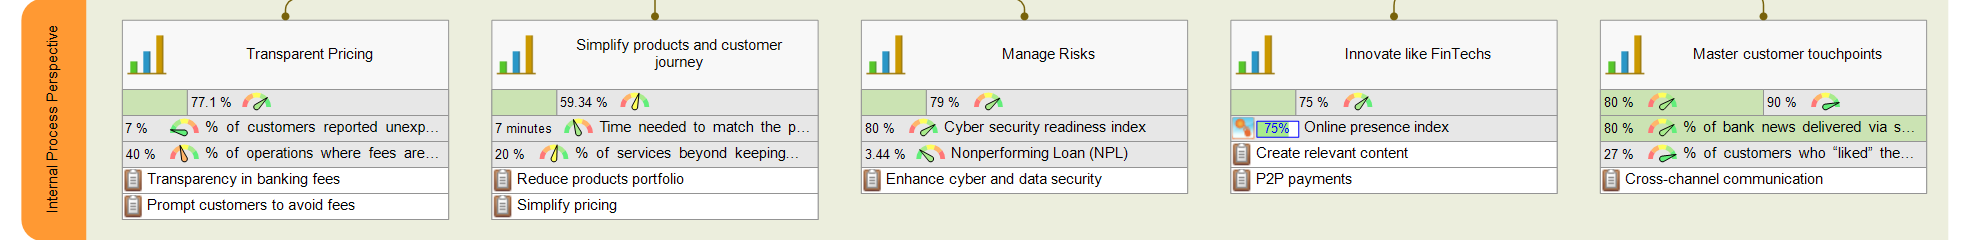
Transparent Pricing
The first goal can be formulated as:
- Transparent Pricing
With initiatives:
- “Transparency in banking fees” and
- “Prompt customers to avoid fees.”
I believe most banks already have their pricing information available to the customers, but here we are talking about easier access to this information at the right time.
Let me ask you a question:
As a customer of a bank, have you ever faced a situation when you saw some “fee” in your monthly statement, but you had no idea why you had it there?
That’s the touchpoint where FinTechs do much better than banks. Compare the experiences of money transfer via a typical FinTech app and a bank transfer:
- The FinTech app calculates and shows a transfer fee beforehand.
- In the case of bank transfer, the fees will be seen a few days after the transfer was made.
The same can be said about other fees. FinTechs are good at communicating their conditions, such as:
Use this card at least 3 times within the quarter and it will be free for you.
They also prompt you about upcoming fees and explain how to avoid them. In the case of the bank, that’s a great opportunity to be more transparent with their clients.
How can a bank measure its results of achieving this goal? We can measure an output of the implementation process, e.g.:
- % of operations where fees are shown beforehand
Or we can do a better job and connect this indicator to the “fee-related” questions asked to the call center:
- % of customers reported unexpected bank fee
In this case, the optimization of the metric is “less-is-better.” We aim to minimize the value of the indicator to achieve the “Transparent pricing” goal. Respectively, the less fee problem customers have, the better the performance of the goal.
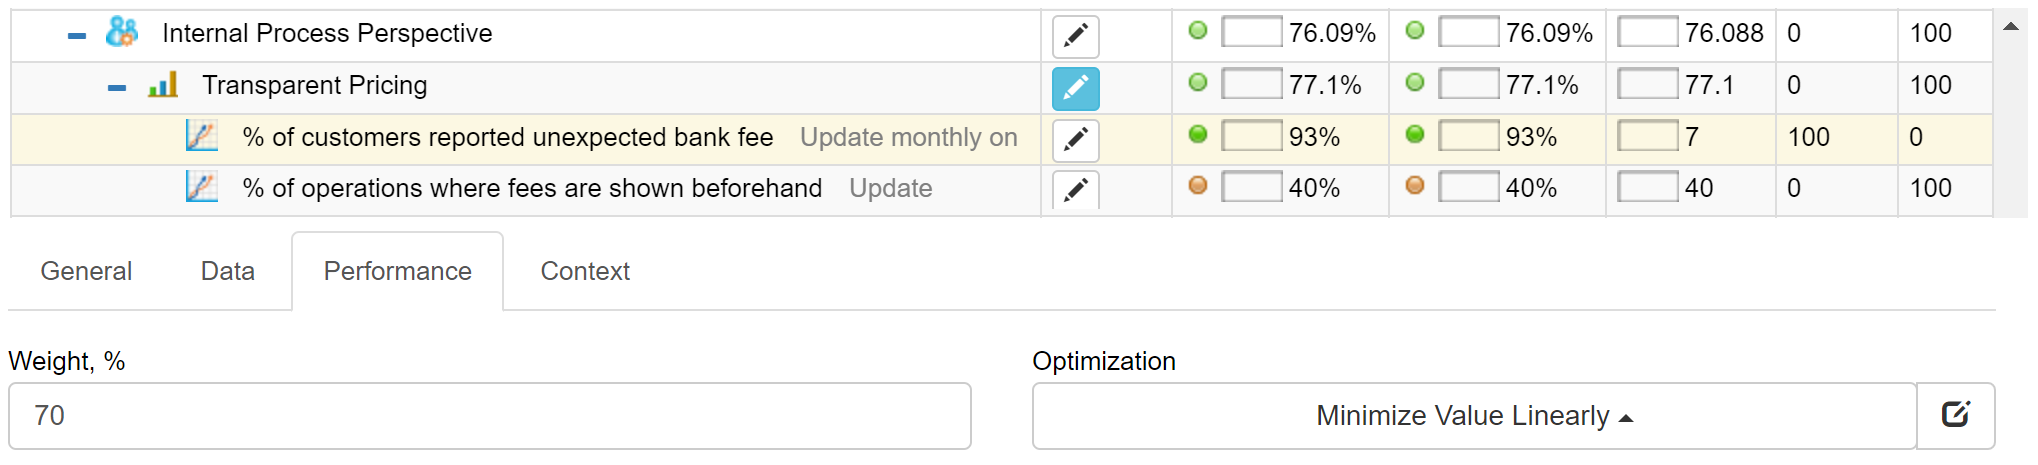
In my case, BSC Designer does all the necessary calculations for me.
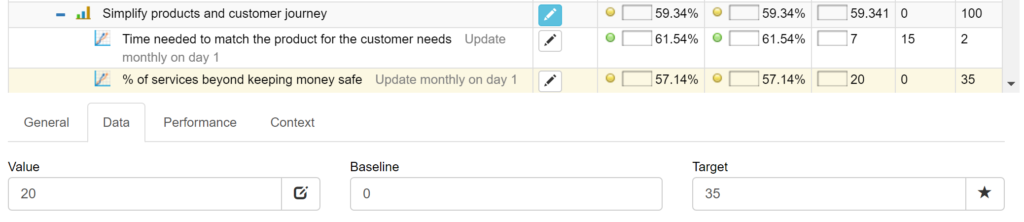
Simplify Products and Customer Journey
The complexity challenge mentioned above can be mapped as “Simplify products and customer journey” goal with two initiatives:
- Reduce products portfolio
- Simplify pricing
As we discussed before, complexity is an important factor in customer engagement. Let’s think about complexity in the context of retail banking. Banks tend to overload their portfolios with similar products that are hard to compare and contrast by the customers.
When Apple faced a similar product line complexity problem, Jobs asked his top managers – “Which ones do I tell my friends to buy?” Without having a satisfactory answer, he reduced the number of products by 70%.
How to measure the complexity of the product portfolio and customer journey? We discussed some standard approaches in the complexity article:
- Measure time. Time that managers need to match the product with the customer needs. Time that customers need to choose the best product.
- Measure the connections/components/levels. Is the offer explained on a single page? Are there many references to the conditions that customer need to satisfy in order to have this product or to have it for free?
- Track “Shortest message length” (that’s what Steve Jobs did asking “Which ones do I tell my friends to buy?” question). How many words does the bank’s manager need to explain the detail of their offer?
Another metric to track the successful achievement of the “simplify products” goal is:
- % of services beyond keeping money safe.
If the bank’s strategy in simplifying product portfolio was a success, managers will see that customers are more willing to contract services beyond basic bank service (e.g. keeping money safe).
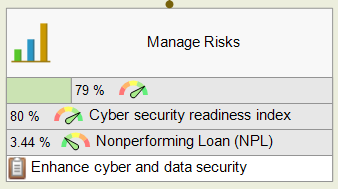
Manage Risks Goal
Another goal that supports the “Trust” goal is effective risk management with “Enhance cyber and data security” initiative. Most banks do regular risk assessments to identify potential threats and vulnerabilities.
How to measure cybersecurity? Obviously, we don’t want to measure just the number of accidents; we need to focus on leading/preventing plan. I would suggest a bank use one of the cybersecurity measurement frameworks (probably suggested by the regulator), for example, the NIST framework. The index metric for the strategy scorecard might be formulated as:
- Cybersecurity readiness index
Implementing near miss reporting is a good idea in terms of cybersecurity readiness.
Additionally, we can track financial risks associated with basic banking services:
- Nonperforming Loan (NPL)
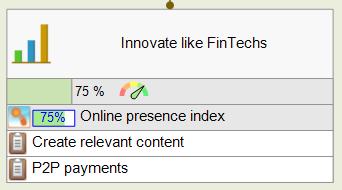
Innovate Like FinTechs
FinTech companies are definitely better communicators than classical financial organizations.
One of the relevant improvement initiatives might be:
- Create relevant content
Measured by:
- Online presence index (based on qualified blog posts created and similar social media metrics)
More initiatives can be aligned with this goal after a SWOT or Gap analysis of the bank’s product offer.
As an example, I’ve added P2P payments. It was mastered by the Bank of America (see the shareholder’s report for 2017), but the biggest Spanish banks are still losing the battle to FinTechs.
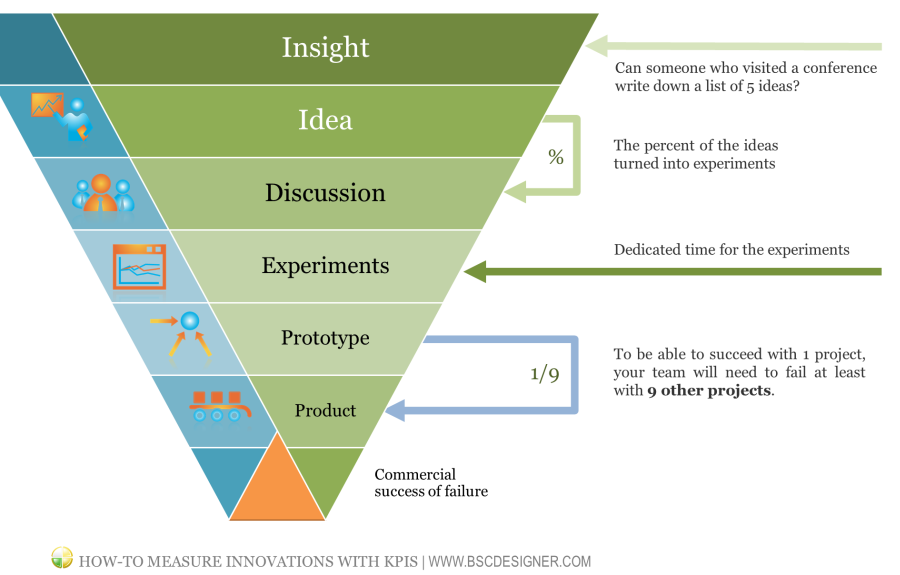
Looking at the innovation challenge in general, I would say that banks need to adopt a more agile innovation framework.
“More agile” in this case means being more systematic about filling in the ideas pool and converting more ideas into the tested and prototyped offers.
Here you can find some specific KPIs to measure innovations.
Master Customer Touchpoints
Both “Innovate like FinTechs” and “Master customer touch points” goals are aligned with “Unbiased financial advice” from the Customer perspective.
We have discussed the innovation challenge above; it’s about providing customers with the information and product that fulfill their needs.
However, having great content is not enough. Even the best information needs to be properly delivered to the customer:
- Visiting the bank’s branch is the less preferred communication option by the young generation.
- Calling a customer by phone might be easy for a bank manager, but it won’t impress tech-savvy clients.
FinTechs organically communicate with their customers via smartphone apps and websites.
Should banks follow the same trend? It depends on many factors. Start with mapping the touchpoints that the bank has with its customers and develop an improvement plan.
How to find good KPIs for the touchpoints goal? Here are the steps to follow:
- Formulate the profile of the bank’s target group
- Find the analytics data for the preferred communication channels for the target group (e.g. phone, social media, email, messages, etc.)
- Compare the preferred communications channels with the bank’s ability to use them and with actual usage data.
For example, the bank’s target group are young customers who prefer receiving general news via social media.
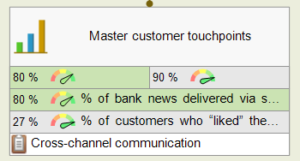
Your metrics, in this case, might be:
- % of bank news delivered via social media (leading metric)
- Average views and engagements (lagging metric)
- % of customers who “liked” the bank’s social media page (lagging metric)
It’s a good idea to benchmark engagement metrics for social media with other communication means (for email, these could be the % of opens and click-through rates) as well as with FinTechs competition (App installs, social media page likes, etc.) See the social metrics article for more metric ideas.
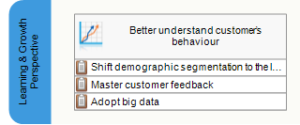
Learning and Growth Perspective
In analyzing the finding of EY reports as well as the strategies of the largest banks, we can define the following goals for the ![]() Learning and Growth perspective:
Learning and Growth perspective:
- Better understand customer’s behaviour
- Promote customer-centric culture
- Be a great place to work
- Find collaboration opportunities
- Community investment
All these goals contribute to the goals in the Internal perspective. We can link the goals on the strategy map or map them without the links to underline the idea that all learning goals are success factors to all goals from the Internal perspective.

Let’s review these goals one by one and try to come up with some performance metrics.
Better Understand Customer’s Behaviour
For a long time, banks relied on the classical demographic model that included such parameters as customer’s age and wealth.
This worked well decades ago when an average person could have lifelong employment, didn’t buy online, and rarely traveled to another country.
A better approach should be based on an analysis of a customer’s financial and technical habits, as well as lifestyle in general.
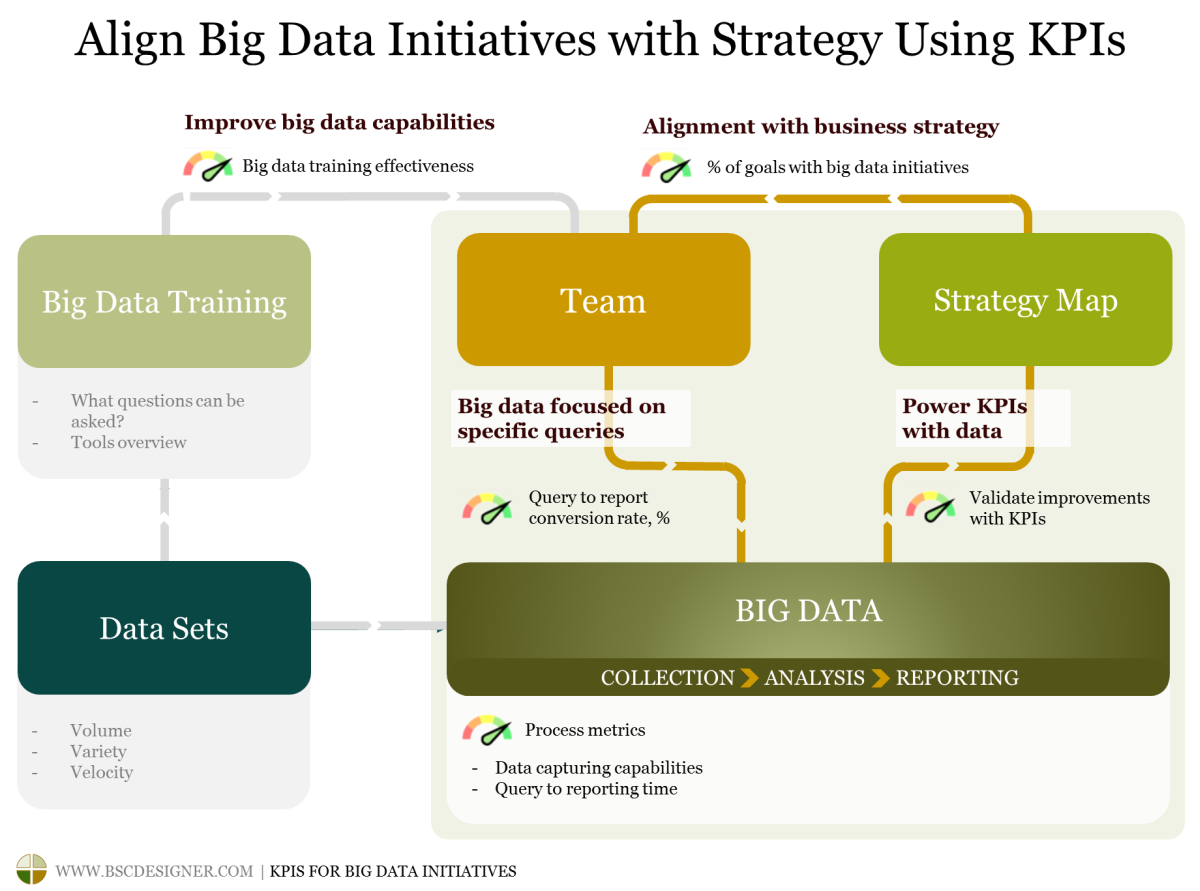
Big data gives necessary technical means for this, but it’s not sufficient to accumulate large volumes of data; the bank manager should be able to formulate the queries of interest to the data specialists.
From the viewpoint of performance measurement, the big data efforts can be successfully quantified and measured. You will find specific metric examples in the “KPIs for Big Data Initiatives” article.
Promote Customer-Centric Culture
A customer-centric culture is about establishing business habits that focus on customer needs, not on achieving short-term financial goals or keeping performance indicators in the green zone.
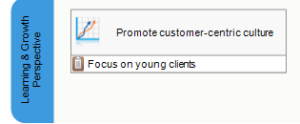
I would suggest starting with two growth points for establishing customer-centric culture in a financial organization:
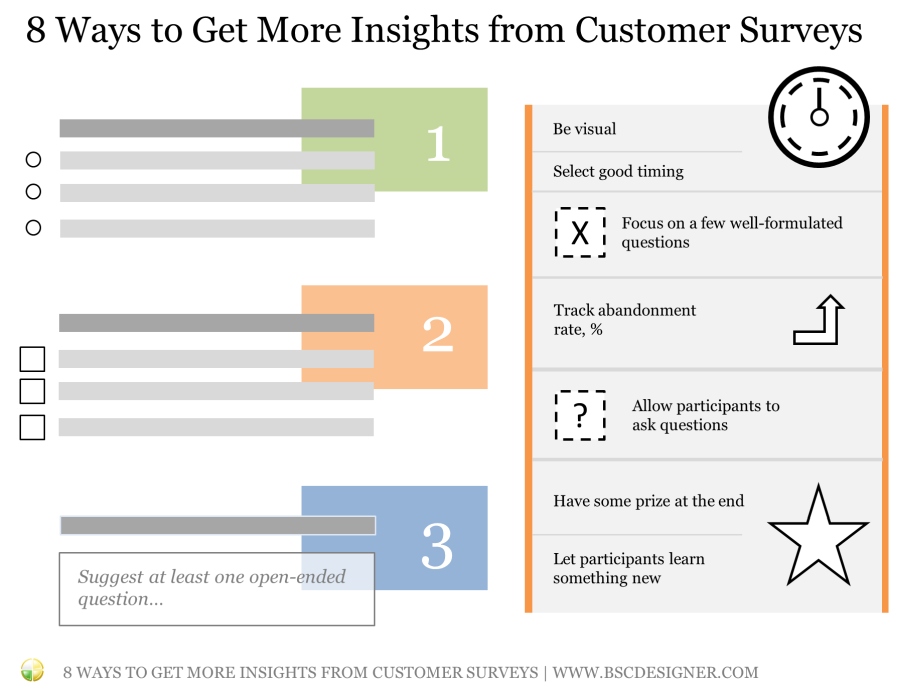
Growth Point 1: Improve the ways the organization listens to its customers
Most likely the financial organization already has some system to get regular feedback from their clients; the challenge is to update this system to fit with the fast-paced modern world. I’ve shared some specific recommendations in the customer surveys article.
Growth Point 2: Update performance measurement culture, so that employees won’t be judged on poorly designed KPIs
Bad KPIs can harm a lot – we saw this in the Wells Fargo case. Bad KPIs are shifting employee behaviour from “serving clients” to “fulfilling KPIs.” The solution is to replace old performance measurement habits with more effective ones. We discuss the detail in “5 Steps to Establish a Good Performance Measurement Culture” article.
Be a Great Place to Work
All financial organizations that I reviewed for this article had talent-related goals on their strategies.
Goals of a bank are similar to ones formulated by any other businesses – attract, develop, and retain talents.
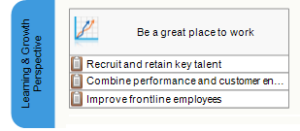
We’ve analyzed in detail the HR-related challenges and KPIs in the “HR KPIs and Talent Strategy Scorecard” article. I would recommend linking the bank’s top-level strategy scorecard to the Talent scorecard as described in the article.
Using BSC Designer for scorecard automation, we can easily do it by creating an imported indicator and linking it to the appropriate metric in the HR scorecard.
Find Collaboration Opportunities
Many financial organizations still struggle to formulate their FinTech6 strategy.
The need to embrace changes in the niche is obvious, and there are two solutions on the table:
- A bank can develop technology in-house or
- Partner with FinTechs.
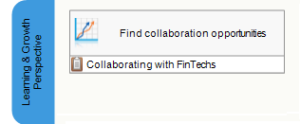
Should the bank have an app for a smartphone? I guess, the answer is obvious today. And probably, its business logic should be developed 100% inhouse. What about blockchain, sharing economy or customer intelligence? The solution in these cases might be about finding collaboration opportunities with FinTechs.Here in Spain, BBVA has the fame of innovative bank, their experiments with blockchain look promising.
Community investment
Supporting community goals is a strategic goal shared by most banks. The forms of investment in the community vary from supporting local business communities to financing affordable housing.
Many financial organizations (see, for example, Bank of America, ING, or Santander) aligned their community goals with UN Sustainable Development goals.
From the viewpoint of measurement, it might be hard to quantify and compare the impact of these investments with other organizations. One of the popular approaches, in this case, is the London Benchmarking Group (LBG) methodology that helps to measure corporate community contribution using a standardized framework. For example, the Santander bank used this framework7 to measure their social impact.
KPIs and Strategies of the Largest Banks
When writing this article, I was curious about performance measurement and reporting practices in the largest banks. I’ve taken a list of the largest banks by total assets and tried to find publicly available KPI or strategy data. Here, you have the links to the bank’s annual reports where information is normally included:
Largest banks by total assets:
- Industrial and Commercial Bank of China
- China Construction Bank Corporation
- Agricultural Bank of China
- Bank of China
- Mitsubishi UFJ Financial Group
- JPMorgan Chase
- HSBC
- BNP Paribas
- Bank of America
- Crédit Agricole
- Wells Fargo
- Japan Post Bank
- Citigroup
- Sumitomo Mitsui Financial Group
- Deutsche Bank
- Banco Santander
Some more links for the European banks:
Final Word
Banks have to embrace the emerging challenges in the financial domain provoked by the changing needs of the customers and competition from FinTechs.
- Many banks did a great job of simplifying their product portfolio, achieving transparency in fees, and better communications with their clients.
- FinTech companies have a lot to offer the end users and are getting much more attention from tech-savvy clients.
A good strategy for both banks and FinTechs is about finding partnership points where banks can leverage their brand and offline presence, while FinTechs can contribute with technology and experience.
In this article, we analyzed key trends and created a Balanced Scorecard for a bank to illustrate a possible response strategy. Besides the strategy aspect, financial organizations have to improve their performance measurement culture to avoid costly errors of using bad KPIs and give their employees a better idea about organization’s goals and the ways to achieve them.
What's next?- Follow our
 Strategy Implementation System to align stakeholders, strategic ambitions, and business frameworks into a comprehensive strategy.
 - Automate strategic planning with BSC Designer by organizing goals, initiatives, risks, and KPIs into scorecards.
More About Strategic Planning


- The Ernst & Young’s Global banking outlook 2018, EY, 2018 ↩
- The relevance challenge. What retail banks must do to remain in the game., EY, 2016 ↩
- Financial services technology 2020 and beyond: Embracing disruption, PWC, 2016 ↩
- Annual Report 2018, Bank of America, 2018 ↩
- Banking system trust, bank trust, and bank loyalty, Pauline W.J. van Esterik-Plasmeijer, W. Fred van Raaij, 2017, International Journal of Bank Marketing, Vol. 35 Issue: 1, pp.97-111 ↩
- Financial services firms are embracing fintech, KPMG ↩
- Social impact metrics to drive Santander mission of helping people and business prosper, Social and Human Capital Coalition, 2017 ↩
![]() CEO | Author | Speaker
CEO | Author | Speaker
BSC Designer is strategy execution software that enhances strategy formulation and execution through tangible KPIs. Our proprietary strategy implementation system reflects our practical experience in the strategy domain.
I learn a lot, thank you Alecksey